Housing Delivery Monitor - Including 5 Year Housing Land Supply Position at 31 March 2021 - Reigate and Banstead Borough ...
←
→
Page content transcription
If your browser does not render page correctly, please read the page content below
Housing Delivery Monitor

Including 5 Year Housing Land Supply

Position at 31 March 2021
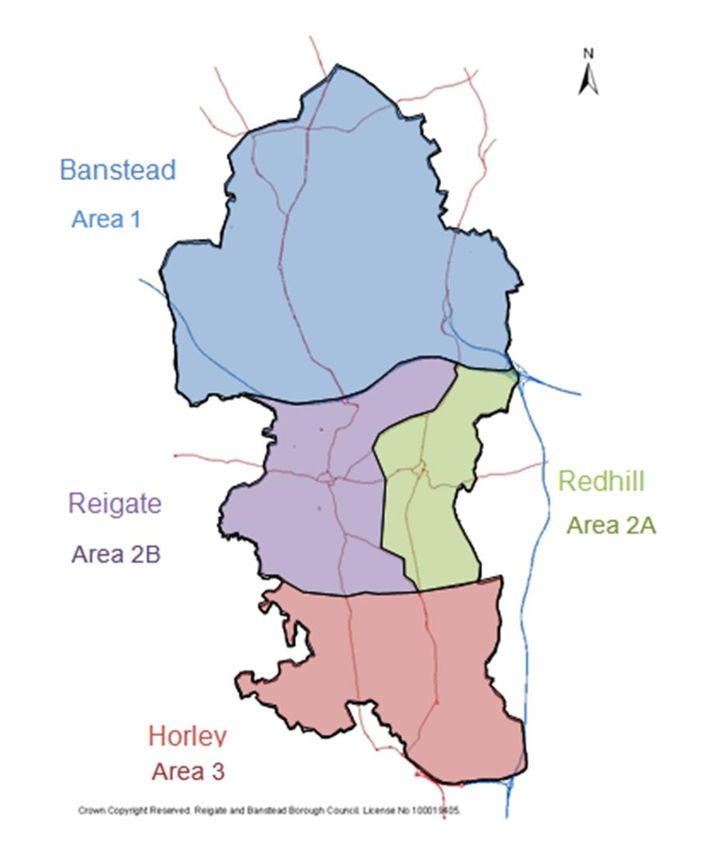
Figure 1: Reigate & Banstead Core Strategy borough map

                                                         2
Table of Contents

1.       Introduction ............................................................................................................... 5
     1.1.      Housing Delivery Test .......................................................................................... 6
     1.2.      Future Policy Developments ................................................................................ 6
     1.3.      Relevant Strategic Policies and Indictors ............................................................. 7
     1.4.      Geographical Information ..................................................................................... 8
2.       Housing Market ....................................................................................................... 10
     2.1.      Average Sale Values .......................................................................................... 10
     2.2.      Average Sale Value by Dwelling Type ............................................................... 11
     2.3.      Affordability ........................................................................................................ 11
     2.4.      Transaction Volumes.......................................................................................... 12
     2.5.      Existing Housing Stock....................................................................................... 13
3.  Housing Delivery Trends (including C2 Older Persons’ Care and Nursing
Homes) .............................................................................................................................. 15
     3.1.      Overall Plan Period Completions Rates (2012 – 2021) ...................................... 16
     3.2.      Large Site Completion Rates ............................................................................. 17
     3.3.      Small Site Completions ...................................................................................... 18
4.  Completion Characteristics (excluding C2 Older Persons’ Care and Nursing
Homes) .............................................................................................................................. 19
     4.1.      Sources of Supply – Previous Land Use ............................................................ 19
     4.2.      Sources of Supply – Designation ....................................................................... 20
     4.3.      Sources of Supply – Prior Approval ................................................................... 21
     4.4.      Housing Density ................................................................................................. 22
     4.5.      Dwelling Size and Type ...................................................................................... 23
     4.6.      Affordable Housing ............................................................................................. 27
5.   New Permissions Characteristics (excluding C2 Older Persons’ Care and
Nursing Homes)................................................................................................................ 30
     5.1.      Number of New Permissions .............................................................................. 30
     5.2.      Sources of New Permissions – Previous Land Use ........................................... 30
     5.3.      Sources of New Permissions – Designation....................................................... 31
     5.4.      Housing Density ................................................................................................. 32
     5.5.      Dwelling Type and Size ...................................................................................... 33
     5.6.      Provision of Affordable Housing – New Permissions.......................................... 34

                                                                                                                                      3
6. Self and Custom Housebuilding Register ............................................................ 35
7. Housing Supply & Delivery Position ..................................................................... 36
7.1. Five Year Housing Requirement ........................................................................ 36
7.2. Sources of Deliverable Land Supply .................................................................. 39
7.3. Summary of Five Year Land Supply Position ..................................................... 44
8. Five Year Supply of Deliverable Land for Gypsies, Travellers and Traveling
Showpeople Accommodation ......................................................................................... 46
8.1. Background ........................................................................................................ 46
8.2. Need................................................................................................................... 47
8.3. Supply ................................................................................................................ 48
8.4. Conclusion ......................................................................................................... 51
9. Summary of Key Findings...................................................................................... 52
Appendices ....................................................................................................................... 54
Appendix 1: Housing Land Supply Supplementary Tables ............................................. 54
Appendix 2: Gypsies, Travellers and Travelling Showpeople Accommodation .............. 93
Please Note:
The information contained within this monitor details housing completions and outstanding permissions
within Reigate & Banstead during the period 1 April 2020 to 31 March 2021. The housing trajectory and five
year land supply is compiled using monitoring data at 31 March 2021 and information obtained from
landowner/developer surveys and the May 2018 update of the Housing Economic Land Availability
Assessment.
Whilst every care has been taken to ensure that the information in this monitor is accurate, the Council
accepts no responsibility for any errors or omissions. We would be grateful if our attention was drawn to
any inaccuracies so that they might be corrected. Similarly, any suggestions that would make the
information more useful would be gratefully received.
Data is continuously reviewed as an on-going process and new information can be discovered that impacts
permissions and completions stated in previous Housing Monitoring Reports. To keep our statistics up-to-
date and accurate, information reported in previous versions of this monitor will be updated accordingly in
the latest Housing Monitor.
41. Introduction
The Housing monitor provides information on the general housing market and the current
amount, type and location of housing commitments and completions in the borough. Its
purpose is to:
• Provide data and analyses on the national and local housing market.
• Monitor and analyse the characteristics of housing supply including density, location
and type of housing against the relevant policies.
• Provide the base data for the evaluation of Local Plan and Core Strategy policies.
• Set out the borough’s five year deliverable land supply position.
The Ministry of Housing, Communities and Local Government (MHCLG) House building:
new build dwellings statistics for December 2020 reports a 17% decrease in the supply of
new build dwellings in England (December 2020 compared to December 2019) and 16%
decrease in the number of dwellings commencing construction during the same period.
The sharp decrease in starts and completions in the 2020/21 period reflects the national
restrictions imposed by the Government at the beginning of 2020 and the sharp increase
at the end of 2020 reflects the relaxation of the national restrictions.
The Halifax House Price Index reports that in March 2021, the annual average house
price in the UK was 9.5% higher than that in March 2020 and 2.4% higher than that of the
preceding quarter (October-December 2020). It notes that market activity continues to be
boosted by the government’s stamp duty holiday, with prospective buyers racing to
complete purchases in time to benefit from the maximum tax break, ahead of June’s
deadline. It also notes that for some homebuyers, lockdown restrictions have also
resulted in an unexpected build-up of savings, which can be used to fund bigger deposits,
for bigger properties, potentially pushing property prices even higher. These trends,
coupled with growing confidence in a more rapid recovery in economic activity if
restrictions continue to be eased, are likely to support house prices for some time to
come, particularly given the continued shortage of properties for sale.
The Royal Institute of Chartered Surveyors’ (RICS) UK Residential Market Survey for
March 2021 reports similar findings to the Halifax House Price Index; namely that the UK
housing market activity showed significant increase both in terms of buyer enquiries and
5agreed sales; a trend greatly attributed to the stamp duty holiday. The demand is
however still running ahead of supply, and more new instructions will be needed to
balance the market going forward.
1.1. Housing Delivery Test
The Ministry of Housing, Communities & Local Government (MHCLG) published the
results of its 2020 Housing Delivery Test in January 2021. The test compares the number
of net new homes provided by each local authority over the last three financial years
against the number of homes required, as set out in the relevant strategic policies for the
area. Where authorities deliver less than 95% of their assessed need they are required to
produce an action plan to assess the causes of under-delivery and identify actions to
increase delivery in future years; where housing delivery falls below 85% authorities are
required to apply a 20% buffer to the five year land supply requirement; and where
delivery falls below 75% the presumption in favour of sustainable development applies (in
line with Paragraph 11 and Footnote 7 of the National Planning Policy Framework ,
subject to transitional arrangements).
Lichfields’ ‘Effective of Defective: The Housing Delivery Test’ report states that just over
100 local authorities (107) saw housing delivery over the past three years fall below the
95% “pass rate”. A total of 55 of these authorities are required to apply the presumption in
favour of sustainable development, which is a large increase from previous year (8); 19 of
these authorities had recorded delivery of less than 85% and are therefore required to
apply a 20% buffer; and 33 of these authorities recorded delivery of between 85% and
95% and are therefore required to produce a housing delivery action plan. Reigate &
Banstead’s housing delivery test result was 120%.
1.2. Future Policy Developments
The Council has an up-to-date Local Plan:
The Core Strategy was formally adopted in July 2014 and was reviewed in accordance
with Regulation 10A of the Town and Country Planning (Local Planning) (England)
Regulations 2012 (as amended) in July 2019. The Core Strategy details how much
6growth will take place across the borough between 2012 and 2027 and sets out the
overarching strategic approach for delivering new development in the borough.
The Development Management Plan (DMP) was formally adopted in September 2019. It
contains detailed policies relating to the management of employment and retail
development and allocates sites for development across the borough.
1.3. Relevant Strategic Policies and Indictors
Table 1: Relevant Core Strategy and Development Management Plan (DMP) Policies
Policy Monitoring Indicator
% of new residential dwellings built on previously developed land.
CS10
Target – at least 50%
CS13 At least 6,900 additional dwellings between 2012 and 2027.
Type and size of units completed compared to the Council’s most
recent Strategic Housing Market Assessment (SHMA) or equivalent
CS14/DES4 Housing Needs Assessment (HNA) recommendations.
Appropriate mix of dwellings in line with housing need, site size &
characteristics.
Maintain a five year land supply position of gypsy, traveller and
travelling showpeople sites.
CS16
Identify sufficient site allocations in the Council’s DMP to meet the
identified need for gypsies, travellers and travelling show people.
7Policy Monitoring Indicator
A minimum of 1,500 gross new units of affordable housing between
2012 and 2027.
35% of affordable housing on site for allocated greenfield urban
DES6
extension sites.
30% of affordable housing on site for all other developments providing
11 or more homes.
Sets a proactive and forward looking approach to the management of
land supply based on the Council’s ‘urban first’ approach. Considering
MLS1 current or future shortfall in the five year land supply.
Sets clear and robust mechanisms for the release of urban extensions
sites.
The Core Strategy and Development Management Plan are available on the Council’s
website https://www.reigate-banstead.gov.uk/.
The Housing Monitoring Report measures the borough’s performance against the
indicators set out in the policies above. Information on housing permissions, completions
and projections are included within this monitor to provide an insight on how the borough
is performing against the policies outlined in the Core Strategy and DMP.
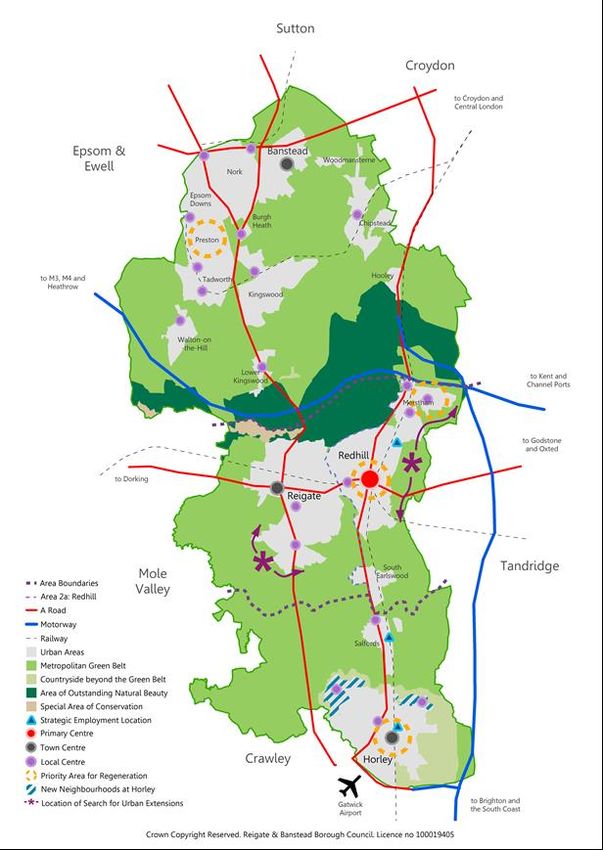
1.4. Geographical Information
The monitor presents information on the basis of the borough’s four main settlement
areas (see Figure 2 below):
• Area 1: The North Downs (Banstead)
• Area 2a: Wealden Greensand Ridge (Redhill and Merstham)
• Area 2b: Wealden Greensand Ridge (Reigate)
• Area 3: Low Weald (Horley)
8Figure 2: Reigate & Banstead Core Strategy Areas
92. Housing Market
2.1. Average Sale Values
Average sale values can be particularly sensitive to the mix and type of homes sold,
which can be influenced by local housing developments.
Figure 3 shows that the average sale values in the borough have been rising steadily
since 2011 and over the past 10 years, there has been a 70.0% increase in average sale
values (from £334,000 in Q1 2011/12 to £567,685 at Q4 2020/21).
Figure 3: Average sale values 2011 - 2021 (Land Registry data)
The Land Registry reports in their Price Paid Data (information on all property sales in
England and Wales that are sold for value and lodged with Land Registry for registration),
that over the last twelve months, the average sale value of properties in the borough has
decreased by 4.9% (from £597,254 in Q1 to £567,685 in Q4). However, when considered
on a year-on-year basis, the average sale value in 2019/20 was £541,920, rising to
£646,596 during the 2020/21 monitoring period, representing a 19.3% increase when
compared with the previous year’s average. This compares to a 10.2% year-on-year
increase recorded by the Land Registry for the UK as a whole (Land Registry UK House
Price Index).
10It should be noted that sale values for each quarter are recorded by RBBC at the end of
each quarter and reported on as a part of our Quarterly Key Performance Indicators. Due
to a 2 to 8 week delay between completion and registration of sales with the Land
Registry, the figures would have changed as more sales have been recorded since. The
figures for financial year 2020/21 shown in this monitor represent the most up to date sale
values available from HM Land Registry.
2.2. Average Sale Value by Dwelling Type
Figure 4 details the average sale value of properties within the borough over the
monitoring period by dwelling type. It shows that the average sale value for all types of
properties have increased over the last 12 months. Semi-detached and detached houses
experienced the highest increase. The average sale value of semi-detached houses
increased by 10.2% to £509,480, whilst detached properties increased by 9.4% to
£855,138.
Terraced houses also recorded a sizeable increase by 7.5% to an average price of
£418,439, whilst flats and maisonettes have only increased marginally by 0.8% to an
average value of £270,330.
Figure 4: Dwelling sale value trend 2011 - 2021 (Land Registry Data)
2.3. Affordability
Housing affordability is recognised as one of the most significant challenges facing the
housing market and one that has intensified over the past couple of decades. Based on
the data collected by the Office for National Statistics (ONS), over the last twelve months,
11the affordability ratio remained unchanged at 12.26. This means that the average
(median) house price in the borough now represents 12.26 times of the average (median)
gross annual workplace-based income.
Figure 5 shows that since 2010 the affordability ratio for Reigate & Banstead has risen
from 9.24 to 12.26. Similar trends in the slight increase in affordability have been seen
across Surrey as well as England. Whilst the affordability ratio in the borough is
considerable higher than the England average (7.84), it remains slightly below the levels
recorded across Surrey as a whole (12.67).
Figure 5: Affordability ratio comparison 2010 - 2020 (ONS data)
2.4. Transaction Volumes
Figure 6 shows that overall, there has been a 9.8% increase in the number of
transactions in this monitoring period compared with the last (1,850 to 2,031).
Whilst the first and last quarters saw small falls in the number of transactions (14.8% and
11.1% respectively) and Q2 recorded a minor increase (5.4%), it was Q3 which saw the
number of transactions shot up by 55.2% from 489 last year to 759 within this monitoring
12period.
Figure 6: Quarterly sales volume trend 2011 - 2021 (Land Registry Data)
2.5. Existing Housing Stock
Of the existing dwellings in the borough, the greatest proportion of dwellings are in Band
C, D and E (see table 2).
Table 2: Council tax band existing stock
Band 2020 2021
A 1,075 (1.7%) 1,099 (1.8%)
B 3,888 (6.3%) 4,066 (6.5%)
C 12,314 (19.9%) 12,475 (20.0%)
D 17,529 (28.4%) 17,713 (28.3%)
E 11,050 (17.9%) 11,188 (17.9%)
F 7,388 (12.0%) 7,454 (11.9%)
G 7,389 (12.0%) 7,411 (11.9%)
H 1,090 (1.8%) 1,100 (1.8%)
Total 61,723 62,506
13At the end of this monitoring period (31st March 2021), there were 1,215 empty properties
in the borough. Of those, 434 have been long term vacancies, having been empty for
over 6 months.
143. Housing Delivery Trends (including C2 Older Persons’ Care and Nursing Homes)
Table 3: Summary of Housing Delivery
153.1. Overall Plan Period Completions Rates (2012 – 2021)
As can be seen from table 3 above, net completions for 2020/21, including C2 elderly
person’s care and nursing homes, stand at 785; this is significantly above the Core
Strategy annual target of 460. It is also the highest annual delivery since the beginning of
the plan period, representing 60.2% increase on previous year (490) (see figure 7 for
details).
Figure 7: Net completion trend 2012 – 2021
Figure 8 shows the spatial distribution of net additional dwellings since 2012; it shows
that the majority of net additional dwellings have been completed within Redhill (Area 2a).
This is largely due to completions on the site of the former Liquid and Envy (planning
permission 16/02680/F for 133 units) and office to residential permitted development at
the Quadrant House (planning permission 19/01328/PAP for 124 units).
More than half of the units completed within the last twelve months (53.6%) have been
within Redhill, followed by just under a quarter in Horley (22.2%), 13.8% in Banstead and
10.4% in Reigate.
Examining completion trends, the proportion of net completions in Horley has fallen over
the past three years, whilst the proportion delivered in Redhill has been steadily
16increasing for the past three years.
Figure 8: Area contribution to total net completions 2012 – 2021
3.2. Large Site Completion Rates
Large site (sites providing 10 or more units) dwelling completions represented 82.4% of
all completions in 2020/21 – an increase on the previous year from 74.5%.
Unlike the previous three years, the greatest proportion of units delivered on sites of 10 or
more dwellings did not come from Horley but from Redhill (63.2%). This is mainly due to
the previously mentioned completions on the site of the former Liquid & Envy and office
to residential permitted development of the Quadrant house, as well as progress on sites
of the RNIB Soundscape in Redhill (planning permission 14/02562/F for 66 units within
RBBC with more units delivered in Tandridge) and Portland Drive in Merstham (planning
permission 13/02289/OUT for 50 gross units).
Horley accounted for 22.9% of completions on large sites, predominantly due to
completions on the Horley North West Sector site (planning permission 04/02120/OUT for
1.510 dwellings). Banstead area accounted for 9.9% of large site completions and
17Reigate, 4.0% (see figure 9 for details).
Figure 9: Large site net completion trend 2012 - 2021
3.3. Small Site Completions
Over the last year, there has been a slight decrease in the proportion of dwellings
completed on sites with less than 10 units. 17.6% of dwellings within this monitoring
period, compared to 25.5% previously. Figure 10 shows that most completions on small
sites came from the Reigate area (40.6%), followed by Banstead (31.9%) and Horley
(18.9%). The smallest proportion of small sites completions came from Redhill, with just
8.7%.
Figure 10: Small site net completion trend 2012 - 2021
184. Completion Characteristics (excluding C2 Older Persons’
Care and Nursing Homes)
4.1. Sources of Supply – Previous Land Use
Core Strategy Policy CS10 prioritises the use of previously developed land (PDL) in order
to promote the efficient and sustainable use of land. 79.4% of gross dwellings completed
within the last twelve months were built on PDL, which is above the Core Strategy
monitoring target of 50.0%.
Table 4 shows that within the last twelve months there has been an increase in the
percentage of dwellings built on PDL (from 52.6% to 79.4%). The majority of completions
not on PDL came from the Horley North West Sector which was previously greenfield
land (planning permission 04/02120/OUT) (66.5% of completions not on PDL).
Table 4: Previously developed land
2012/13 2013/14 2014/15 2015/16 2016/17 2017/18 2018/19 2019/20 2020/21
Dwellings 360 149 303 438 418 253 219 266 655
on PDL
% on PDL 69.4% 31.4% 61.8% 68.7% 69.2% 43.9% 39.0% 52.6% 79.4%
Figure 11 shows that just over a half of the completions on PDL (50.5%) came from the
redevelopment of commercial/industrial land and further 31.8% from developments on
19vacant land.
Figure 11: Previous land use of completed dwellings
4.2. Sources of Supply – Designation
As can be seen from figure 12, majority of dwellings completed within the last twelve
months came from urban sites without any specific designation (38.5%). Further 21.5%
were on housing sites allocated in the development plan, largely due to the completion of
units on the Horley North West Sector site (completion of 113 units within this monitoring
period) and the Former De Burgh School site (completion of 64 units within this
monitoring period).
Both of these sites were allocated in the 2005 Borough Local Plan but due to the size and
nature of the sites, they are only delivering units now. Conversely, no completions within
this monitoring period are from sites allocated in the Council’s recently adopted DMP.
This is not unexpected given that the DMP was only adopted in September 2019,
however, as discussed in the Housing Supply and Deliver Position section of this report,
a number of sites allocated in the DMP have achieved planning permission/ have a
resolution to grant planning permission/ have submitted planning applications. It is
expected that units will start to be delivered on these sites shortly.
Sites located within the borough’s town centres delivered further 20.1% of all completions
(compared to only 4% the previous year) and the remaining 19.9% of completions came
from sites located within Areas of Great Landscape Value, Conservation areas, Green
20belt, Local shopping centres and Residential areas of special character.
Figure 12: Designation of completed housing sites
Nearly half (46.2%) of those dwellings completed within this monitoring period were in the
priority locations for growth and regeneration in the borough (Redhill and Horley town
centres, Preston, Merstham, Horley North East and Horley North West). This is a slight
decrease on the proportion delivered in the previous monitoring period (62.8%).
8.4% of the dwellings completed were on unallocated sites outside the urban area.
Majority of those (68 dwellings) were on brownfield sites. The remaining one dwelling
came from the development site at the former Reigate Garden Centre. Although the site
was located in the Green Belt at the time of the permission being, it was removed from
the Green Belt after the adoption of the DMP in September 2019.
4.3. Sources of Supply – Prior Approval
Since the introduction of permitted development rights in 2013, 578 dwellings have been
completed in the borough via the prior approval route. Table 5 below shows that
specifically during the 2020/21 monitoring period 245 dwellings granted via prior approval
have been completed. This represents 31.2% of the total net completions during 2020/21
monitoring period. Majority of the units granted via prior approval were completed in the
Redhill area (217 units, 88.6%); 9.8% came from Horley (24 units) and 2 units were
completed in both Banstead and Reigate.
21Table 5: Dwelling completed on sites granted via prior approval
Monitoring Period Completed Dwellings
2013/14 1
2014/15 19
2015/16 132
2016/17 86
2017/18 41
2018/19 34
2019/20 20
2020/21 245
Total 578
4.4. Housing Density
Housing density is affected by factors such as the location of the site, the character of the
surrounding area and the size and shape of the site.
Whilst the borough does not have a specific density policy which requires developments
within specified areas to deliver dwellings at a specific density per hectare; Core Strategy
Policy CS10 ‘Sustainable Development’ requires that developments should reflect the
local character and levels of accessibility. DMP Policies DES1 ‘Design of new
development’, DES2 ‘Residential garden land development’ and DES3 ‘Residential Areas
of Special Character’ also seek to ensure that new development makes the best use of
land whilst also being well designed and protecting and enhancing local character and
distinctiveness.
Over a half of all completions (54.6%) came from high density sites (sites with density
over 100dph – dwellings per hectare), which is a major increase from the previous year
22(6.9%). Conversely, completions on low density sites (sites with a density of less than 40dph) have decreased from 72.5% last year to 38.9% within this monitoring period. Table 6: Density of completions
14 below for details.

Figure 14: Breakdown by dwelling type (2012 - 2021)

Table 7 shows that Redhill and Reigate recorded higher proportion of new flats, whilst
new houses dominated the completions in Banstead and Horley.

Table 7: Proportion of new flats & houses by borough area

                                            Flats                        Houses

    Area 1 - Banstead                    44 (5.3%)                   72 (62.1%)

    Area 2a - Redhill                   354 (83.3%)                  71 (16.7%)

    Area 2b - Reigate                    75 (68.8%)                  34 (31.2%)

    Area 3 - Horley                      52 (29.7%)                  123 (70.3%)

Core Strategy Policy CS14 ‘Housing needs of the community’ and DMP Policy DES4
‘Housing mix’ seek to ensure that a range of housing sizes is provided to encourage
balanced communities and provide households with a greater range of choices to enable
them to remain within the communities of which they are a part. Both policies require
housing sizes to reflect the Council’s most recent SHMA (or similar) and the
characteristics of the site and DMP Policy DES4 additionally requires:

•     Borough wide (excluding town and local centres):

                                                                                         24
o On sites of up to 20 homes, at least 20% of market housing should be provided
as smaller (one and two bedroom) homes.
o On sites of 20 homes or more, at least 30% of market housing should be
provided as smaller (one and two bedroom) homes and at least 30% of market
housing must be larger (three+ bedroom homes)
• Within town and local centres:
o On all schemes, at least half of all homes provided should be one and two
bedroom homes.
o On schemes of 20 or more homes, at least 10% of homes must have three or
more bedrooms.
Until the adoption of the DMP in September 2019, the 2012 SHMA was used to guide
housing sizes required on developments. Given that only 27 out of the 825 dwellings
have been completed on sites granted post-adoption, table 8 below compares the mix of
completions to SHMA 2012 Housing Market Recommendations.
It shows that within the last twelve months 69.1% of all completions were 1 and 2
bedroom dwellings and 30.9% of all completions were 3 and 4+ bedroom dwellings. This
indicates over delivery of smaller units, however it is worth noting that nearly half of the
smaller 1 & 2 bedroom units came from sites granted via prior approval, where the
Council cannot enforce recommended housing mix.
Table 8: Completions by size compared to SHMA recommendations
SHMA 2012 Market
Completions 2020/21 Housing
Recommendation
1 bedroom 43.2%
40%
2 bedrooms 25.9%
3 bedrooms 16.6%
60%
4+ bedrooms 14.3%
25Figure 15 shows variation in the completed dwelling size across the borough’s four areas.
Specifically, it shows that there is a greater number of completed 1 and 2-bedroom
properties in Redhill and Reigate, while larger 3+ bedroom properties dominate in
Banstead and Horley area.
Figure 15: Completed dwelling size by borough area
In January 2020, the Council updated its 2012 SHMA. The 2019 Housing Needs
Assessment recommends the following mix of properties (see table 9):
Table 9: 2019 Housing needs assessment recommendations
Affordable Home
Affordable Rented Market Housing
Ownership
1 bedroom 20% 20% 5%
2 bedrooms 40% 45% 25%
3 bedrooms 30% 25% 40%
4+ bedrooms 10% 10% 30%
It does not however suggest that these prescriptive figures should necessarily be
provided on each site but rather that they should be used to inform the mix required as
part of new developments (as required by criterion 1(b) of DMP Policy DES4) and to
26inform the size requirements in the revised 2020 Affordable Housing Supplementary
Planning Document (SPD).
Given that the report was only produced in January 2020, and that only 18 completions
have been on sites granted since January 2020, the proportion of completions have not
been compared to these recommendations. In terms of market housing, the general split
of 40% of 1 & 2 bedroom dwellings and 60% of 3+ bedroom dwellings recommended in
the 2012 SHMA would apply. Within the last monitoring period, 70.8% of market housing
completions were 1 & 2 bedroom properties and 33.2% of market housing completions
were 3 or more bedroom properties. As previously mentioned, the over delivery of smaller
units was greatly influenced by the number of units delivered on sites granted via prior
approval, where the Council has no influence over the mix of size and tenure. Affordable
housing size mix will be discussed later in the report.
4.6. Affordable Housing
As can be seen from table 10, within this monitoring period 93 affordable units have been
completed (11.3% of all gross C3 completions). This is just below the Core Strategy
Monitoring target to provide 100 additional affordable dwellings per annum and is a
decrease from a previous year (133 gross units). It should however be noted that the
actual affordable housing target is for a delivery of 1,500 units between 2012-2027, rather
than 100 units per annum. If split evenly, the expected target to date would be 900 units
delivered since 2012. So far, 918 units of affordable housing have been delivered, which
is above the overall target at this point in time. No affordable housing has been lost
during this monitoring period as a result of demolitions.
Table 10: Affordable housing completions summary
Gross Completions
Total Units Completed 2020/21 825
Affordable Completions 93
Affordable Demolitions 0
Affordable (%) 11.3%
27DMP Policy DES6 ‘Affordable Housing’ requires the tenure mix of affordable housing
provided on each qualifying site to contribute (to the Council’s satisfaction) towards
meeting the latest assessment of affordable housing needs. The Council’s most recent
assessment of affordable housing needs is provided in the 2019 Housing Needs
Assessment and the Council’s 2020 Affordable Housing SPD. This identifies the need to
provide 62% rented and 38% other affordable home ownership products.
Prior to the publication of the 2019 Housing Needs Assessment in January 2020, the
Council’s 2012 SHMA has been used to provide recommended mix of affordable housing
as 40% social/ affordable rented and 60% shared ownership. Given that all affordable
housing completions came from sites that have been granted planning permissions prior
to the 2019 Housing Needs Assessment, the 2012 SHMA has been used to assess the
affordable housing mix for this monitoring period.
As can be seen from figure 16 below, 32 units (34.4%) of social/ affordable rented
housing and 61 units of shared ownership housing (65.5%) have been delivered during
this monitoring period. This is in line with the recommended affordable housing mix in the
2012 SHMA. In total, 918 gross units of affordable housing have been delivered since the
start of the plan period in 2012/13 (413 units of social/ affordable rented properties and
505 units of shared ownership properties).
Figure 16: Affordable housing completions trend (gross units)
The recommended size mix of affordable housing has already been mentioned in section
4.5. and the recommendations as advised by the 2019 Housing Needs Assessment can
28be seen in table 9. Given that all affordable housing completions were on sites granted
planning permission prior to the publication of the 2019 Housing Needs Assessment in
January 2020, the recommended affordable housing mix from the 2012 SHMA (see table
11) has been used instead to assess the affordable housing mix during this monitoring
period.
Table 11: 2012 SHMA recommended affordable housing mix
Number of bedrooms Social/ Affordable rent Shared ownership
1 & 2 bedroom dwellings 75% 85%
3+ bedroom dwellings 25% 15%
Table 12 shows that within the last monitoring period, both social/affordable rented and
shared ownership properties delivered slightly more 1 & 2 bedroom properties, compared
to the 2012 SHMA recommendation. Social/ affordable rent 1 & 2 bedroom properties
accounted for 84.4% of all social/ affordable rented homes (compared to 75% 2012
SHMA recommendation) and shared ownership 1 & 2 bedroom properties represented
88.5% of all shared ownership units (compared to 85% 2012 SHMA recommendation).
Table 12: Affordable housing completions - size and tenure mix 2020/21
Number of bedrooms Social/ Affordable rent Shared ownership
1 & 2 bedroom dwellings 84.4% 88.5%
3+ bedroom dwellings 15.5% 11.5%
295. New Permissions Characteristics (excluding C2 Older
Persons’ Care and Nursing Homes)
5.1. Number of New Permissions
Within the last twelve months, 124 planning permissions were approved; these have the
potential to deliver 490 net dwellings.
Excluding sites which were subsequently substituted (4 planning permissions, 8 net
dwellings), 120 deliverable planning permissions (482 net dwellings) were granted in this
monitoring period.
As can be seen from table 13, the split of net dwellings permitted on large and small sites
has been even within this monitoring period (52.7% on large sites and 47.3% on small
sites). This is unlike the previous couple of years where large sites provided majority of
permitted dwellings (75.8% in 2019/20 and 64.9% in 2018/19). Redhill saw the largest
proportion of newly permitted net dwellings (40.7%) with Banstead and Horley following
with 24.5% and 21.2% respectively. Within this monitoring period, Reigate had the
smallest proportion, accounting for 13.7% of newly permitted net dwellings.
Table 13: Number of net new units permitted
Area 1 - Area 2a - Area 2b -
Site size Area 3 - Horley Total
Banstead Redhill Reigate
Large
30 (30 gross) 157 (157 gross) 12 (12 gross) 55 (55 gross) 254 (254 gross)
(10+ units)
Small
88 (113 gross) 39 (53 gross) 54 (61 gross) 47 (53 gross) 228 (280 gross)
(46.4%) can be attributed to office to residential, industrial to residential or retail to
residential permitted development rights.
Figure 17: Previous land use of new permissions
5.3. Sources of New Permissions – Designation
Of those, not subsequently substituted, most of the gross new dwellings permitted in this
monitoring period (39.9%) came from the undesignated urban area (see figure 18). This
compares to 41.5% of the dwellings permitted in the last monitoring period.
Town centres also accounted for a good proportion of permitted dwellings (20.4% of new
permitted dwellings). Most of the new permitted units within the town centres came from
Redhill and Horley town centres (45.9% and 43.1%), mostly attributed to office to
residential permitted development (45 out of 50 units in Redhill and 44 out of 47 units in
Horley were granted via prior approval for office to residential conversion). Notable
schemes within Redhill and Horley town centres include the change of use of Aquila
House in Redhill (prior approval 20/02733/PAP for 45 residential units) and Victoria
31House in Horley (prior approval 20/02823/PAP for 22 units). Figure 18: Policy designation of new permissions 5.4. Housing Density Permitted housing density is affected by factors such as the location of the site, the character of the surrounding area and the size and shape of the site. Table 14 shows that the greatest proportion of the dwellings (gross) permitted within the last twelve months (excluding sites which have subsequently been substituted) were on high density sites with a density of more than 100 dwellings per hectare (dph). Although this has also been the case in the previous monitoring period, this year the proportion is smaller (34.1% compared with 58.2% during the previous monitoring period). This year, the density split is more even with the high density sites followed closely by sites with 60 – 100dph (29.4%, compared to 10.6% previous year) and low density sites with less than 40dph (28.8%, compared to 27.4% previous year). Table 14: Density of new permissions (dwellings per hectare)
5.5. Dwelling Type and Size
Just under three quarters (72.1%) of the permitted (gross) dwellings (excluding
permissions subsequently substituted) within the last twelve months were for 1 or 2
bedroomed properties (38.4% 1 bedroom and 33.7% 2 bedroom). See table 15 for
details.

This high percentage is in part due to several high capacity flat redevelopments, including
Aquila House in Redhill (45 flats), the Victoria House, Horley (22 flats) and Kingsfield
Business Centre, Redhill (29 flats).

Table 15: Size and type of newly permitted dwellings

                                Flats                  Houses                 Total

1 bedroom                        200                     5                       205

2 bedrooms                       163                     17                      180

3 bedrooms                        7                      60                      67

4+ bedrooms                       0                      82                      82

Total                            370                    164                      534

Table 16 shows that all areas experienced greater proportion of flats being permitted
within this monitoring period. Redhill had the highest proportion (73.8% of flats), followed
by Reigate (69.9%), Horley (67.6%) and Banstead (63.6%).

Table 16: Proportion of newly permitted houses and flats by borough area

                                           Flats                         Houses

Area 1 - Banstead                            91                             52

Area 2a - Redhill                           155                             55

Area 2b - Reigate                            51                             22

Area 3 - Horley                              73                             35

                                                                                           33
5.6. Provision of Affordable Housing – New Permissions
DMP Policy DES6 states, that on all sites (other than greenfield urban extensions)
providing 11 or more homes, 30% of the homes on the site should be affordable housing.
Within regeneration sites, lower proportion of affordable housing may be accepted in
order to achieve other regeneration aims, including improving the mix of local housing
stock.
In exceptional circumstances, where it can be robustly justified, should the Council
consider it would not be suitable or practical to provide affordable housing on site, it may
accept affordable housing provided on an alternative site or as a payment in lieu.
Excluding prior approvals, where the Council cannot control the provision of affordable
housing, and applications subsequently substituted, 4 schemes over 11 units were
granted planning permission during this monitoring period. Of those, 2 schemes provided
on site affordable housing in line with the DMP Policy DES6 and 2 schemes agreed
financial contribution towards off site affordable housing provision (see table 17 for
details).
Table 17: Affordable housing provision on newly permitted sites
Planning
Comments
permission
Financial contribution towards offsite affordable housing was agreed
between the Council and the applicant. It was considered reasonable as
19/01488/F
the application was submitted prior to the adoption of the DMP, when
for 14 units
financial contribution was required for sites between 11 – 14 dwellings by
the Core Strategy Policy CS15.
18/02276/F 25 units of affordable housing were secured by section 106 agreement, in
for 83 units line with the requirements of the DMP Policy DES6.
Financial contribution towards offsite affordable housing was agreed
between the Council and the applicant. It was considered reasonable as
18/02680/F
the application was submitted prior to the adoption of the DMP, when
for 14 units
financial contribution was required for sites between 11 – 14 dwellings by
the Core Strategy Policy CS15.
In line with DMP Policy DES6, 9 units of affordable housing were required,
however, taking into account vacant building credit (in line with the revised
19/01605/F
NPPF, PPG and the Council’s Affordable Housing SPD 2020), the
for 29 units
requirement was reduced to 3 units of affordable housing, which have
been secured by section 106 agreement.
346. Self and Custom Housebuilding Register
The Self-Build and Custom Housebuilding Act 2015 requires local authorities to keep a
register of individuals and/or associations interested in acquiring serviced plots of land
within their administrative areas for the purpose of building houses to occupy as a main
place of residence.
At 31 March 2021, 62 applicants had been accepted to the Register, expressing an
interest in acquiring plots for self/custom housebuilding.
Between 31 October 2019 and 30 October 2020 (the most recent whole base period prior
to 31 March 2021), the Council approved 20 applications for self-build properties, fulfilling
the government’s requirement that equivalent permissions per base period are provided,
within three years of the given base period ending. (There were 18 accepted applications
in the second base period: 31 October 2016 to 30 October 2017).
The relevant base-period to 31 March 2021 has so far accepted applications from 4
eligible individuals. The types of location preferred are mixed, but detached homes are
preferred by all accepted applicants.
Table 18: Number of eligible applicants accepted to the Self and Custom housebuilding
register
Base period Number of eligible applicants
01 May 16 – 30 Oct 16 19
31 Oct 16 – 30 Oct 17 18
31 Oct 17 – 30 Oct 18 4
31 Oct 18 – 30 Oct 19 7
31 Oct 19 – 30 Oct 20 10
31 Oct 20 – 31 March 21 4
Total individuals accepted to the 62
register (at 31 Mar 2021)
357. Housing Supply & Delivery Position
7.1. Five Year Housing Requirement
Paragraph 73 of the revised National Planning Policy Framework (NPPF) requires local
planning authorities to identify and update annually a supply of specific deliverable sites
(see the revised NPPF glossary for definition of deliverable). These should be sufficient to
provide a minimum of five years’ worth of housing against their housing requirement set
out in adopted strategic policies, or against their local housing need where the strategic
policies are more than five years old unless these strategic policies have been reviewed
and found not to require updating. If an authority cannot demonstrate a five year land
supply (plus any relevant buffer) the presumption in favour of sustainable development
will apply as set out in Footnote 7 and Paragraph 11d of the revised NPPF.
Reigate & Banstead Borough Council has up-to-date strategic policies. Whilst the Core
Strategy was adopted on 3rdJuly 2014 and is therefore more than 5 years old, on 2nd July
2019, in accordance with Regulation 10A of the Town & Country Planning (Local
Planning) (England) Regulations 2012 (as amended), the Council approved the review of
the Core Strategy. The review comprehensively assessed each policy in turn against a
range of evidence and information and found that there was no need to update the Core
Strategy at this point in time.
Core Strategy Policy CS13 ‘Housing Delivery’ includes a requirement to deliver at least
6,900 dwellings between 1st April 2012 and 31st March 2027. This equates to an annual
average provision of 460 units per annum. The Council’s five year requirement, with no
account for past delivery or the NPPF buffer, is therefore 2,300 (460 x 5) dwellings.
Plan Period Performance
The 2019 updated national Planning Practice Guidance (PPG)(paragraph 029 Reference
ID: 68-029-20190722) states that for the purposes of calculating five year land supply,
housing completions should include new build dwellings, conversions, changes of use
and demolitions and redevelopments and that completions should be net figures, so
should offset any demolitions.
36Furthermore, the updated PPG (Paragraph 035 Reference ID: 68-6035-20190722)
advises that local planning authorities will need to count housing provided for older
people, including residential institutions in Use Class C2, as part of their housing land
supply against their housing requirement.
Taking the above guidance into account, tables 19 & 20 summarise progress made
against the Core Strategy housing requirement. They show that since 1st April 2012,
4,922 net dwellings were completed within the borough (equating to an annual average
completion of 547 units), leaving an outstanding requirement of 1,978 dwellings over the
plan period.
Table 19: Summary of housing delivery 2012 - 2021
C2 Old Persons’
C3 Residential Completions
Homes Completions
Position
Total Net Against
Year
Completions Target
Market Affordable Total Gross (460)
Demolitions Net Gain Loss Net
Housing Housing Completions
2012/13 444 75 519 36 483 1 0 1 484 5.2%
2013/14 372 103 475 36 439 40 0 40 479 4.1%
2014/15 342 148 490 36 454 0 0 0 454 -1.3%
2015/16 528 109 637 76 561 7 14 -7 554 20.4%
2016/17 514 90 604 81 523 47 0 47 570 23.9%
2017/18 478 99 577 27 550 47 0 47 597 29.8%
2018/19 494 68 562 42 520 0 11 -11 509 10.7%
2019/20 373 133 506 48 458 43 11 32 490 6.5%
2020/21 732 93 825 31 794 6 15 -9 785 70.7%
In line with PPG Paragraph 035 Reference ID: 68-035-20190722 the number of care home bedrooms has been
converted into a C3 equivalent to represent the contribution the C2 accommodation makes on housing released in the
housing market, using the current census data on the average number of adults living in households
37Table 20: Performance against Core Strategy - 2012 - 2027
Plan Period Target Net Actual Net Average Plan Plan
Cumulative
Housing Completions to Completions to Completions Requirement Requirement
Oversupply
Requirement Date Date per Year Completed Residual
6,900 4,140 4,922 547 782 71.3% 1,978
Oversupply
The updated PPG (Paragraph 032 Reference ID: 68-032-20190722) advises that where
areas deliver more completions than required, the additional supply can be used to offset
any shortfalls against requirements from previous years. Table 20 above shows that since
the beginning of the Core Strategy plan period, the Council has delivered 782 units above
the Core Strategy requirement of 460 dwellings per annum.
Buffer
Paragraph 73 of the revised NPPF and Paragraph 022 of the PPG advise that to ensure
that there is a realistic prospect of achieving the planned level of housing supply, a buffer
(moved forward from later in the plan period) should be added to the requirement in the
first five years (including any shortfall). The buffer is not cumulative and depending on
circumstances should be:
a) 5% to ensure choice and competition in the market for land; or
b) 10% where the local planning authority wishes to demonstrate a five year supply of
deliverable sites through an annual position statement or recently adopted plan, to
account for any fluctuations in the market during that year; or
c) 20% where there has been significant under delivery of housing over the previous
three years, to improve the prospect of achieving the planned supply. Footnote 39
advises that from November 2018, this will be measured against the Housing Delivery
Test, where this indicates that delivery was below 85% of the housing requirement.
The Council has applied a 5% buffer to its five year land supply – the Council’s 2020
Housing Delivery Test returned a positive score of 120% and the Council is not seeking
to demonstrate its five year land supply through an annual position statement.
38Table 21: Summary of 5 Year Requirement
Source No of dwellings
1. Five year housing land supply requirement 2,300
(5 * 460)
2. 5% Buffer 115
(5% of 2,300)
3. Previous oversupply 782
4. Overall Housing Requirement 1,633
(1 + 2 – 3)
As shown in table 21 above, the overall five year requirement is therefore 1,633
units (annual requirement of 327).
7.2. Sources of Deliverable Land Supply
The sources of supply which are included within the five year land supply comprise:
• Sites with planning permission (outline or full)
• Specific sites without planning permission
• Windfall allowance
Sites with Planning Permission
The revised NPPF states that sites which do not involve major development (defined in
the revised NPPF as over 10 units) and have planning permission should be considered
deliverable until permission expires, unless there is clear evidence that homes will not be
delivered within five years (for example because they are no longer viable, there is no
longer a demand for the type of units or sites have long term phasing plans).
In addition, the revised NPPF states that for major developments, sites with detailed
planning permission should be considered deliverable unless there is clear evidence that
39homes will not be delivered within five years. For sites with outline permission for major
development, the revised NPPF says that these should only be considered deliverable
where there is clear evidence that housing completions will begin on site within five years.
The PPG (Paragraph 007 Reference ID: 68-007-20190722) advises that clear evidence
may include: how much progress has been made towards the submission of an
application; how much progress has been made with site assessment work; and any
relevant information about site viability, ownership constraints or infrastructure provision.
In order to assess whether there is a realistic prospect that sites will deliver units within
the next five years and therefore be included within the five year land supply trajectory,
the Council:
• Wrote to all landowners/developers with planning permission to ascertain whether they
are likely to implement the development, what the rate of development would be and
how many units are likely to be completed within the next five years.
• Referred to the analysis of average lead-in times and build-out rates, undertaken in
2020 on permissions completed since the beginning of the plan period, to reality check
these assumptions. Table 22 below summarises average build-out rates and lead-in
times for sites completed since the beginning of the Core Strategy monitoring period
(01/04/2012). The full analyses can be found in the Appendix 2 of the 2020 Housing
Monitor.
Table 22: Overview of average lead-in times and build-out rates
Lead-in time (days
Build-out rate (days
between permission
Site Size between completion of 1st
granted and completion of
unit and site completion)
1st unit)
Small sites (less than 10
845 33
units)
Large sites (10 or more
778 228
units)
All sites 836 56
40Historically, instead of applying a non-implementation rate, the Council has removed sites
with a history of non-implementation and sites which are unlikely to come forward for
development based upon local knowledge and following ongoing discussions with
landowners and developers. The DMP Inspector considered this approach was justified
and noted that there is no requirement in national policy to include a non-implementation
rate (paragraph 136, Inspector’s Report on the Examination of the Reigate & Banstead
Development Management Plan).
As a result of this exercise 219 units have been excluded from the five year land supply
trajectory (see Appendix 1, Table 30 for details).
When assessing individual sites and their ability to deliver units within the next 5 years,
Reigate & Banstead Council have taken a very conservative approach, combining the
results of the landowner/developer survey and average lead-in times & build out rates.
Where the landowner/developer has indicated that the site may not come forward, the
site has been removed from the analysis.
Taking all of the above into consideration, a total of 2,245 outstanding net
additional dwellings on sites with planning permission have been included within
the 5 year housing land supply.
Appendix 1, Tables 31 & 32 provide a summary of all outstanding C3 dwellings by the
borough area and Table 33 provides a summary of additional units included within the 5
year land supply resulting from a conversion of C2 old person’s homes into a C3
equivalent, using the current census data (position at 01 April 2020). Tables 34 – 42
provide details of the justification for the inclusion of individual C3 and C2 sites.
41Specific Sites without Planning Permission
Through the HELAA and plan-making process, the Council has identified a number of
specific sites without planning permission which are deliverable within the five year supply
– most are identified as site allocations within the Council’s adopted Development
Management Plan, and others are sites which have resolutions to grant planning
permission. All sites allocated in the DMP are within priority locations for growth and
regeneration. The deliverability of these sites has been assessed by the Council in line
with the revised NPPF. Information is provided within Appendix 1, Table 43.
The deliverable capacity on specific sites without planning permission that will
come forward in the five years to 31st March 2026, taking into consideration any
phasing plans, is 294 net additional units.
Windfall Allowance
The revised NPPF (paragraph 70) defines windfall sites as “sites not specifically identified
in the development plan” and states that where an allowance is to be made for windfall
sites as part of anticipated supply, there should be compelling evidence that they will
provide a reliable source of supply. Any allowance should be realistic having regard to the
strategic housing land availability assessment, historic windfall delivery rates and
expected future trends.
The Council has included a windfall allowance of 375 dwellings (75 dwellings per annum)
in the five-year land supply trajectory. During the DMP examination, the Inspector
considered that this allowance was “robust and justified” (paragraph 135, DMP
Inspector’s Report) and table 23 below shows that since the beginning of the plan period,
permissions on windfall sites have significantly exceeded this allowance.
42Table 23: Windfall dwellings permitted during plan period
Number of dwellings permitted on
Financial Year
windfall sites
2012/13 402
2013/14 1,240
2014/15 571
2015/16 697
2016/17 510
2017/18 822
2018/19 642
2019/20 1,190
2020/21 432
Total 6,506
Average total per annum 723
The PPG (Paragraph 048 Reference ID 3-048-20180913) advises that local authorities
should include permissions granted for windfall development by year and show how this
compares with the windfall allowance. As can be seen from table 23 above, a total of
6,506 windfall dwellings have been permitted over the plan period, equating to an annual
average of 723.
The above figures represent all windfall permissions during the plan period. Since their
approval, a number of sites had a substitute permission issued. Taking these into
account, the actual number of dwellings coming forward from windfall sites over the plan
period was 3,775 (419 per year).
Therefore, in total a windfall allowance of 375 has been included within the five
year land supply trajectory.
43You can also read