City of Kirkland NE 85TH SAP Supplemental Study - Fiscal Impacts and Community Benefits Analysis
←
→
Page content transcription
If your browser does not render page correctly, please read the page content below
City of Kirkland NE 85 TH
SAP Supplemental Study
Fiscal Impacts and Community Benefits Analysis
Final Technical Memo
November 2021
Consultant Team
Mithun
BERK Consulting, Inc.
ECONorthwest
Fehr & Peers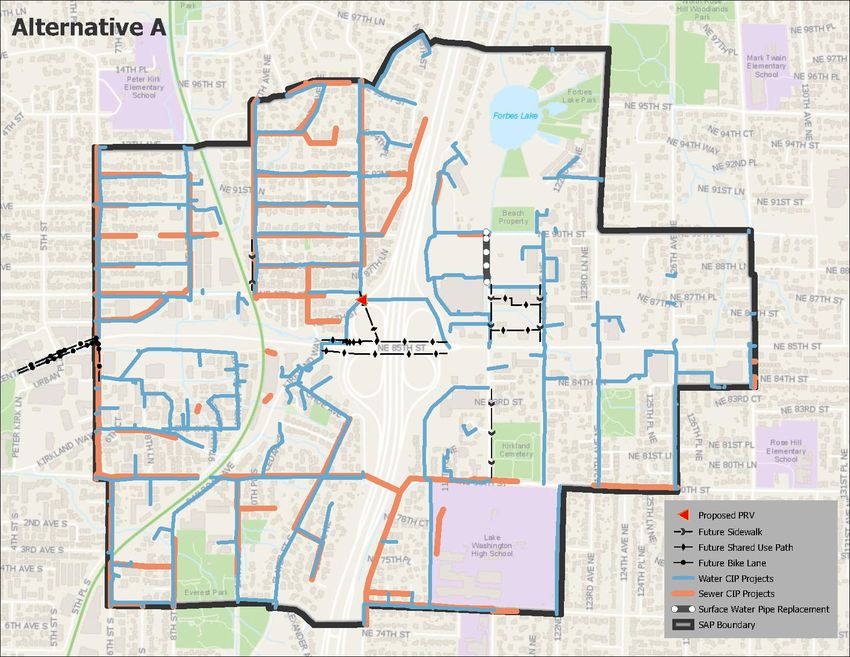
Contents
Executive Summary ................................................................................................................................ i
1.0       Introduction.............................................................................................................................. 1-1
   1.1       Project Context and Focus of this Supplemental Study ...................................................................... 1-1
   1.2       Structure of this Document ........................................................................................................................ 1-1
2.0       Growth Analysis: June Alternatives for Study ........................................................................ 2-1
   2.1       Summary of Employment and Residential Capacity in June Alternatives ....................................... 2-5
   2.2       Summary of Transportation Analysis of June Alternatives ................................................................. 2-6
3.0       Infrastructure Investment Methodology ................................................................................. 3-11
   3.1       Transportation .......................................................................................................................................... 3-13
   3.2       Water and Sewer ................................................................................................................................... 3-16
   3.3       Stormwater................................................................................................................................................ 3-18

4.0       Fiscal Impacts Analysis ........................................................................................................... 4-1
   4.1       Fiscal Analysis: Purpose and Context ..................................................................................................... 4-1
   4.2       Revenue Analysis Methodology .............................................................................................................. 4-4
   4.3       Cost Analysis Methodology ..................................................................................................................... 4-7
   4.4       Operating Revenues and Costs ............................................................................................................. 4-15
   4.5       Capital Revenues and Costs .................................................................................................................. 4-18
   4.6       Summary of Net Fiscal Impact ............................................................................................................... 4-31
   4.7       Sensitivity Analyses.................................................................................................................................. 4-32
5.0       Community Benefits Analysis ................................................................................................. 5-1
   5.1       Community Benefits Framework .............................................................................................................. 5-1
   5.2       Understanding Potential for Value Capture to Deliver Community Benefits .................................. 5-2
   5.3       Community Benefits Strategies ................................................................................................................ 5-8

6.0       Summary of Findings and Recommendations ......................................................................... 6-1
   6.1       Is the City’s Station Area Vision Feasible? ............................................................................................ 6-1
   6.2       Recommendations ...................................................................................................................................... 6-1

Appendices............................................................................................................................................. I
          1. Transportation Supplemental Study
          2. Water and Sewer Supplemental Study
          3. Stormwater Supplemental Study

         City of Kirkland NE 85TH SAP Supplemental Study
Exhibits
Exhibit 2-1. June Alternative A: Current Trends – Development Typologies .................................................. 2-3
Exhibit 2-2. June Alternative B: Transit Connected Growth- Development Typologies ................................ 2-3
Exhibit 2-3. Station Area Initial Concepts .............................................................................................................. 2-4
Exhibit 2-4. Employment and Household Totals Assumed in June Alternatives and DSEIS. .......................... 2-5
Exhibit 2-5. Employment and Residential Growth in June Alternative B.......................................................... 2-5
Exhibit 2-6. PM Peak Hour Vehicle Trip Generation using MXD+/BKR Model Mode Share Estimates .... 2-6
Exhibit 2-7. Traffic Volume Increase (2035 No Action vs. 2044 Alternative 2) ............................................ 2-7
Exhibit 2-8. Traffic Volume Increase (2035 No Action vs. 2044 Alternative B) ............................................ 2-7
Exhibit 2-9. LOS Results for Evaluated Alternatives (without mitigation) ....................................................... 2-10
Exhibit 2-10. LOS and Average Control Delay ................................................................................................. 2-10
Exhibit 3-1. June Alternative A – Representative Infrastructure Investments ................................................ 3-11
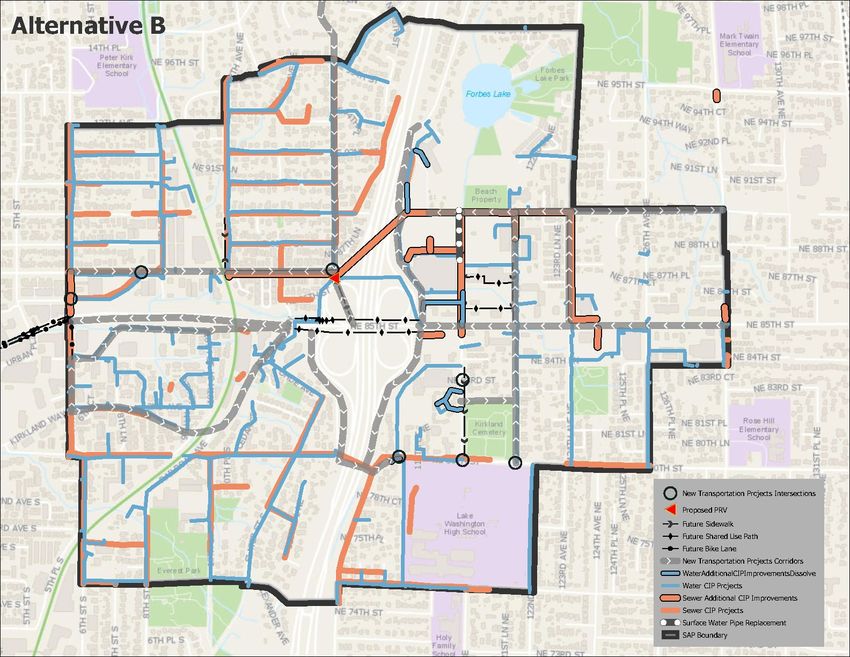
Exhibit 3-2. June Alternative B – Representative Infrastructure Investments ................................................. 3-12
Exhibit 3-3. Level of Traffic Stress Concept ........................................................................................................ 3-13
Exhibit 3-4. Alt A Bike Level of Stress Network.................................................................................................. 3-15
Exhibit 3-5. Alt B Bike Level of Stress Network .................................................................................................. 3-15
Exhibit 3-6. Alt A Potential Bikeshed from BRT Station ..................................................................................... 3-15
Exhibit 3-7. Alt B Potential Bikeshed from BRT Station ..................................................................................... 3-15
Exhibit 3-8. Impacted Transit Ridership ............................................................................................................... 3-16
Exhibit 4-1. Fiscal Projections for a Prototypical Washington City .................................................................. 4-2
Exhibit 4-2. Kirkland General Fund Forecast, 2021-2026 ................................................................................ 4-2
Exhibit 4-3. Fiscal Model Structure ......................................................................................................................... 4-3
Exhibit 4-4. Land Development and Tax Revenue Generation ......................................................................... 4-4
Exhibit 4-5. Park LOS Guideline and Estimated Facility/Acre Costs, 2021$............................................... 4-14
Exhibit 4-6. Alternative A General Operating Revenues, YOE$ .................................................................... 4-15
Exhibit 4-7. Alternative B General Operating Revenues, YOE$..................................................................... 4-16
Exhibit 4-8. Alternative A General Operating Costs by Departmental Category, YOE$ ......................... 4-17
Exhibit 4-9. Alternative B General Operating Costs by Departmental Category, YOE$ ......................... 4-17
Exhibit 4-10. Alternative A & B General Operating Revenues and Costs - Cumulative, YOE$ ............... 4-18
Exhibit 4-11. Capital Revenues from Alternative A, YOE$ .............................................................................. 4-19
Exhibit 4-12. Capital Revenues from Alternative B, YOE$ .............................................................................. 4-20
City of Kirkland NE 85TH SAP Supplemental Study
Exhibit 4-13. Alternative A Capital Costs by Department, YOE$ .................................................................. 4-20
Exhibit 4-14. Alternative B Capital Costs by Department, YOE$................................................................... 4-21
Exhibit 4-15. Alternative A & B Capital Surplus/Deficit Summary – Cumulative, YOE$ ........................... 4-22
Exhibit 4-16. Alternative A & B Capital Surplus/Deficit by Improvement Type – Cumulative, YOE$ .... 4-22
Exhibit 4-17. Alternative B Fire Fleet Capital Surplus/Deficit – City Portion, YOE$ .................................. 4-23
Exhibit 4-18. Alternative A & B Fire Fleet Cumulative Capital Surplus/Deficit, YOE$............................... 4-24
Exhibit 4-19. Alternative B Police and Municipal Capital Surplus/Deficit – City Portion, YOE$.............. 4-24
Exhibit 4-20. Alternative A & B Police and Municipal Cumulative Capital Surplus/Deficit, YOE$ .......... 4-25
Exhibit 4-21. Alternative B Transportation Capital Surplus/Deficit – City Portion, YOE$ ......................... 4-26
Exhibit 4-22. Alternative A & B Transportation Cumulative Capital Surplus/Deficit, YOE$ ..................... 4-26
Exhibit 4-23. Alternative B Water Capital Surplus/Deficit – City Portion, YOE$ ....................................... 4-27
Exhibit 4-24. Alternative A & B Water Cumulative Capital Surplus/Deficit, YOE$ ................................... 4-27
Exhibit 4-25. Alternative B Sewer Capital Surplus/Deficit – City Portion, YOE$........................................ 4-28
Exhibit 4-26. Alternative A & B Sewer Cumulative Capital Surplus/Deficit, YOE$ .................................... 4-28
Exhibit 4-27. Stormwater Capital Surplus/Deficit – City Portion, YOE$ ...................................................... 4-29
Exhibit 4-28. Alternative A & B Stormwater Cumulative Capital Surplus/Deficit, YOE$........................... 4-29
Exhibit 4-29. Alternative B Parks Capital Surplus/Deficit – City Portion, YOE$ ......................................... 4-30
Exhibit 4-30. Alternative A & B Parks Cumulative Capital Surplus/Deficit, YOE$...................................... 4-30
Exhibit 4-31. Alternative A and B Total Surplus/Deficit – Cumulative, YOE$.............................................. 4-31
Exhibit 4-32. East Quadrants Share of Operating Revenues for Alternative B ........................................... 4-32
Exhibit 4-33. Alternative B Infrastructure Costs, West vs. East Quadrants of Study Area, YOE$ ............ 4-33
Exhibit 4-34. Commercial Portion of East Quadrants Share of Operating Revenues................................. 4-34
Exhibit 4-35. Operating Cost Comparison, Commercial vs. Residential ........................................................ 4-35
Exhibit 5-1. Residual Land Value ............................................................................................................................ 5-3
Exhibit 5-2. Residual Land Value ............................................................................................................................ 5-4
Exhibit 5-3. Comparison of Residual Land Value to Land Value ...................................................................... 5-5
Exhibit 5-4. Summary of Residual Land Value ..................................................................................................... 5-6
Exhibit 5-5. Residual Land Value Sensitivity to Parking ..................................................................................... 5-7
Exhibit 5-6. Potential Structure of Base Requirements and Bonus Incentives. ............................................... 5-13

          City of Kirkland NE 85TH SAP Supplemental Study
Executive Summary
The project vision for the NE 85th Street Station Area Plan describes a thriving walkable urban center with
plentiful affordable housing, jobs, sustainable development, and shops and restaurants linked by transit calls
for significant population and employment growth. Additional residential and employment options are a
substantial community benefit by itself, contributing to City of Kirkland goals for a more inclusive community
with housing options and job creation in the Greater Downtown and near transit hubs. To be careful stewards
of public resources, City Council has asked if Kirkland can afford the investments necessary to address
increased demand on public services, especially schools, parks and open spaces, transportation, and utilities,
and avoid a reduction in service for existing residents and businesses.
The short answer is yes, so long as the City employs a variety of strategies to balance the City’s overall
budget and needs generated by Station Area growth. In fact, much like the rest of Kirkland and many
suburban communities, the City will face significant capital investments and demands for services if the area
continues to develop under current trends. By embracing the vision of concentrated transit-growth in the
Station Area, the City will be able to serve concentrated growth more efficiently and access more tools for
investment in public infrastructure and City operations.

Station Area Plan Background
In 2019, the City commissioned the NE 85th Street Station Area Plan to evaluate how to leverage the
regional transit investment of Washington State Department of Transportation (WSDOT) and Sound
Transit in the planned Inline Bus Rapid Transit (BRT) / Interchange project. The Station Area is a unique
location on the eastside and in Kirkland. The new WSDOT / Sound Transit Bus Rapid Transit station at I-
405 and NE 85th will connect Kirkland regionally to light rail at Bellevue, Lynnwood, and to SeaTac with
frequent bus service every 10-15 minutes. The Opportunities and Challenges Analysis found that the
Station Area is significantly underutilized today – with 45% of the area used for surface parking – and
has good potential for residential development and a strong location advantage for office development
and new jobs.
The project Vision for the Station Area Plan is a thriving walkable urban center with plentiful affordable
housing, jobs, sustainable development, and shops and restaurants linked by transit. Compact, transit-
oriented growth around the new regional BRT and trail connections are a chance to grow smart, increase
access to opportunity, promote the vision in the Comprehensive Plan and Sustainability Master Plan, and
benefit the Station Area and Kirkland as a whole. The City’s Objective is to leverage the BRT station
regional transit investment and to maximize transit-oriented development and create the most:
   Opportunity and Inclusion,
   Value for the City,
   Community Benefits, including affordable housing, and
   Quality of life.
In fall and winter of 2020, three draft Alternatives were developed for the Draft Supplemental
Environmental Impact Statement (DSEIS) for the project. The DSEIS Alternatives studied were based on
input from the public, Planning Commission, and City Council, to guide growth around the new bus rapid
transit station over the next 20+ years: Alternative 1 – No Action, Alternative 2 – Guiding Transit-

      City of Kirkland NE 85TH SAP Supplemental Study | Executive Summary                                        i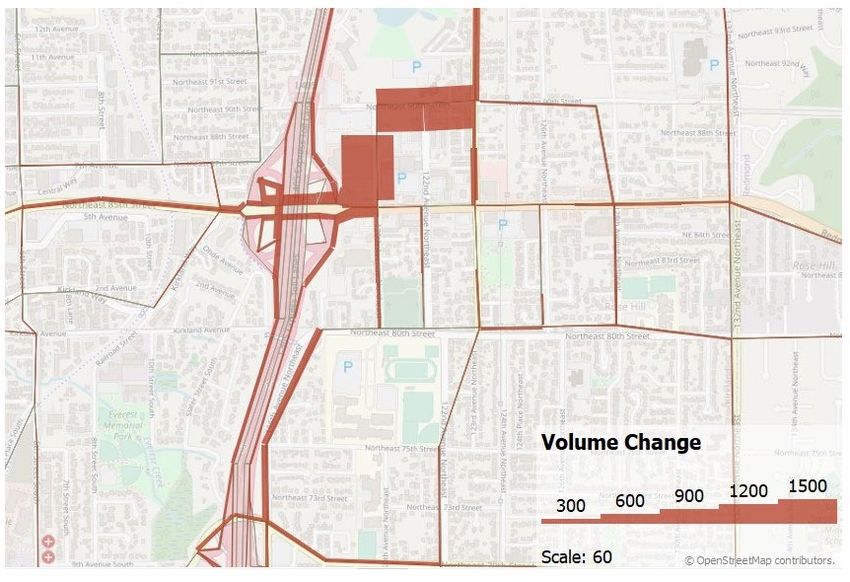
Oriented Growth, and Alternative 3 – Transit-Oriented Hub. Alternative 2, Guiding Transit-Oriented
Growth, had the most favorable response and alignment with objectives. Mobility, infrastructure, and
inclusion are some of the greatest opportunities and challenges of the Station Area Plan.
The City Council wanted to consider the Draft Alternatives further, and after project scope reassessment,
directed a supplemental study. That supplemental study was designed to respond to community and City
Council concerns and included a Fiscal Impacts and Community Benefits Study and supplemental
transportation analysis items. The supplemental work began in May 2021 to understand the practical
implications of options being considered. The results will help shape a preferred direction for the Station
Area Plan.
Fiscal Impacts and Community Benefits Study
Today, housing in Kirkland is 50% more expensive than the average of King County and 89% of the jobs
in the City are held by people living outside Kirkland. These dynamics are prevalent in the Station Area
and result in long commute times and reduced quality of life. Community risk is increased by congested
traffic conditions combined with lack of attainable housing that impede the ability of essential workers to
get to their jobs in case of emergencies and is increased by contributing to poor air quality that can
exacerbate health conditions and crises like COVID-19. If development in line with the current zoning in
the Station Area Plan occurs, it will not generate enough revenue to pay for the infrastructure and City
services necessary to serve the growth. Similarly, the infrastructure and service improvements in Kirkland’s
master plans are not fully funded.
The Fiscal Impacts analysis tested if the City could support infrastructure and service needs for future
potential growth scenarios, and the Community Benefits analysis looked to maximize affordable housing
and access to opportunity, as well as identify tools to help provide needed infrastructure to serve growth.
The Study resulted in a recommended Infrastructure Investment Framework and a Community Benefits
Policy Framework.
The Public Infrastructure and Services Investment Framework recommends how value for the City can be
achieved by sustainable service provision and with fiscal responsibility; as well as how quality of life can
be achieved with mobility for all ages and abilities, and access to parks. The Community Benefits Policy
Framework recommends how the City can expand opportunity and inclusion with affordable housing and
workforce development and by supporting schools and open space; and community benefits realized by
greater sustainability, community resilience and health outcomes.
The numbered summary items below correspond to the sections of the full report which follows.
Section 2.0 Growth Analysis: June Alternatives for Study describes how the DSEIS Alternatives were
narrowed for purpose of this study, including buildout estimates for next 23 years, and rebalancing the
mix and level of growth to better manage transportation impacts. These two Alternatives were based on
public, Planning Commission, and Council feedback, and were developed to be compared:
June Alternative A: Current Trends is based on the starting point of DSEIS Alternative 1: No Action.
A ‘No Action’ Alternative showing growth in line with Kirkland’s Comprehensive Plan is a requirement
of the DSEIS process. For June Alternative A: Current Trends, the growth targets were adjusted
upward because growth in the past six years has outpaced the assumptions made in the 2015
Comprehensive Plan. June Alternative A: Current Trends maintains existing zoning heights throughout
the district and slightly adjusts the assumed 2044 growth projections to reflect current market trends,
showing more jobs, and only slightly more housing than DSEIS Alternative 1.
City of Kirkland NE 85TH SAP Supplemental Study | Executive Summary ii
June Alternative B: Transit Connected Growth is aligned with the overall Station Area Plan growth
framework in the Initial Concepts and used DSEIS Alternative 2 as a base while incorporating select
elements shown in the commercial corridors of DSEIS Alternative 3. June Alternative B only studies
increased allowable heights in areas that provide clear benefits to the community and take
advantage of regional transit connections. To that end, several areas where height increases had
been proposed as part of DSEIS Alternative 2 and 3 were removed from consideration, including
areas that are unlikely to redevelop due to market forces, are limited by development feasibility, or
are constrained by other considerations. Alternative B: Transit Connected Growth results in similar
household growth numbers as DSEIS Alternative 2, but lower employment numbers than DSEIS
Alternative 3, showing more of a jobs-housing balance. The Southwest Quadrant of the Study Area
has lower growth numbers, closer to what was proposed for DSEIS Alternative 1.
The table below summarizes the growth assumptions associated with the DSEIS and June Alternatives:
DSEIS June June DSEIS DSEIS
Alternative A Alternative B
No Action Alternative 2 Alternative 3
Households 2,782 2,929 8,152 8,509 10,909
Employment 10,859 12,317 22,751 28,688 34,988
Supplemental Transportation analysis was completed to support the narrowing of Alternatives and
better understand how the mix and level of growth could be adjusted to reduce the impacts modeled
in DSEIS Alternative 2. It also included sensitivity testing of any impacts to the I-405/NE 85th
interchange, and while the micromodel showed some delays on NE 85th, the increases did not
significantly affect the operations of the interchange or the freeway mainline.
Section 3.0 Infrastructure Investment summarizes how planning level studies were conducted to
determine a set of representative infrastructure investments needed to maintain service levels in
transportation, water and sewer, and stormwater given the employment and household growth assumed
for June Alternatives A and B. These studies were produced for development of conceptual cost estimates
for fiscal modeling of the Station Area and are not intended to show a preferred plan or final project
configurations, which will be developed in later stages of planning and are subject to City Council
approval.
Key findings from each infrastructure study include:
The City needs to make significant transportation improvements in either Alternative. In
Alternative B, the largest City-funded representative improvements are:
Kirkland Way Complete Streets (an improvement which requires rebuilding of the Cross Kirkland
Corridor (CKC) bridge and is also assumed under Alternative A).
124th Ave NE Roadway Widening to 5 Lanes, NE 85th St. to NE 90th St. (an improvement also
assumed under Alternative A).
90th St Complete Streets Improvements (two projects, both projects are also assumed under
Alternative A).
City of Kirkland NE 85TH SAP Supplemental Study | Executive Summary iii
NE 85th St. Shared Use Trail Improvements, 5th St. to Kirkland Way (an improvement that only
takes place in Alternative B).
Under either scenario outlined above, additional water and sewer system improvements will be
needed to meet expected growth in the Station Area beyond implementation of the City’s existing
Capital Improvement Programs (CIPs) as shown in the 2015 Water System Plan (WSP) and 2018
General Sewer Plan (GSP). Additional improvements will be needed in June Alternative B, above
and beyond those needed in June Alternative A, to meet projected growth given proposed zoning
changes in the Station Area. Additional water and sewer system improvements are identified in these
analyses as a representative list of projects that could serve the level of buildout described in June
Alternative B:
The water system would not be able to meet the rezoned fire flow requirements without
additional improvements.
The sewer system would not be able to meet the additional flows from the Station Area without
additional improvements.
After determining the potential flooding locations resulting from parcel improvements for basins in
the northeast and southeast quadrants of the Study Area for each developed scenario, stormwater
mitigation options were evaluated to determine their effectiveness at reducing runoff and
conveyance capacity issues along the stormwater main line.
For either Alternative, development of these portions of the Study Area and any associated
increases in impervious surface area will not have any negative downstream impacts due to
existing policies and mitigation requirements.
Under either Alternative, the only recommended stormwater project within these portions of the
Study Area consists of replacing 520 feet of pipe along 120th Ave NE with a smoother pipe
material.
Although not directly related to the Station Area, outside of the Study Area, the analysis showed
an increase in runoff from the upstream residential areas causing potential flooding, that is not
exacerbated by potential allowed development represented in either June Alternative A or B.
Section 4.0 Fiscal Impacts Analysis is designed to answer a key question: With population growth and
redevelopment in the Station Area Plan, comparing June Alternatives A and B, can the City afford the
investments necessary to address increased demand on public services, especially schools, parks/open spaces,
transportation, and utilities, and avoid a reduction in service for existing residents and businesses?
ECONorthwest developed a revenue model to project associated operating and capital revenues for the
City, as well as revenues for key City partners. Operating and capital revenues were calculated based
on the changes in the components of the City's tax base resulting from redevelopment in the Study Area.
BERK led development of the cost model and calculation of net fiscal impact by comparing City revenues
to expenses. Operating cost projections were developed in collaboration with City staff and are based
on estimated operational impacts to each of the City’s departments. Capital cost projections were
City of Kirkland NE 85TH SAP Supplemental Study | Executive Summary iv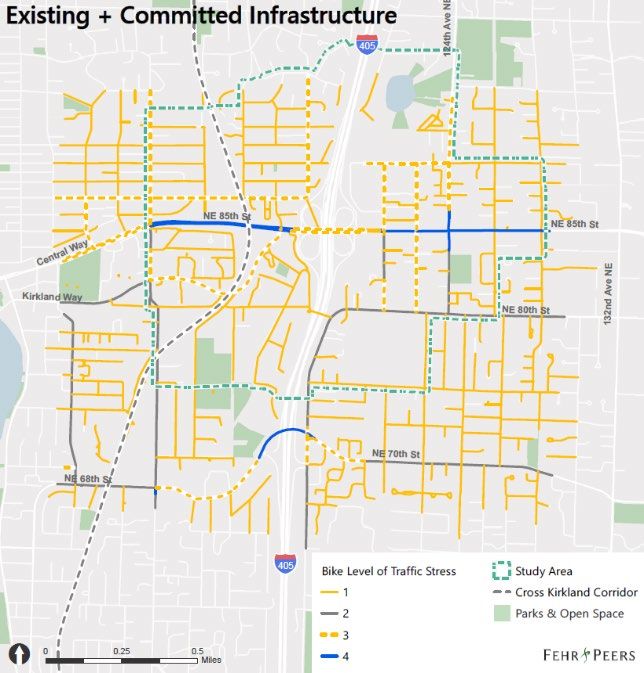
developed in collaboration with City staff as well as the consultants engaged by the City to conduct the
planning level studies noted above.
Operating Net Fiscal Impact. On both an annual and cumulative basis, general operating revenues are
projected to cover general operating costs under either Alternative during the study period. The table
below details cumulative general operating revenues and costs through 2044 for both Alternatives.
Alternative A & B General Operating Revenues and Costs - Cumulative, YOE$

 Type                                                                 Alt A             Alt B

General Operating Revenues                                           58.7M          $199.7M
General Operating Costs                                           -$31.9M          -$117.5M
Total General Operating Surplus/Deficit                            $26.8M            $82.2M

Sources: FCSG, 2020; ECONorthwest, 2021; City of Kirkland, 2021; BERK, 2021.

While operating costs are significantly higher in Alternative B to serve new growth in the Station Area,
revenues generated by potential future uses are also significantly higher. Under Alternative B, the City is
projected to generate a general operating surplus of around $82.2 million by 2044, around $55.4
million more than the general operating surplus generated in Alternative A.
Costs stemming from functions funded by permit-related revenue sources and utility operating revenue
sources are assumed to be covered by those revenue sources based on increased demand for services in
the Study Area and not included in the analysis above.
Capital Net Fiscal Impact. Under either Alternative, significant capital needs are anticipated, with the
City projected to see large shortfalls in covering capital needs unless other funding strategies are
implemented. The table below outlines the projected cumulative surplus/deficit for capital costs and
capital revenues through 2044 for both Alternatives. As a note, capital improvements needed in
Alternative A are also assumed to be needed in Alternative B as those improvements will be needed to
accommodate growth under either scenario.
Alternative A & B Capital Surplus/Deficit Summary – Cumulative, YOE$

 Type                                                            June Alt A            June Alt B

Dedicated Capital Revenues                                            $68.2M              $252.7M

Development-funded Improvements                                       $33.0M               $84.8M

Total Capital Improvements                                         -$265.2M              -$455.2M

Capital Surplus/Deficit                                            -$164.0M              -$117.7M

Note: Numbers may not add up due to rounding.

Sources: FCSG, 2020; City of Kirkland, 2021, Fehr & Peer’s, 2021; RH2, 2021; RKI, 2021; HBB, 2021; ECONorthwest, 2021;
        BERK, 2021.

        City of Kirkland NE 85TH SAP Supplemental Study | Executive Summary                                          v
While Alternative B is estimated to generate more in total capital improvements than Alternative A, under
Alternative B, significantly more dedicated capital revenues are also estimated to be generated, along
with more improvements assumed to be funded through development. Compared with Alternative A, this
results in a decrease in capital deficit of around $46.3 million (-$117.7 million in Alternative B versus -
$164.0 million in Alternative A).
As shown below, in Alternative A, significant shortfalls are projected for transportation, water, sewer, and
parks capital improvements. In Alternative B, significant shortfalls are projected for sewer and parks
capital improvements.
Alternative A & B Capital Surplus/Deficit by Improvement Type – Cumulative, YOE$
June Alt A June Alt B
Capital Improvement Type Capital Surplus/Deficit Capital Surplus/Deficit
Fire $1.1M $0.6M
Police Fleet and Municipal Facilities -$0.4M -$1.7M
Transportation -$73.4M $27.2M
Water -$5.3M $3.6M
Sewer -$70.7M -$53.5M
Stormwater -$0.5M -$0.3M
Parks -$14.8M -$93.5M
Total Capital Surplus/Deficit -$164.0M -$117.7M
Note: Surplus/Deficit does not include using general government operating surplus to cover gaps. Numbers may not add up due to
rounding.
Sources: FCSG, 2020; City of Kirkland, 2021, Fehr & Peer’s, 2021; RH2, 2021; RKI, 2021; HBB, 2021; ECONorthwest, 2021;
BERK, 2021.
For each type of capital improvement, the City has available strategies that could be pursued to cover
capital costs in Alternative.
Summary of Net Fiscal Impact. While it is important to note that restrictions on certain revenue sources
exist and, as a result, not all revenues can be applied to certain costs, for contextual purposes, it can be
helpful to understand where each Alternative ends up on a total surplus/deficit basis.
The table below details a comparison of both Alternatives on a total surplus/deficit basis. Major
takeaways include:
Under either Alternative, operating revenues are projected to cover operating needs by 2044
Under either Alternative, significant capital needs are anticipated, with the City projected to see
large shortfalls in covering capital needs unless other funding strategies are implemented
As mentioned, while restrictions on certain revenue sources exist, on a total surplus/deficit basis,
under Alternative B, the City’s deficit is significantly lower than what is projected under Alternative A.
City of Kirkland NE 85TH SAP Supplemental Study | Executive Summary viThe City is projected to have a total deficit of around $35.5 million in Alternative B and a total
deficit of around $137.2 million in Alternative A.
Alternative A and B Total Surplus/Deficit – Cumulative, YOE$
Surplus/Deficit Alt A Alt B
General Operating Surplus/Deficit $26.8M $82.2M
Capital Surplus/Deficit -$164.0M -$117.7M
Total Surplus/Deficit -$137.2M -$35.5M
Sources: FCSG, 2020; City of Kirkland, 2021, Fehr & Peer’s, 2021; RH2, 2021; RKI, 2021; HBB, 2021; ECONorthwest, 2021;
BERK, 2021.
Reasons for differences in the fiscal outlook between Alternatives include:
Generation of a higher operating surplus in Alternative B relative to Alternative A driven by
estimated increases in general operating revenues such as sales and property tax revenues
A smaller capital shortfall in Alternative B relative to Alternative A due to estimated increases in
dedicated capital revenues such as impact fees, REET, and capital facility charges as well as an
increase in capital improvements funded by development.
It is important to note that the City’s CIP looks at project funding for a six-year window and that future
projects are shown as unfunded until they are prioritized into the CIP window. Funding strategies will be
developed to address any funding gap that exists under current planning assumptions. The Station Area
plan could provide additional funding and community benefit tools to help address capital needs as
discussed in Section 6.0.
Section 5.0 Community Benefits Analysis aims to answer the following questions:
How can the public receive benefits of growth?
How can development increase affordable housing, open space, transit/bike/walk connections, and
sustainability?
This section studies priority benefits that were chosen based on community feedback, City Council and
Planning Commission direction, and initial findings from the DSEIS and 2020 Opportunities and
Challenges Report. They include schools, parks and public realm, affordable housing, sustainability, and
mobility.
Community Benefits Analysis: Potential Value Capture, described in Section 5.2, is based on a
Residual Land Value (RLV) study of the full build-out of allowed development. It studies whether and to
what degree the increased development entitlements considered in June Alternatives A and B create
potential for value capture to provide additional community benefits. The RLV estimates offer a snapshot
of value capture potential for the planned types of growth in the area based on typical development
costs, estimated rents for new development, and approximate values of existing property.
The Residual Land Value analysis determined there is greatest potential for value capture for commercial
development and increasing value potential in 10+ story development compared with 5-9 story
City of Kirkland NE 85TH SAP Supplemental Study | Executive Summary viidevelopment. The analysis also found that mid-rise residential is not feasible everywhere in the near
term, and additional affordability requirements or other value capture costs may delay development,
which could result in less housing production subject to the inclusionary requirements. If the City did want
to pursue increasing the existing Inclusionary Zoning requirements for affordable housing, it would be
important to monitor how the policy change influences production. For both residential and non-residential
development, reducing parking ratios is important for potential value capture. If ratios are not reduced,
the potential for value capture is much less. This preliminary analysis shows the most value capture
potential in Alternative B, with potential for tens of millions of dollars of additional value capture beyond
Alternative A, primarily from non-residential development.
A range of potential Community Benefits Strategies that are relevant to the project and achieving the
City’s priority benefits are included in Section 5.3 and described below.
TIF. Tax Increment Financing (TIF) is a common tool in other states that was recently authorized by
state legislation for the first time in Washington. TIF allows a jurisdiction to capture the future value
of public investments and catalyze growth, by designating a geographic area in which public
investment is needed and issuing bonds against a likely increase in assessed values catalyzed by
those investments. This tool is now available in Washington and is a good opportunity for the Station
Area. Improvements that are the best fit for a TIF are ones that are unlikely to happen through
typical CIP, critical to make desired development possible, and ideally can provide multiple benefits.
This analysis has identified multi-benefit projects, parks, public realm, and mobility as the community
benefits that would be the best candidates for a TIF. Based on the assumptions in this study, a
preliminary estimate of potential TIF revenues under HB 1189 suggests that TIF may be able to
support between $50 to $75 million (2021$ assuming 25 years of revenues discounted at 3.5%) in
debt for infrastructure projects.
Commercial Linkage Fees. Linkage fees “link” new development with the increased demand for
affordable housing. These fees are typically charged to developers based on a per square foot fee
established for specific uses like commercial or retail. Fees as set are based on a nexus study that
demonstrates the rationale and relationship between the development and the fee that is charged.
The RLV analysis indicates that a Commercial Linkage program for the Station Area has merit and
while there are many factors that would influence revenue potential, there may be potential to
generate in the range of $10-$50M should all the allowed development capacity for non-residential
growth represented in June Alternative B be built within the 23-year planning horizon. The potential
for value capture is highly dependent on reduced parking ratios as noted above. The City should
consider a workforce development component of a potential linkage program which would allocate
a portion of the fees collected toward workforce development programs to help to address the
jobs/housing imbalance. More analysis through a nexus study would be required to better evaluate
potential policies and establish a linkage program.
Density Bonus and Baseline Requirements. Density bonus programs, also known as incentive zoning
programs, allow additional development in exchange for the developer providing community
benefits. Under a typical density bonus program, new zoning establishes a base development
allowance in each zone. Certain zones are eligible for an additional increase in development up to a
maximum development amount. In exchange for this additional development, the developer provides
public benefits through fee-in-lieu or direct provision of the amenity. Based on the current
City of Kirkland NE 85TH SAP Supplemental Study | Executive Summary viiiunderstanding of the City’s priorities and objectives, a menu or points-based system is recommended
for its ability to accomplish several goals through a single program and provide flexibility for
developers to incent participation. Section 5.3.3 provides a potential structure of base requirements
and bonus incentives for consideration. A part of this consideration should include potential
modifications to existing policies as baseline standards are established.
Partnership opportunities can advance priority community benefits through program alignment or
potential co-benefits. Possible topics that should be explored include Shared Use of community
facilities and public open space, integrated early education and childcare facilities, workforce
development and green infrastructure programs, as well as sustainability, climate action, and health
and well-being initiatives.
Section 6.0 Summary of Findings and Recommendations notes that the City must make significant
capital investment under June Alternative A if the area develops under current trends. This Alternative
does not generate much development contribution to required infrastructure. June Alternative B: Transit-
Connected Growth, however, creates an opportunity for the City to efficiently serve concentrated growth
and more tools to make investments in public infrastructure and City operations.
To manage Alternative B successfully, the City will have to recognize that a variety of strategies will be
required to balance the City’s overall budget and Station Area needs.
Based on the results of this analysis, which were all conducted based on existing City policies, the
following recommendations are proposed as a framework for realizing fiscally sustainable infrastructure
and services provision and the desired community benefits in the Study Area. These include a combination
of existing policies and new policy changes that the City should consider as part of developing a
preferred Plan Direction for the Station Area.
Potential Infrastructure-specific Financing and Community Benefit Strategies for June Alternative B.
Public Infrastructure and Services
Stormwater. The City can use stormwater capital fund reserves to fill the $700,000 gap
between the available stormwater facility charges and the infrastructure improvement cost in
2035.
Water. The City can issue a $10 million 20-year bond to cover the cost of the improvement and
maintain an annual surplus. A bond of that amount and length is anticipated to result in annual
debt payments of $685,000. Projected capital facility charge revenue and 7% of net new
water utility revenue from growth in the Station Area are projected to be enough to cover the
annual debt payments.
Sewer. The City can fund sewer improvements with a combination of debt issuance and rate
increases. Issuing a $60 million 30-year bond in 2035, resulting in $3.1 million annual debt
payments, would cover the cost of needed sewer infrastructure improvements. To make annual
debt payments, a rate increase on the overall base would be required, because there is not
enough sewer capital facility charges or new sewer rate revenue from the Station Area to cover
the payments. Because this investment is also required in Alternative A, where there are less
dedicated revenues available to offset costs resulting in a larger City deficit, Alternative A
requires a larger rate increase than Alternative B.
City of Kirkland NE 85TH SAP Supplemental Study | Executive Summary ix Community Facilities and Benefits
Parks. A mix of strategies will be needed to address parks capital needs, those to consider
include:
Partially offsetting deficit with a portion of the the $80.0 million remaining in general
government operating surplus. This strategy alone will not address parks capital needs.
Alternative non-acreage derived LOS guidelines more appropriate for urban centers, such
as shifting the standards to geographic equity of park access within walking distance and
inclusion of school facilities and non-City parks.
Leveraging public assets and partnerships.
Identifying Community Park options.
Leveraging development requirements and development bonuses which show potential to
provide publicly accessible smaller scale open spaces and trail connections including in-
building or rooftop urban park amenities.
Affordable housing. A commercial linkage program is the primary new strategy recommended
to maximize affordable housing objectives, which would go beyond the City’s existing
Inclusionary Zoning requirements for residential development. The Residual Land Value analysis
determined that a Commercial Linkage Program has merit, with greatest potential for value
capture for commercial development, and increasing value potential in 10+ story development
compared with 5-9 story development. Mid-rise residential is not feasible everywhere in the
near term, and additional affordability requirements or other value capture costs may delay
development, which could result in less housing production subject to the inclusionary
requirements. If the City did want to pursue increasing the existing Inclusionary Zoning
requirements for affordable housing, it would be important to monitor how the policy change
influences production. Supporting workforce development programs may help to address the
current jobs/housing imbalance within the Station Area.
Mobility. Identify and prioritize multi-benefit project opportunities and consider them as part of
a TIF strategy, especially right-of-way projects where mobility and infrastructure needs overlap.
The City should consider the following baseline or incentive-based changes within the Station
Area as described in the Transportation Supplemental Study, Appendix 1: parking ratio
reductions, unbundled and paid parking, requirements for large employers or multi-family
properties to provide transit pass subsidies, managed parking strategies, Transportation
Network Company (TNC) ridesharing programs, bikeshare or micro mobility programs, and
shared off-street parking.
Sustainability. Baseline requirements and density bonuses are the recommended strategies to
achieve sustainability features and performance within the Station Area. The City should
consider how these goals would fit into a menu-approach and which levels of performance or
features are desirable as baseline requirements or as density bonus incentives, and any needed
policy adjustments to support this. They should also explore the potential for partnerships around
sustainability, climate action, health and well-being initiatives.
City of Kirkland NE 85TH SAP Supplemental Study | Executive Summary x Schools. Under either Alternative, the City will need to help the Lake Washington School District
solve for additional school population. Initial estimates are that school capacity will need to
increase by 153 students under Alternative A and 936 students under Alternative B. In addition,
the community as well as Lake Washington School District have articulated an existing and
growing need for childcare and early learning and education facilities. Although the fiscal
impact analysis did not estimate costs for Lake Washington School District, as they are a
separate governmental entity from the City, the analysis did estimate anticipated revenues from
school impact fees. It is estimated that there will be $24.6 million in school impact fee revenue
available for school capital needs in Alternative B. ECONorthwest estimated that if the LWSD
Capital Levy currently scheduled to expire in 2022 were to be extended throughout the life of
this study period it could raise as much as $53.9 million in the Station Area. Potential community
benefit strategies include:
In land-constrained locations like the Study Area, consider requirements or development
bonuses for developments to provide space on-site. This can include educational and
childcare space integrated into the development (most common for early learning, pre-K
and specialized programs like STEM) or by setting aside land for future school
development.
Consider policy changes to define active frontages or required retail space to include
educational, childcare, and community-serving spaces in order to implement a Development
Bonus strategy.
Explore partnership opportunities to align programs, such as Joint/Shared Use Agreements
that broaden access to community-serving facilities.
Consider increasing allowed development capacity on existing underutilized public parcels
to support future development of new school space.
Recommended Next Steps
A Public Infrastructure and Services Investment Framework will be critical to catalyze transit-
connected development and can help support coordination and implementation of various strategies.
Identify baseline requirements for project-level infrastructure and contributions to the Station
Area. Potential for value capture will be related to some policy changes, including reduced
parking ratios and unbundling, modifying parks LOS methodologies to move toward geographic
equity and inclusion of shared use facilities. Next step: Coordinate a comprehensive scan of
existing and potential policy changes together with a Density Bonus Program. Base development
standards should be calibrated so that all development is held to an acceptable minimum
standard of public benefit provision through other strategies like mandatory impact fees and
design standards.
Use a TIF District to finance large, area-wide investments like streetscape improvements, major
park, and potentially support additional school capacity and other infrastructure needs. Next
steps: Conduct a TIF analysis, testing scenarios for TIF boundaries and projected revenues over
time including development feasibility, identify target improvements. A Phase 1. TIF Strategy
that looks at the TIF area, potential revenue, and eligible projects would cost about $20k and
City of Kirkland NE 85TH SAP Supplemental Study | Executive Summary xitake about three months. This should be paired project feasibility and conceptual study could
range from $40-70k depending on the number and extent of candidate projects. A Phase 2. TIF
Implementation Study would create the district itself, and cost about $40k over six to nine
months. This will rely on supporting 30% design/engineering of TIF projects, and the costs and
timeframe for this work is highly dependent on which projects are selected.
A Community Benefits Policy Framework can then support community benefits provisions through
coordination and implementation of various strategies.
Establish and confirm baseline requirements for affordable housing by maintaining existing
inclusionary zoning, and consider sustainability measures, active frontages, and public realm
improvements. Base development standards should be calibrated so that all development is held
to an acceptable minimum standard of public benefit provision through other strategies like
mandatory impact fees and design standards.
Identify partnership opportunities to advance priority community benefits through program
alignment or potential co-benefits. Next steps: The project team could create a partnership
opportunities inventory and the City could use this as a base to conduct outreach to potential
stakeholders on topics including the possibilities of Shared Use of community facilities and open
space, integrated early education facilities, workforce development and green infrastructure
programs. This work could be documented in the Final Station Area Plan.
Develop a Density Bonus Program that can capture the value of more density for the
community, particularly considering smaller publicly accessible open spaces, on-site educational
and community facilities, advanced Transportation Demand Management (TDM) /Mobility
measures, and additional sustainability measures. Next steps: Conduct a comprehensive scan of
existing and potential policies together to establish base/bonus development allowances for
zoning and develop a points-based system of benefits. Bonus allowances should be calibrated
so they create a sufficient incentive to attract participation from developers. Coordinate with
Lake Washington School District regarding a potential incentive program for development to
provide integrated educational spaces within projects. Defining base and bonus entitlements
could occur within the Form Based Code development during later stages of planning. Either the
City or a consultant could complete supplemental work to develop the points-based system that
would implement these standards. For a consultant, it may cost about $50k and could take
about three months.
Implement a mandatory Commercial Linkage Fee to address affordable housing and workforce
development, leaving room for the density bonus system. This should work in partnership with
other affordable housing strategies like the City’s existing inclusionary zoning policies and state
MFTE program. Next step: Complete a nexus study to determine fees and consider workforce
development allocation. A nexus study would cost $50-60k and would take from six to nine
months, depending on how the City wants to engage with key stakeholders.
City of Kirkland NE 85TH SAP Supplemental Study | Executive Summary xii1.0 Introduction
1.1 Project Context and Focus of this Supplemental Study
The Northeast 85th St Station Area Plan (SAP) was commissioned to develop a long-term vision and plan
to guide development and investment in the Study Area surrounding a future BRT Station at NE 85th St
and I-405.
The City’s vision for the Station Area is a thriving, new walkable urban center with plentiful affordable
housing, jobs, sustainable development, and shops and restaurants linked by transit. Objectives of the 85th
Station Area Plan include:
Leverage the WSDOT/Sound Transit I-405 and NE 85th St Interchange and Inline Stride BRT station
regional investment.
Maximize transit-oriented development and create the most:
Opportunity for an inclusive, diverse, and welcoming community.
Value for the City of Kirkland.
Community Benefits including affordable housing and employment.
Quality of life for people who live, work, and visit Kirkland.
The SAP project has completed the Vision and Concepts planning phases as well as developing
Alternatives up to the Draft Supplemental Environmental Impact Statement (DSEIS) stage. Prior to
confirming a Preferred Direction in early 2021, the City Council and Planning Commission requested
supplemental information beyond the DSEIS impact analysis to understand the potential community
benefits, tradeoffs, and fiscal impacts of different Alternatives. This Supplemental Study is designed to
help Council understand the practical implications of the options that are being considered – both the
fiscal impacts to the City, and the likely community benefits that could result from new development over
the next 23 years as a result of planning changes.
This Supplemental Study is intended to inform the Preferred Plan Direction decision that will become the
basis for the Station Area plan, form-based code, and planned action ordinance. This remaining SAP
scope, including the Draft and Final Plan, will resume after the Supplemental Study is complete. It is a
long-range, planning level study and is not intended to plan for or represent specific, project-level
configurations. As this is intended to support an area plan, differences between the assumptions of this
long-range study and more near-term individual development and project decisions are expected.
1.2 Structure of this Document
This Supplemental Study is structured as described below and designed to answer the following key
questions:
Section 2.0 Growth Analysis: June Alternatives for Study describes the major assumptions
underlying this analysis, including planning assumptions and infrastructure investment assumptions.
City of Kirkland NE 85TH SAP Supplemental Study | Introduction 1-1 If the City were to implement its vision of the Station Area, how many jobs and housing units would
be created?
Section 3.0 Infrastructure Investment answers the question:
What infrastructure investments would be necessary to support this growth?
Section 4.0 Fiscal Impacts Analysis presents the projected fiscal impacts of June Alternatives A and
B and addresses the impact to City finances:
Can the City afford the investments necessary to address increased demand on public services,
especially schools, parks/open spaces, transportation, and utilities, and avoid a reduction in service
for existing community members and businesses?
Section 5.0 Community Benefits Analysis describes the potential for community benefits:
How can the public receive benefits of growth?
How can development increase affordable housing, open space, transit/bike/walk connections, and
sustainability?
Section 6.0 Summary of Findings and concludes this Supplemental Study by summarizing
recommendations.
Note: Figures in this document are presented in year of expenditure dollars (YOE$) – meaning that
revenues and costs are adjusted for inflation from present time (2021) to the expected year of collection
or expenditure, respectively - unless otherwise noted.
City of Kirkland NE 85TH SAP Supplemental Study | Introduction 1-22.0 Growth Analysis: June Alternatives for Study
As the basis of this Supplemental Study, two “June Alternatives” were established based on public
comment and community feedback, as well as guidance from the City Council and Planning Commission.
These June Alternatives narrow the range of Alternatives studied in the DSEIS by removing DSEIS
Alternative 3 from further consideration and adjusting DSEIS Alternatives 1 and 2 for study. These
adjusted Alternatives are defined as June Alternative A and June Alternative B:
June Alternative A: Current Trends. June Alternative A: Current Trends (Illustrated in Exhibit 2-1) is
based on the starting point of DSEIS Alternative 1: No Action. A ‘No Action’ Alternative showing
growth in line with Kirkland’s Comprehensive Plan is a requirement of the State Environmental Policy
Act (SEPA) process. For June Alternative A: Current Trends, the growth targets were adjusted upward
from DSEIS Alternative 1 because growth in the past six years has outpaced the assumptions in the
2015 Comprehensive Plan.
June Alternative A: Current Trends maintains existing zoning heights throughout the district and
slightly adjusts the assumed 2044 growth projections to reflect current market trends, showing more
jobs, and only slightly more housing than DSEIS Alternative 1. In June Alternative A: Current Trends,
these additional jobs were studied in portions of the Study Area currently zoned for development up
to 67’ in height in zones RH-1A, RH-2A, and RH-2B. Areas within the district currently zoned for
single family or other low density residential area maintained their current zoning.
June Alternative B: Transit Connected Growth. June Alternative B: Transit Connected Growth
(Illustrated in Exhibit 2-2) is aligned with the overall Station Area Plan growth framework in the
Station Area Initial Concepts (Exhibit 2-3) and incorporates elements shown in the commercial
corridors of DSEIS Alternative 3 into the overall land use pattern established in DSEIS Alternative 2.
The intent of this strategy is to:
Optimize for workforce and affordable housing, in particular the number of units provided
through linkage fees and/or inclusionary zoning.
Attract new jobs to foster economic activity and meet citywide targets.
Balance the distribution of commercial-focused development across the Study Area.
Foster an environmentally sound land use pattern that helps achieve the City’s sustainability
goals.
June Alternative B: Transit Connected Growth responds to the public comment heard during the DSEIS
comment period and the May 26, 2021 Council Listening Session. Although a wide range of
comments were shared, many participants reiterated a desire to maintain existing residential
character, and concerns regarding the maximum allowable zoning heights proposed in DSEIS
Alternative 3.
June Alternative B: Transit Connected Growth only studies increased allowable heights in areas that
provide clear benefits to the community and take advantage of regional transit connections. To that
2-1You can also read