2022 Community Health Needs Assessment - 2175 Rosaline Avenue Redding CA 96001 Conducted on behalf of
←
→
Page content transcription
If your browser does not render page correctly, please read the page content below

2022 Community Health Needs Assessment

                        Conducted on behalf of

                      2175 Rosaline Avenue
                        Redding CA 96001

                            Conducted by

Adopted by the Dignity Health North State community board in April 2022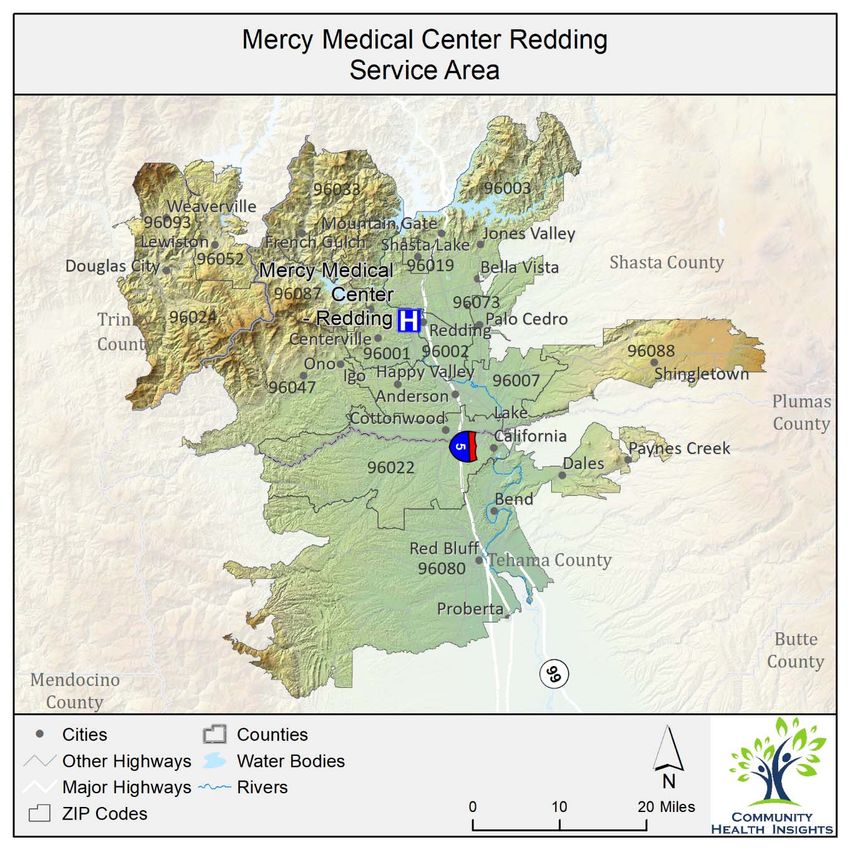
Acknowledgments
We are deeply grateful to all those who contributed to the community health needs assessment
conducted on behalf of Mercy Medical Center Redding. Many dedicated community health experts and
members of various social service organizations serving the most vulnerable members of the community
gave their time and expertise as key informants to help guide and inform the findings of the assessment.
Many community residents also participated and volunteered their time to tell us what it is like to live in
the community and shared the challenges they face trying to achieve better health. To everyone who
supported this important work, we extend our heartfelt gratitude.

Community Health Insights (www.communityhealthinsights.com) conducted the assessment on behalf
of Mercy Medical Center Redding. Community Health Insights is a Sacramento‐based research‐oriented
consulting firm dedicated to improving the health and well‐being of communities across Central and
Northern California. This joint report was authored by:

  •     Dale Ainsworth, PhD, MSOD, Managing Partner of Community Health Insights and Associate
        Professor of Public Health at California State University, Sacramento
  •     Heather Diaz, DrPH, MPH, Managing Partner of Community Health Insights and Professor of
        Public Health at California State University, Sacramento
  •     Mathew Schmidtlein, PhD, MS, Managing Partner of Community Health Insights and Professor
        of Geography at California State University, Sacramento
  •     Traci Van, Senior Community Impact Specialist of Community Health Insights

This community health needs assessment report was adopted by the Dignity Health North State in April
2022. The report is widely available to the public on the hospital’s web site
(https://www.dignityhealth.org/north‐state/locations/mercy‐redding/about‐us/community‐benefit, as
of April 2022), and a paper copy is available for inspection upon request at the hospital’s community
health office. Written comments on this report can be submitted to Mercy Medical Center Redding,
Attn: Community Health, 2175 Rosaline Avenue, Redding, CA 96001.

                                                                                                         2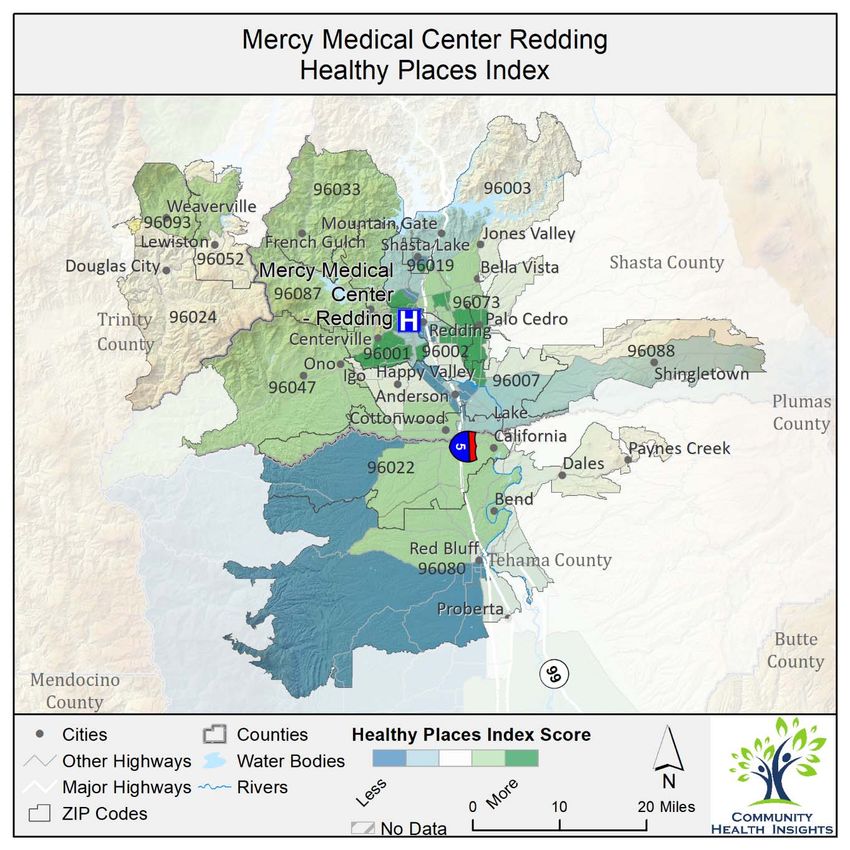
Table of Contents
Report Summary ........................................................................................................................................... 6
   Purpose ..................................................................................................................................................... 6
   Community Definition .............................................................................................................................. 6
   Assessment Process and Methods ........................................................................................................... 6
   Process and Criteria to Identify and Prioritize Significant Health Needs ................................................. 7
   List of Prioritized Significant Health Needs .............................................................................................. 7
   Resources Potentially Available to Meet the Significant Health Needs ................................................... 7
   Conclusion ................................................................................................................................................ 7
Introduction and Purpose ............................................................................................................................. 8
Findings ......................................................................................................................................................... 8
   Prioritized Significant Health Needs ......................................................................................................... 8
Methods Overview...................................................................................................................................... 19
   Conceptual and Process Models ............................................................................................................ 19
   Public Comments from Previously Conducted CHNAs ........................................................................... 19
   Data Used in the CHNA ........................................................................................................................... 19
   Data Analysis .......................................................................................................................................... 20
Description of Community Served .............................................................................................................. 20
Health Equity ............................................................................................................................................... 22
   Health Outcomes ‐ The Results of Inequity ............................................................................................ 23
   Health Factors ‐ Inequities in the Service Area ...................................................................................... 24
   Population Groups Experiencing Disparities .......................................................................................... 26
California Healthy Places Index ................................................................................................................... 26
Communities of Concern ............................................................................................................................ 28
The Impact of COVID‐19 on Health Needs.................................................................................................. 29
Resources Potentially Available to Meet the Significant Health Needs ..................................................... 31
Impact and Evaluation of Actions Taken by Hospital.................................................................................. 31
Conclusion ................................................................................................................................................... 32
2022 CHNA Technical Section ..................................................................................................................... 33
   Results of Data Analysis .......................................................................................................................... 33
      Compiled Secondary Data .................................................................................................................. 33
      Length of Life ...................................................................................................................................... 33
      Quality of Life ..................................................................................................................................... 35
      Health Behavior .................................................................................................................................. 38
      Clinical Care ........................................................................................................................................ 39
      Socio‐Economic and Demographic Factors ........................................................................................ 40
      Physical Environment ......................................................................................................................... 43
   CHNA Methods and Processes ............................................................................................................... 44
      Primary Data Collection and Processing ............................................................................................ 48
      Community Service Provider Survey .................................................................................................. 52
      Secondary Data Collection and Processing ........................................................................................ 53
   Detailed Analytical Methodology ........................................................................................................... 67
      Community of Concern Identification ................................................................................................ 68
      Significant Health Need Identification ............................................................................................... 69
      Health Need Prioritization .................................................................................................................. 83
   Detailed List of Resources to Address Health Needs ............................................................................. 84
Limits and Information Gaps....................................................................................................................... 89

                                                                                                                                                                  3
Appendix A – Impact of Actions Taken ....................................................................................................... 90

                                                              List of Tables
Table 1: Health need prioritization inputs for MMCR service area. ............................................................. 9
Table 2: Population characteristics for each ZIP code located in the MMCR service area......................... 22
Table 3: Health outcomes comparing race and ethnicity in the MMCR service area. ............................... 23
Table 4: Health factors comparing race and ethnicity in the MMCR service area. .................................... 24
Table 5: Identified Communities of Concern for the MMCR service area. ................................................. 28
Table 6: COVID‐19‐related rates for the MMCR service area. .................................................................... 30
Table 7: The impacts of COVID‐19 on health need as identified in primary data sources. ........................ 30
Table 8: Resources potentially available to meet significant health needs in priority order. .................... 31
Table 9: County length of life indicators compared to state benchmarks. ................................................ 33
Table 10: County quality of life indicators compared to state benchmarks. .............................................. 35
Table 11: County health behavior indicators compared to state benchmarks. ......................................... 38
Table 12: County clinical care indicators compared to state benchmarks. ................................................ 39
Table 13: County socio‐economic and demographic factors indicators compared to state benchmarks. 40
Table 14: County physical environment indicators compared to state benchmarks. ................................ 43
Table 15: Key Informant List ....................................................................................................................... 49
Table 16: Focus Group List .......................................................................................................................... 51
Table 17: Mortality indicators used in Community of Concern Identification ........................................... 54
Table 18: Health factor and health outcome indicators used in health need identification. ..................... 56
Table 19: Sources and time periods for indicators obtained from County Health Rankings...................... 60
Table 20: 2022 Potential Health Needs. ..................................................................................................... 70
Table 21: Primary themes and secondary indicators associated with PHN1.............................................. 71
Table 22: Primary themes and secondary indicators associated with PHN2.............................................. 72
Table 23: Primary themes and secondary indicators associated with PHN3.............................................. 73
Table 24: Primary themes and secondary indicators associated with PHN4.............................................. 74
Table 25: Primary themes and secondary indicators associated with PHN5.............................................. 74
Table 26: Primary themes and secondary indicators associated with PHN6.............................................. 75
Table 27: Primary themes and secondary indicators associated with PHN7.............................................. 75
Table 28: Primary themes and secondary indicators associated with PHN8.............................................. 76
Table 29: Primary themes and secondary indicators associated with PHN9.............................................. 77
Table 30: Primary themes and secondary indicators associated with PHN10............................................ 78
Table 31: Primary themes and secondary indicators associated with PHN11............................................ 79
Table 32: Primary themes and secondary indicators associated with PHN12............................................ 80
Table 33: Benchmark comparisons to show indicator performance. ......................................................... 81
Table 34: Resources available to meet health needs. ................................................................................ 84

                                                             List of Figures
Figure 1: Prioritized significant health needs for MMCR service area. ....................................................... 10
Figure 2: Community served by MMCR. ..................................................................................................... 21
Figure 3: Populations experiencing disparities the MMCR service area. ................................................... 26
Figure 4: Healthy Places Index for MMCR. ................................................................................................. 27
Figure 5: MMCR Communities of Concern. ................................................................................................ 29
Figure 6: Community Health Assessment Conceptual Model as modified from the County Health
Rankings Model, Robert Wood Johnson Foundation, and University of Wisconsin, 2015 ........................ 46

                                                                                                                                                      4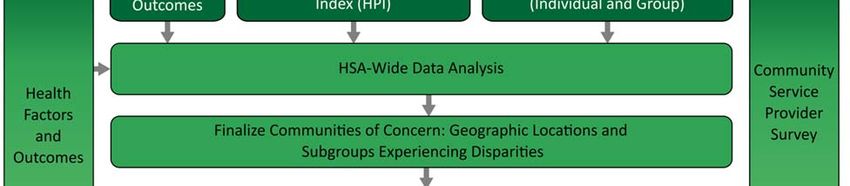
Figure 7: CHNA process model for MMCR .................................................................................................. 48
Figure 8: Community of Concern identification process ............................................................................ 68
Figure 9: Significant health need identification process. ............................................................................ 70

                                                                                                                                         5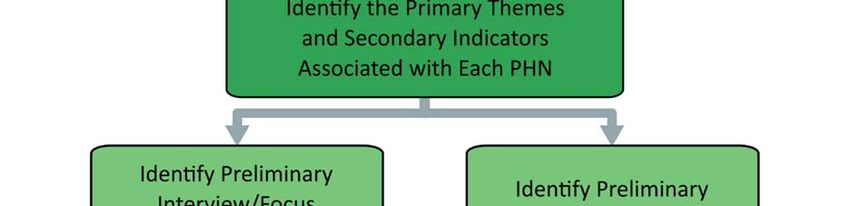
Report Summary
Purpose
The purpose of this community health needs assessment (CHNA) was to identify and prioritize significant
health needs of the Mercy Medical Center Redding (MMCR) service area. The priorities identified in this
report help to guide nonprofit hospitals’ community health improvement programs and community
benefit activities as well as their collaborative efforts with other organizations that share a mission to
improve health. This CHNA report meets the requirements of the Patient Protection and Affordable Care
Act (and in California, Senate Bill 697) that nonprofit hospitals conduct a community health needs
assessment at least once every three years. The CHNA was conducted by Community Health Insights
(www.communityhealthinsights.com).

Community Definition
The definition of the community served was the primary service area of MMCR, including large portions
of Shasta County, and a smaller portion of Tehama County. Both counties are considered predominately
rural, and are located in Northern California, situated along the north‐south Interstate 5 corridor. For
the purposes of this assessment, the service area was further defined by 15 ZIP codes, 13 of which were
located in Shasta and the remaining two in Tehama. The Shasta County ZIP codes included 96001,
96002, 96003, 96007, 96019, 96024, 96033, 96047, 96052, 96073, 96087, 96088, and 96093. The
Tehama County ZIP codes included 96022 and 96080. Collectively the total population of the service
area was 208,158. The total population of the service area was 208,158.

Assessment Process and Methods
The data used to conduct the CHNA were identified and organized using the widely recognized Robert
Wood Johnson Foundation’s County Health Rankings model.1 This model of population health includes
many factors that impact and account for individual health and well‐being. Furthermore, to guide the
overall process of conducting the assessment, a defined set of data‐collection and analytic stages were
developed. These included the collection and analysis of both primary (qualitative) and secondary
(quantitative) data. Qualitative data included one‐on‐one and group interviews with 16 community
health experts, social service providers, and medical personnel. Furthermore, 59 community residents or
community service provider organizations participated in 7 focus groups across the service area. Finally,
7 community service providers responded to a Community Service Provider (CSP) survey asking about
health need identification and prioritization.

Focusing on social determinants of health to identify and organize secondary data, datasets included
measures to describe mortality and morbidity and social and economic factors such as income,
educational attainment, and employment. Furthermore, the measures also included indicators to
describe health behaviors, clinical care (both quality and access), and the physical environment.

At the time that this CHNA was conducted, the COVID‐19 pandemic was still impacting communities
across the United States, including MMCR’s service area. The process for conducting the CHNA remained

1
 See: County Health Rankings Model, Robert Wood Johnson Foundation, and University of Wisconsin, 2021.
Retrieved from: http://www.countyhealthrankings.org/.

                                                                                                         6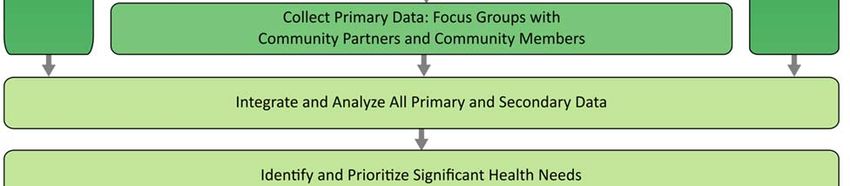
fundamentally the same. However, there were some adjustments made during the qualitative data
collection to ensure the health and safety of those participating. Additionally, COVID‐19 data were
incorporated into the quantitative data analysis and COVID‐19 impact was captured during qualitative
data collection. These findings are reported throughout various sections of the report.

Process and Criteria to Identify and Prioritize Significant Health Needs
Primary and secondary data were analyzed to identify and prioritize significant health needs. This began
by identifying 12 potential health needs (PHNs). These PHNs were identified in previously conducted
CHNAs. Data were analyzed to discover which, if any, of the PHNs were present in the service area. After
these were identified, PHNs were prioritized based on rankings provided by primary data sources. Data
were also analyzed to detect emerging health needs beyond those 12 PHNs identified in previous
CHNAs.

List of Prioritized Significant Health Needs
The following significant health needs identified for MMCR are listed below in prioritized order.

  1.    Access to Mental/Behavioral Health and Substance‐Use Services
  2.    Access to Basic Needs Such as Housing, Jobs, and Food
  3.    Access to Quality Primary Care Health Services
  4.    Access to Specialty and Extended Care
  5.    Increased Community Connections
  6.    Safe and Violence‐Free Environment
  7.    System Navigation
  8.    Injury and Disease Prevention and Management
  9.    Access to Functional Needs

Resources Potentially Available to Meet the Significant Health Needs
In all, 130 resources were identified in the service area that were potentially available to meet the
identified significant health needs. The identification method included starting with the list of resources
from the 2019 CHNA, verifying that the resources still existed, and then adding newly identified
resources into the 2022 CHNA report.

Conclusion
This CHNA details the process and findings of a comprehensive community health needs assessment to
guide decision‐making for the implementation of community health improvement efforts using a health
equity lens. The CHNA includes an overall health and social examination of MMCR’s service area and
clearly details the needs of community members living in parts of the service area where the residents
experience more health disparities. This report also serves as a resource for community organizations in
their effort to improve health and well‐being of the communities they serve.

                                                                                                          7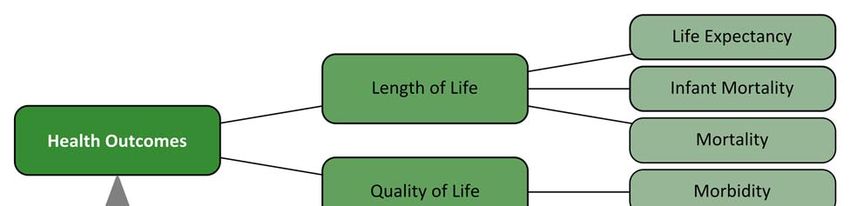
Introduction and Purpose
Both state and federal laws require that nonprofit hospitals conduct a community health needs
assessment (CHNA) every three years to identify and prioritize the significant health needs of the
communities they serve. The results of the CHNA guide the development of implementation plans
aimed at addressing identified health needs. Federal regulations define a health need accordingly:
“Health needs include requisites for the improvement or maintenance of health status in both the
community at large and in particular parts of the community (such as particular neighborhoods or
populations experiencing health disparities)” (p. 78963).2

This report documents the processes, methods, and findings of a CHNA conducted on behalf of Mercy
Medical Center Redding (MMCR), located at 2175 Rosaline Ave., Redding, CA, 96001. MMCR’s primary
service area includes Shasta County and a small portion of Tehama County, CA. The total population of
the service area was 208,158.

MMCR is an affiliate of Dignity Health, a nonprofit healthcare system. The CHNA was conducted over a
period of six months, beginning in August, 2021 and concluding in January, 2022. This CHNA report
meets requirements of the Patient Protection and Affordable Care Act and California Senate Bill 697 that
nonprofit hospitals conduct a community health needs assessment at least once every three years.

Community Health Insights (www.communityhealthinsights.com) conducted the CHNA on the behalf of
MMCR. Community Health Insights is a Sacramento‐based research‐oriented consulting firm dedicated
to improving the health and well‐being of communities across Central and Northern California.
Community Health Insights has conducted dozens of CHNAs for multiple health systems and local health
departments over the previous decade.

                                                 Findings
Prioritized Significant Health Needs
Primary and secondary data were analyzed to identify and prioritize the significant health needs in the
MMCR service area. In all, 9 significant health needs were identified. Primary data were then used to
prioritize these significant health needs.

Prioritization was based on two measures that came from the key informant interview and focus group
results. These included the percentage of sources that identified a health need as existing in the
community, and the percentage of times the sources identified a health need as a top priority. Table 1
shows the value of these measures for each significant health need.

2
 Federal Register, Vol. 79, No. 250, (Wednesday, December 31, 2014). Department of the Treasury, Internal
Revenue Service.

                                                                                                            8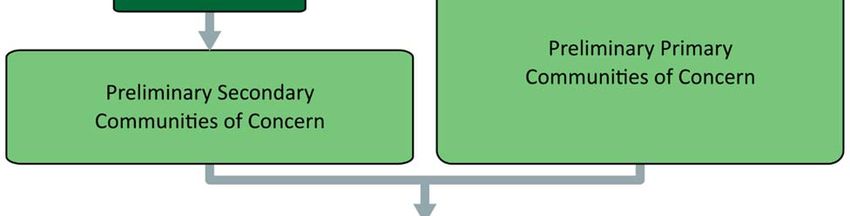
Table 1: Health need prioritization inputs for MMCR service area.
                                                                                      Percentage of Times Key
                                                   Percentage of Key
                                                                                   Informants and Focus Groups
         Prioritized Health Needs            Informants and Focus Groups
                                                                                  Identified Health Need as a Top
                                                Identifying Health Need
                                                                                              Priority
1. Access to Mental/Behavioral
   Health and Substance‐Use                                89%                                    39%
   Services
2. Access to Basic Needs Such as
                                                           79%                                    32%
   Housing, Jobs, and Food
3. Access to Quality Primary Care
                                                           63%                                    9%
   Health Services
4. Access to Specialty and
                                                           68%                                    3%
   Extended Care
5. Increased Community
                                                           58%                                    3%
   Connections
6. Safe and Violence‐Free
                                                           47%                                    7%
   Environment
7. System Navigation                                       53%                                    3%
8. Injury and Disease Prevention
                                                           47%                                    3%
   and Management
9. Access to Functional Needs                              47%                                     ~
~ Health need not mentioned

These measures were then combined to create a health need prioritization index. The highest priority
was given to health needs that were more frequently mentioned and were more frequently identified
among the top priority needs.3 The prioritization index values are shown in Figure 1, where health needs
are ordered from highest priority at the top of the figure to lowest priority at the bottom.

3
    Further details regarding the creation of the prioritization index can be found in the technical report.

                                                                                                                    9
Mercy Medical Center Redding 2022 Prioritized Health Needs

     Access to Mental/Behavioral
      Health and Substance-Use
                       Services

 Access to Basic Needs Such as
       Housing, Jobs, and Food

  Access to Quality Primary Care
                Health Services

         Access to Specialty and
                 Extended Care

          Increased Community
                  Connections

         Safe and Violence-Free
                   Environment

              System Navigation

   Injury and Disease Prevention
                and Management

     Access to Functional Needs

                                   0.0               0.5              1.0               1.5              2.0
                                                           Prioritization Index Value

                   Figure 1: Prioritized significant health needs for MMCR service area.

While COVID‐19 was top of mind for many participating in the primary data collection process, feedback
regarding the impact of COVID‐19 confirmed that the pandemic exacerbated existing needs in the
community.

The significant health needs are described below. Those secondary data indicators used in the CHNA
that performed poorly compared to benchmarks are listed in the table below each significant health.
These are ordered by their relationship to the conceptual model used to guide data collection for this
report. Results from primary data analysis are also provided in the table. (A full listing of all quantitative
indicators can be found in the technical section of this report).

                                                                                                               10
1. Access to Mental/Behavioral Health and Substance‐Use Services
Individual health and well‐being are inseparable from individual mental and emotional outlook. Coping
with daily life stressors is challenging for many people, especially when other social, familial, and
economic challenges occur. Access to mental, behavioral, and substance‐use services is an essential
ingredient for a healthy community where residents can obtain additional support when needed.
Primary Data Analysis Secondary Data Analysis
The manner in which the health need appeared or was The following indicators performed
expressed in the community was described as follows by key worse in the service area when
informants and focus group participants: compared to state averages:
Substance use continues to be a significant issue in the Life Expectancy
community. Premature Age‐Adjusted Mortality
The community seems to overly rely only on the Premature Death
criminal justice system to address substance use. Liver Disease Mortality
There are not enough mental health providers available Suicide Mortality
for low‐income populations. Poor Mental Health Days
There are excessive wait times to get mental health Frequent Mental Distress
appointments. Poor Physical Health Days
Mental health providers treat patients differently based Frequent Physical Distress
on the type of insurance they have. Excessive Drinking
Generational trauma is an issue in many communities. Drug Induced Death
The number of people experiencing homelessness is Adult Smoking
growing as a result of untreated mental health issues. Primary Care Shortage Area
Many mental health providers do not take Medi‐Cal, Mental Health Care Shortage Area
adding challenges to accessing care. Medically Underserved Area
Racism is an underlying cause of toxic stress for some in Psychiatry Providers
the community. Firearm Fatalities Rate
There is a stigma associated with seeking mental health Disconnected Youth
services, and many avoid treatment as a result.
Homelessness Rate
Many in the LGTBQ community suffer from mental
health issues due to discrimination.
Repeated wildfires have traumatized the community.
Reimbursement policies for mental health are
problematic in treating some patients.
Adverse childhood experiences are significant in the
community.
The area lacks resources to treat acute mental health
crises.
Navigating the mental health services system is difficult.
Additional mental health services are needed
specifically for youth and those experiencing
homelessness.
Untreated mental health issues lead to substance use.
The community needs culturally competent mental
health providers.
112. Access to Basic Needs Such as Housing, Jobs, and Food
Access to affordable and clean housing, stable employment, quality education, and adequate food for
good health are vital for survival. Maslow’s Hierarchy of Needs4 suggests that only when people have
their basic physiological and safety needs met can they become engaged members of society and self‐
actualize or live to their fullest potential, including enjoying good health. Research shows that the social
determinants of health, such as quality housing, adequate employment and income, food security,
education, and social support systems, influence individual health as much as health behaviors and
access to clinical care.5
Primary Data Analysis Secondary Data Analysis
The manner in which the health need appeared or was The following indicators performed worse
expressed in the community was described as follows by in the service area when compared to
key informants and focus group participants: state averages:
Housing shortages are critical in the community; this Infant Mortality
contributes to the growing homeless population. Child Mortality
Limited education attainment keeps many in Life Expectancy
generational poverty. Premature Age‐Adjusted Mortality
The community needs more resources for post‐ Premature Death
secondary education. Hypertension Mortality
The wildfires have contributed to the ongoing housing COVID‐19 Mortality
shortages. COVID‐19 Case Fatality
The community needs more housing development in Diabetes Prevalence
the downtown area. Poor Mental Health Days
Economic development throughout the community is Frequent Mental Distress
needed. Poor Physical Health Days
Education attainment is especially low among Frequent Physical Distress
conservative white males. Drug Induced Death
"Homelessness is where ACES go to die" (quote). Adult Obesity
The community is being inundated with homeless Limited Access to Healthy Foods
populations. Food Environment Index
Relocations from other areas during the pandemic have Medically Underserved Area
added to housing shortages. COVID‐19 Cumulative Full Vaccination
Rural areas of the community are especially hard‐hit Rate
with housing shortages. Disconnected Youth
There is limited day‐care in rural communities; this Unemployment
creates challenges for those working with children.
Children in Poverty
Many residents struggle with food insecurity.
Median Household Income
Affordable childcare is a problem for some parents.
Homelessness Rate
Employment opportunities in the community are
limited.
Services can be inaccessible for Spanish‐speaking and
immigrant residents of the community.
4
McLeod, S. 2014. Maslow’s Hierarchy of Needs. Retrieved from: http://www.simplypsychology.org/maslow.html
5
See: http://www.countyhealthrankings.org/learn‐others/research‐articles#Rankingsrationale
123. Access to Quality Primary Care Health Services
Primary care resources include community clinics, pediatricians, family practice physicians, internists,
nurse practitioners, pharmacists, telephone advice nurses, and other similar resources. Primary care
services are typically the first point of contact when an individual seeks healthcare. These services are
the front line in the prevention and treatment of common diseases and injuries in a community.
Primary Data Analysis Secondary Data Analysis
The manner in which the health need appeared or was The following indicators performed worse
expressed in the community was described as follows by key in the service area when compared to
informants and focus group participants: state averages:
There are a limited number of providers that take Medi‐ Infant Mortality
Cal. Child Mortality
Low‐income residents do not have the same level of Life Expectancy
access as do more affluent populations. Premature Age‐Adjusted Mortality
Many low‐income residents avoid treatment due to the Premature Death
costs. Stroke Mortality
Some providers do not spend an adequate amount of Chronic Lower Respiratory Disease
time with patients. Mortality
For some, there are excessive wait times to get Diabetes Mortality
appointments with primary care providers. Heart Disease Mortality
It is difficult to recruit and retain healthcare workers to Hypertension Mortality
the community. Cancer Mortality
While telehealth services have grown, low‐income Liver Disease Mortality
populations often do not have access to reliable Kidney Disease Mortality
internet services to utilize these. COVID‐19 Mortality
Out‐of‐pocket costs for healthcare services present a COVID‐19 Case Fatality
barrier for some in the community. Alzheimer's Disease Mortality
Quality healthcare insurance is unaffordable to many in Influenza and Pneumonia Mortality
the community. Diabetes Prevalence
Poor Mental Health Days
Frequent Mental Distress
Poor Physical Health Days
Frequent Physical Distress
Colorectal Cancer Prevalence
Breast Cancer Prevalence
Lung Cancer Prevalence
Prostate Cancer Prevalence
Primary Care Shortage Area
Medically Underserved Area
COVID‐19 Cumulative Full
Vaccination Rate
Homelessness Rate
134. Access to Specialty and Extended Care
Extended care services, which include specialty care, are services provided in a particular branch of
medicine and focused on the treatment of a particular disease. Primary and specialty care go hand in
hand, and without access to specialists, such as endocrinologists, cardiologists, and gastroenterologists,
community residents are often left to manage the progression of chronic diseases, including diabetes
and high blood pressure, on their own. In addition to specialty care, extended care refers to care
extending beyond primary care services that is needed in the community to support overall physical
health and wellness, such as skilled‐nursing facilities, hospice care, and in‐home healthcare.
Primary Data Analysis Secondary Data Analysis
The manner in which the health need appeared or was The following indicators performed worse
expressed in the community was described as follows by key in the service area when compared to
informants and focus group participants: state averages:
Accessing any specialty is a challenge for those covered Infant Mortality
by Medi‐Cal. Life Expectancy
Many have to travel out of the community to see a Premature Age‐Adjusted Mortality
specialist. Premature Death
The community lacks an adequate number of skilled Stroke Mortality
nursing facilities. Chronic Lower Respiratory Disease
Wait times for specialist appointments can be Mortality
excessively long. Diabetes Mortality
It is difficult to recruit and retain specialists in the area. Heart Disease Mortality
Not all specialty care is covered by insurance. Hypertension Mortality
Out‐of‐pocket costs for specialty care is high. Cancer Mortality
Too few specialty and extended care providers accept Liver Disease Mortality
Medi‐Cal. Kidney Disease Mortality
The area needs more extended care options for the COVID‐19 Mortality
aging population. COVID‐19 Case Fatality
There is not enough OB/GYN care available. Alzheimer's Disease Mortality
Additional hospice and palliative care options are Diabetes Prevalence
needed. Poor Mental Health Days
There is limited home care in rural areas. Frequent Mental Distress
Poor Physical Health Days
Frequent Physical Distress
Lung Cancer Prevalence
Drug Induced Death
Psychiatry Providers
Specialty Care Providers
Homelessness Rate
5. Increased Community Connections
As humans are social beings, community connection is a crucial part of living a healthy life. People have
a need to feel connected with a larger support network and the comfort of knowing they are accepted
and loved. Research suggests “individuals who feel a sense of security, belonging, and trust in their
14community have better health. People who don’t feel connected are less inclined to act in healthy ways
or work with others to promote well‐being for all.”6 Assuring that community members have ways to
connect with each other through programs, services, and opportunities is important in fostering a
healthy community. Furthermore, healthcare and community support services are more effective when
they are delivered in a coordinated fashion, where individual organizations collaborate with others to
build a network of care.
Primary Data Analysis Secondary Data Analysis
The manner in which the health need appeared or was The following indicators performed worse
expressed in the community was described as follows by in the service area when compared to
key informants and focus group participants: state averages:
Isolation, especially among seniors, has been Infant Mortality
exacerbated during the pandemic. Child Mortality
Some with conservative views are not welcoming of Life Expectancy
the LGBTQ community. Premature Age‐Adjusted Mortality
There needs to be better coordination among the Premature Death
those delivering healthcare services. Stroke Mortality
A "whole person" approach is needed between mental Diabetes Mortality
and healthcare services. Heart Disease Mortality
Hypertension Mortality
Suicide Mortality
Unintentional Injuries Mortality
Diabetes Prevalence
Poor Mental Health Days
Frequent Mental Distress
Poor Physical Health Days
Frequent Physical Distress
Excessive Drinking
Drug Induced Death
Access to Exercise Opportunities
Teen Birth Rate
Primary Care Shortage Area
Mental Health Care Shortage Area
Medically Underserved Area
Psychiatry Providers
Specialty Care Providers
COVID‐19 Cumulative Full Vaccination
Rate
Homicide Rate
Firearm Fatalities Rate
Violent Crime Rate
Disconnected Youth
6
Robert Wood Johnson Foundation. 2016. Building a Culture of Health: Sense of Community. See:
https://www.rwjf.org/en/cultureofhealth/taking‐action/making‐health‐a‐shared‐value/sense‐of‐community.html
15Primary Data Analysis Secondary Data Analysis
The manner in which the health need appeared or was The following indicators performed worse
expressed in the community was described as follows by in the service area when compared to
key informants and focus group participants: state averages:
Unemployment
Homelessness Rate
Access to Public Transit
6. Safe and Violence‐Free Environment
Feeling safe in one’s home and community is fundamental to overall health. Next to having basic needs
met (e.g., food, shelter, and clothing) is having physical safety. Feeling unsafe affects the way people act
and react to everyday life occurrences. Furthermore, research has demonstrated that individuals
exposed to violence in their homes, the community, and schools are more likely to experience
depression and anxiety and demonstrate more aggressive, violent behavior.7
Primary Data Analysis Secondary Data Analysis
The manner in which the health need appeared or was The following indicators performed worse
expressed in the community was described as follows by in the service area when compared to
key informants and focus group participants: state averages:
There are a limited number of bike lanes in the Life Expectancy
community. Premature Death
Bullying in schools is a contributor to poor mental Hypertension Mortality
health for youth. Poor Mental Health Days
Many in the LGBTQ community do not feel safe in the Frequent Mental Distress
community. Frequent Physical Distress
Family and domestic violence are issues in the Access to Exercise Opportunities
community, resulting in adverse childhood experiences. Homicide Rate
Some healthcare providers need training on how to Firearm Fatalities Rate
treat those suffering from domestic violence. Violent Crime Rate
Motor Vehicle Crash Death
Disconnected Youth
Homelessness Rate
7. System Navigation
System navigation refers to an individual’s ability to traverse fragmented social services and healthcare
systems in order to receive the necessary benefits and supports to improve health outcomes. Research
has demonstrated that navigating the complex U.S. healthcare system is a barrier for many that results
7
Lynn‐Whaley, J., & Sugarmann, J. July 2017. The Relationship Between Community Violence and Trauma. Los
Angeles: Violence Policy Center.
16in health disparities.8 Furthermore, accessing social services provided by government agencies can be an
obstacle for those with limited resources such as transportation access and English proficiency.
Primary Data Analysis Secondary Data Analysis
The manner in which the health need appeared or was The following indicators performed
expressed in the community was described as follows by key worse in the service area when
informants and focus group participants: compared to state averages:
Navigating the healthcare system can be overwhelming for (There are no secondary indicators
some. associated with this indicator).
Language barriers prevent many from accessing needed
resources.
Healthcare providers often get frustrated dealing with the
system's inefficiencies.
Case management is needed to help some navigate social
and healthcare services.
People may not be aware of the services they are eligible
for.
Dealing with medical and insurance paperwork can be
overwhelming for some.
8. Injury and Disease Prevention and Management
Knowledge is important for individual health and well‐being, and efforts aimed at injury and disease
prevention are powerful vehicles to improve community health. When community residents lack
adequate information on how to prevent, manage, and control their health conditions, those conditions
tend to worsen. Prevention efforts focus on reducing cases of injury and infectious disease control (e.g.,
sexually transmitted infection (STI) prevention and influenza shots), and intensive strategies in the
management of chronic diseases (e.g., diabetes, hypertension, obesity, and heart disease) are important
for community health improvement.
8
Natale‐Pereira, A. et. al .2011. The Role of Patient Navigators in Eliminating Health Disparities. US National Library
of Medicine, National Institutes of Health, 117:15, 3543‐3552.
17Primary Data Analysis Secondary Data Analysis
The manner in which the health need appeared or was The following indicators performed
expressed in the community was described as follows by key worse in the service area when
informants and focus group participants: compared to state averages:
There needs to be a greater focus on prevention in the Infant Mortality
community. Child Mortality
There is a lack of comprehensive sex education in Stroke Mortality
community schools. Chronic Lower Respiratory Disease
Access to birth control is an issue in the community. Mortality
The community has high rates of STIs. Diabetes Mortality
The community needs to move "upstream" to deal with Heart Disease Mortality
unwanted pregnancies. Hypertension Mortality
The community needs to be more proactive in Liver Disease Mortality
prevention. Kidney Disease Mortality
Suicide Mortality
Unintentional Injuries Mortality
COVID‐19 Mortality
COVID‐19 Case Fatality
Alzheimer's Disease Mortality
Diabetes Prevalence
Poor Mental Health Days
Frequent Mental Distress
Frequent Physical Distress
Excessive Drinking
Drug Induced Death
Adult Obesity
Teen Birth Rate
Adult Smoking
COVID‐19 Cumulative Full
Vaccination Rate
Firearm Fatalities Rate
Motor Vehicle Crash Death
Disconnected Youth
Homelessness Rate
9. Access to Functional Needs
Functional needs refer to needs related to adequate transportation access and conditions which
promote access for individuals with physical disabilities. Having access to transportation services to
support individual mobility is a necessity of daily life. Without transportation, individuals struggle to
meet their basic needs, including those needs that promote and support a healthy life. The number of
people with a disability is also an important indicator for community health and must be examined to
ensure that all community members have access to necessities for a high quality of life.
18Primary Data Analysis Secondary Data Analysis
The manner in which the health need appeared or was The following indicators performed worse
expressed in the community was described as follows by in the service area when compared to
key informants and focus group participants: state averages:
Commuting in rural communities without a car is Disability
difficult. Frequent Mental Distress
The community is not easy to get around if you are Frequent Physical Distress
disabled. Adult Obesity
There are large distances between services in the COVID‐19 Cumulative Full Vaccination
community; this is challenging if you do not have a car. Rate
Homelessness Rate
Access to Public Transit
Methods Overview
Conceptual and Process Models
The data used to conduct the CHNA were identified and organized using the widely recognized Robert
Wood Johnson Foundation’s County Health Rankings model.9 This model of population health includes
the many factors that impact and account for individual health and well‐being. Furthermore, to guide
the overall process of conducting the assessment, a defined set of data collection and analytic stages
were developed. For a detailed review of methods, see the technical section.
Public Comments from Previously Conducted CHNAs
Regulations require that nonprofit hospitals include written comments from the public on their
previously conducted CHNAs and most recently adopted Implementation Strategies. MMCR requested
written comments from the public on its 2019 CHNA and most recently adopted implementation
strategy in the documents and through its web site at https://www.dignityhealth.org/north‐
state/locations/mercy‐redding/about‐us/community‐benefit.
At the time of the development of this CHNA report, MMCR had not received written comments. MMCR
will continue to use its website as a tool to solicit public comments and ensure that these comments are
considered as community input in the development of future CHNAs.
Data Used in the CHNA
Data collected and analyzed included both primary (or qualitative) data and secondary (or quantitative)
data. Primary data included 5 interviews with 16 community health experts, 7 focus groups conducted
with a total of 59 community residents or community‐facing service providers, and 7 responses to the
9
See: County Health Rankings Model, Robert Wood Johnson Foundation, and University of Wisconsin, 2021.
Retrieved from: http://www.countyhealthrankings.org/.
19Community Service Provider survey. (A full listing of all participants can be seen in the technical section
of this report.)
Secondary data included multiple datasets selected for use in the various stages of the analysis. A
combination of mortality and socioeconomic datasets collected at subcounty levels was used to identify
portions of the hospital service area with greater concentrations of disadvantaged populations and poor
health outcomes. A set of county‐level indicators was collected from various sources to help identify and
prioritize significant health needs. Additionally, socioeconomic indicators were collected to help
describe the overall social conditions within the service area. Health outcome indicators included
measures of both mortality (length of life) and morbidity (quality of life). Health factor indicators
included measures of 1) health behaviors, such as diet and exercise and tobacco, alcohol, and drug use;
2) clinical care, including access to quality of care; 3) social and economic factors such as race/ethnicity,
income, educational attainment, employment, neighborhood safety, and similar; and 4) physical
environment measures, such as air and water quality, transit and mobility resources, and housing
affordability. In all, 86 different health‐outcome and health factor indicators were collected for the
CHNA.
Data Analysis
Primary and secondary data were analyzed to identify and prioritize the significant health needs within
the MMCR service area. This included identifying 12 PHNs in these communities. These potential health
needs were those identified in previously conducted CHNAs. Data were analyzed to discover which, if
any, of the PHNs were present in the hospital’s service area. After these were identified, health needs
were prioritized based on an analysis of primary data sources that described the PHN as a significant
health need.
For an in‐depth description of the processes and methods used to conduct the CHNA, including primary
and secondary data collection, analysis, and results, see the technical section of this report.
Description of Community Served
The definition of the community served was the primary service area of MMCR, including large portions
of Shasta County, and a smaller portion of Tehama County. Both counties are located in Northern
California. Shasta County has a total area of 3,847 square miles, and covers the Redding California
Metropolitan Statistical Area. According to the US Census, the county’s 2020 population was
approximately 180 thousand residents. The county seat is Redding, home to approximately one‐half of
Shasta County residents. Situated along the north‐south Interstate 5 corridor the county is lined with
mountains on its north, east, and west sides. Beyond Redding, the county is rural. Only a small portion
of the MMCR service area dips into northern Tehama County. This area includes the city of Red Bluff,
which is both the Tehama County Seat and the largest city in the county, with a population of just over
14 thousand residents.
For the purposes of this assessment, the service area was further defined by 15 ZIP codes, 13 of which
were located in Shasta and the remaining two in Tehama. The Shasta County ZIP codes included 96001,
96002, 96003, 96007, 96019, 96024, 96033, 96047, 96052, 96073, 96087, 96088, and 96093. The
Tehama County ZIP codes included 96022 and 96080. Collectively the total population of the service
area was 208,158. The service area is shown in Figure 2.
20Figure 2: Community served by MMCR.
Population characteristics for each ZIP code in the service area are presented in Table 2. These are
compared to the state and county characteristics for descriptive purposes. Any ZIP code with values that
compared negatively to the state or county is highlighted.
21Table 2: Population characteristics for each ZIP code located in the MMCR service area.
% Without High School
% With High Housing
% Unemployment
Median Age (yrs.)
% With Disability
Total Population
% Non‐White or
Median Income
Hispanic\Latinx
% Uninsured
Graduation
% Poverty
Costs
ZIP code
96001 34,293 18.5 41.6 $55,821 14.1 5.6 6.5 7.8 38.6 15.5
96002 34,196 27 37.4 $61,055 17.1 5 7.1 8.2 35.8 15.5
96003 44,328 19.1 40.8 $53,512 17.1 5 5.5 7.8 37.8 18.4
96007 23,228 23.5 40.2 $49,044 17.9 6.2 6.6 12.2 35.9 20.6
96019 10,178 20.6 38.5 $49,583 18.8 6.5 9 10.4 41.2 21.7
96024 846 19.6 58.9 $40,563 32.6 5.4 15 10 29.6 29.9
96033 490 12.4 51.5 $43,047 9.2 4.1 8.4 11.4 34.5 27.3
96047 849 19 55.3 $45,833 22 5.5 6.7 15.2 24.8 25.3
96052 1,574 19.9 52.1 $43,250 22.2 4.3 5.3 9.7 39.6 25
96073 3,980 10.6 54.5 $92,222 7.4 3 5.4 1.8 36.4 15.3
96087 544 10.3 50.3 $40,329 3.7 21.3 9.4 4.1 28 21
96088 4,690 12.6 57.1 $51,039 9.8 4.2 4 12 33.3 26.7
96093 3,570 11.5 41.1 $46,039 18.4 12.9 6 11.5 40.4 13.9
Shasta 179,212 20.2 41.5 $54,667 16.7 5.5 6.5 8.9 36.6 18.3
96022 16,253 18.1 40.7 $55,049 20.5 5.2 4.9 11.9 38.8 19.7
96080 29,139 24.1 41 $41,316 21.2 8.8 5.8 10 38.9 19.9
Tehama 63,912 31.7 41 $44,514 22.1 8.6 6.3 15.5 38.4 18.9
California 39,283,497 62.8 36.5 $75,235 13.4 6.1 7.5 16.7 40.6 10.6
Source: 2019 American Community Survey 5‐year estimates; U.S. Census Bureau.
Note: While the majority of ZIP code 96022 is in Tehama County, a portion extends into
Shasta County.
Health Equity
The Robert Wood Johnson Foundation’s definition of health equity and social justice is used here to help
establish a common understanding for the concept of health equity.
“Health equity means that everyone has a fair and just opportunity to be healthier. This requires
removing obstacles to health such as poverty, discrimination, and their consequences, including
powerlessness and lack of access to good jobs with fair pay, quality education and housing, safe
environments, and health care.”
22Inequities experienced early and throughout one’s life, such as limited access to a quality education,
have health consequences that appear later in life as health disparities. Health disparities are defined as
“preventable differences in the burden of disease, injury, violence, or opportunities to achieve optimal
health experienced by populations, and defined by factors such as race or ethnicity, gender, education
or income, disability, geographic location or sexual orientation.”10
In the US, and many parts of the world, inequities are most apparent when comparing the health
outcomes of various racial and ethnic groups to one another. Using these comparisons, it is clear that
health inequities persist across communities, including Shasta and Tehama Counties.
This section of the report shows inequities in health outcomes, comparing these between race and
ethnic groups. These differences inform better planning for more targeted interventions.
Health Outcomes ‐ The Results of Inequity
The table below displays disparities among race and ethnic groups for the service area for life
expectancy, mortality, and low birth weight.
Table 3: Health outcomes comparing race and ethnicity in the MMCR service area.
American
Health Indian\
Description Asian Black Hispanic White Overall
Outcomes Alaska
Native
Shasta
Average number of years a
Life Expectancy 69.7 83.6 75.1 83 75.9 76.2
person can expect to live.
Number of deaths among
Child Mortality children under age 18 per ~ ~ ~ 42.3 52.1 52.3
100,000 population.
Number of deaths among
Premature Age‐
residents under age 75 per
Adjusted 697.2 259.6 516.8 263.3 445 434.4
100,000 population (age‐
Mortality
adjusted).
Years of potential life lost
Premature
before age 75 per 100,000 15,195.8 6,174 12,260.7 5,477.6 9,306.4 9,066.7
Death
population (age‐adjusted).
Percentage of live births with
Low Birthweight low birthweight (< 2,500 8.5% 9.4% 15.3% 6.6% 5.8% 6.4%
grams).
Tehama
Average number of years a
Life Expectancy ~ ~ ~ 84 75.1 76.5
person can expect to live.
10
Center for Disease Control and Prevention. 2008. Health Disparities Among Racial/Ethnic Populations.
Community Health and Program Services (CHAPS): Atlanta: U.S. Department of Health and Human Services.
23American
Health Indian\
Description Asian Black Hispanic White Overall
Outcomes Alaska
Native
Number of deaths among
Premature Age‐
residents under age 75 per
Adjusted 519.3 ~ ~ 268.2 494.1 445.4
100,000 population (age‐
Mortality
adjusted).
Years of potential life lost
Premature
before age 75 per 100,000 ~ ~ ~ 5,898.3 10,998.2 9,503.4
Death
population (age‐adjusted).
Percentage of live births with
Low Birthweight low birthweight (< 2,500 ~ ~ ~ 6.4% 5.6% 6%
grams).
~ Data Not Available
Data sources included in the technical section of the report.
Inequities are apparent when looking across race and ethnic groups. For example, in Shasta County life
expectancy for American Indian/Alaskan Natives is notably lower than all other population groups.
Health Factors ‐ Inequities in the Service Area
Inequities can be seen in data that help describe health factors in the service area, such as education
attainment and income. These health factors are displayed in the table below and are compared across
race and ethnic groups.
Table 4: Health factors comparing race and ethnicity in the MMCR service area.
American
Indian\
Health Factors Description Asian Black Hispanic White Overall
Alaska
Native
Shasta
Percentage of adults ages 25
Some Collegea and over with some post‐ 60.6% 66.5% 70.8% 55% 66.7% 65.7%
secondary education.
Percentage of adults ages 25
High School
and over with at least a high 85.9% 82.3% 88% 80.9% 92.5% 91.1%
Completiona
school diploma or equivalent.
Average grade level
Third Grade performance for 3rd graders
~ 3.1 2.5 2.9 3.1 3
Reading Level on English Language Arts
standardized tests
Average grade level
Third Grade
performance for 3rd graders ~ 2.9 2.4 2.6 2.8 2.8
Math Level
on math standardized tests
Children in Percentage of people under
26% 35.1% 6.2% 32.5% 20.2% 16.5%
Poverty age 18 in poverty.
24You can also read