A Comparison of Measurement Methods for Alcohol-Based Hand Sanitizers - NISTIR 8342
←
→
Page content transcription
If your browser does not render page correctly, please read the page content below
NISTIR 8342

 A Comparison of Measurement
Methods for Alcohol-Based Hand
 Sanitizers

 Mary Bedner
 Jacolin A. Murray
 Aaron A. Urbas
 William A. MacCrehan
 Walter B. Wilson

 This publication is available free of charge from:
 https://doi.org/10.6028/NIST.IR.8342
NISTIR 8342

 A Comparison of Measurement
 Methods for Alcohol-Based Hand
 Sanitizers
 Mary Bedner
 Jacolin A. Murray
 Aaron A. Urbas
 William A. MacCrehan
 Walter B. Wilson
 Chemical Sciences Division
 Material Measurement Laboratory

 This publication is available free of charge from:
 https://doi.org/10.6028/NIST.IR.8342

 February 2021

 U.S. Department of Commerce
 Wynn Coggins, Acting Secretary

 National Institute of Standards and Technology
James K. Olthoff, Performing the Non-Exclusive Functions and Duties of the Under Secretary of Commerce
 for Standards and Technology & Director, National Institute of Standards and Technology
Certain commercial entities, equipment, or materials may be identified in this
 document in order to describe an experimental procedure or concept adequately.
 Such identification is not intended to imply recommendation or endorsement by the
 National Institute of Standards and Technology, nor is it intended to imply that the
 entities, materials, or equipment are necessarily the best available for the purpose.

National Institute of Standards and Technology Interagency or Internal Report 8342
 Natl. Inst. Stand. Technol. Interag. Intern. Rep. 8342, 63 pages (February 2021)

 This publication is available free of charge from:
 https://doi.org/10.6028/NIST.IR.8342
Abstract
 The production and demand for hand sanitizers have increased dramatically during the
 coronavirus disease 2019 (COVID-19) health emergency. To be deemed effective and safe,
 hand sanitizers should contain at least 60 % alcohol (typically ethanol) as well as minimal
 amounts of harmful impurities regulated by the Food and Drug Administration (FDA). To
 help ensure product potency and safety through sound measurements, the National Institute
 of Standards and Technology (NIST) developed and evaluated four instrumental
 measurement approaches for their applicability in measuring ethanol and impurities in 72
This publication is available free of charge from: https://doi.org/10.6028/NIST.IR.8342

 hand sanitizers representing a range of brands and formulations. The methods included gas
 chromatography with flame ionization detection (GC-FID), liquid chromatography with
 ultraviolet absorbance detection (LC-UV), quantitative nuclear magnetic resonance
 spectroscopy (qNMR), and attenuated total reflectance Fourier-transform infrared
 spectroscopy (ATR-FTIR). All four instrumental methods can determine and provide
 comparable results for ethanol, the principle disinfectant in different hand sanitizer
 formulations. All methods can also confirm the presence of other alcohols potentially present
 in significant quantities (≈ percent levels) such as methanol, a harmful impurity, and
 isopropanol, which can be either the primary disinfectant or an approved denaturant in some
 formulations. Two of the methods, qNMR and GC-FID, were also able to determine
 impurities at the requisite sensitivity levels (µg/g) set by the FDA limits. This report presents
 descriptions and key results from each method. In addition, a discussion regarding the
 applicability and strengths and weaknesses of each measurement approach for the analysis of
 hand sanitizers is presented and discussed.
 Key words
 Hand sanitizer; Ethanol; Gas chromatography; Flame ionization detection; Nuclear magnetic
 resonance spectroscopy; Fourier-transform infrared spectroscopy; Liquid chromatography;
 Impurities.

 i
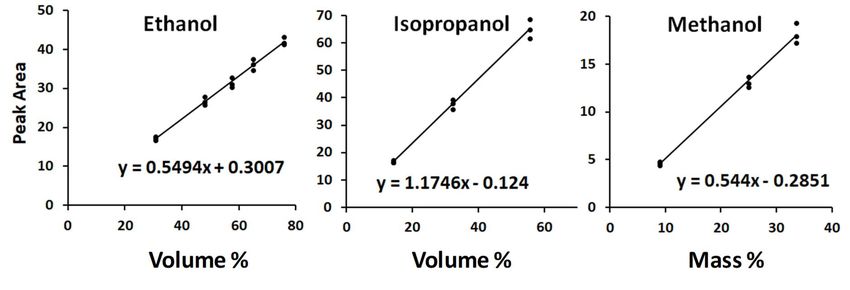
Table of Contents
 Introduction ..................................................................................................................... 1
 Experimental Section ...................................................................................................... 3
 2.1. Chemicals .................................................................................................................... 3
 2.2. Hand Sanitizer Materials ............................................................................................. 4
 2.3. Mass-Volume Considerations for Ethanol Mixtures ................................................... 4
 2.4. Analytical Methods ..................................................................................................... 6
This publication is available free of charge from: https://doi.org/10.6028/NIST.IR.8342

 2.4.1. ATR-FTIR Method................................................................................................ 6
 2.4.2. NMR Method ........................................................................................................ 8
 2.4.3. GC Methods ........................................................................................................ 10
 2.4.4. LC-UV Method ................................................................................................... 15
 2.4.5. Density................................................................................................................. 16
 Results and Discussion .................................................................................................. 19
 3.1. Results for Ethanol by All Methods .......................................................................... 19
 3.2. Results for Methanol and Isopropanol by Multiple Methods.................................... 23
 3.3. Individual Methods Results and Discussion ............................................................. 25
 3.3.1. ATR-FTIR Results .............................................................................................. 25
 3.3.2. NMR Results ....................................................................................................... 27
 3.3.3. GC Results ........................................................................................................... 31
 3.3.4. LC-UV Results .................................................................................................... 39
 3.3.5. Density Results .................................................................................................... 41
 Conclusions..................................................................................................................... 45
 References .............................................................................................................................. 48
 Appendix A: A summary of label information and product consistency for hand
 sanitizers analyzed. ............................................................................................................... 49
 Appendix B: NMR estimated results for impurities below FDA interim limits. ............ 53
 Appendix C. Plots of GC-FID results for impurities below FDA limits in some hand
 sanitizers. ............................................................................................................................... 54
 Appendix D. Density results for hand sanitizers (g/mL) obtained using a calibrated
 positive displacement pipette. .............................................................................................. 55

 List of Tables
 Table 1. FDA Interim Limits for Impurities in Hand Sanitizers (2020) [5-7]. ........................ 2
 Table 2. Chemical Reagents for Hand Sanitizer Ingredients and Impurities. .......................... 3

 ii
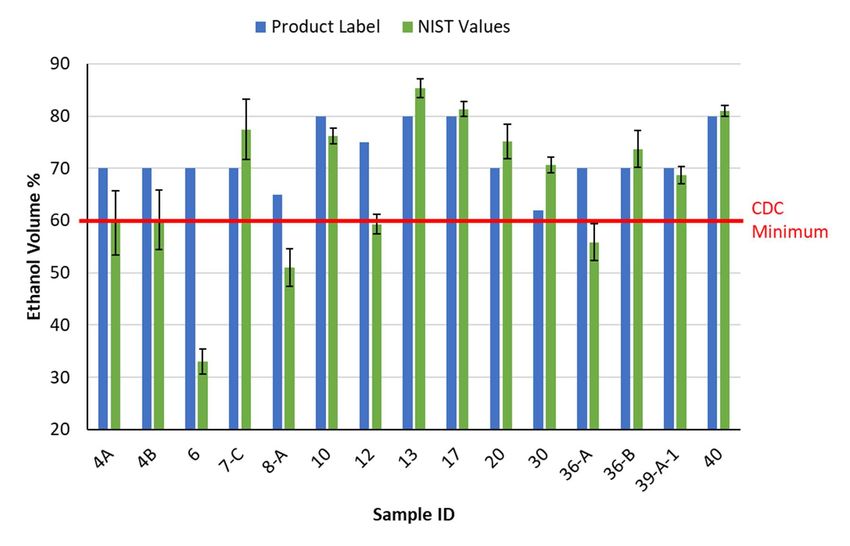
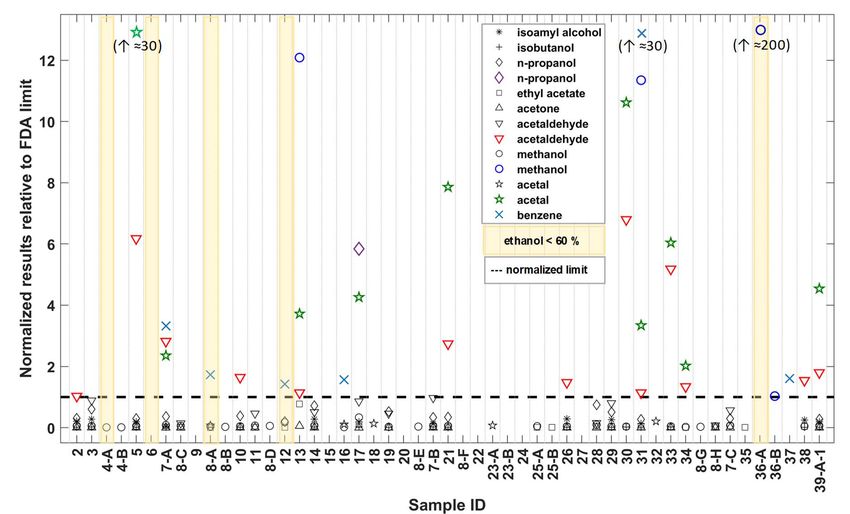
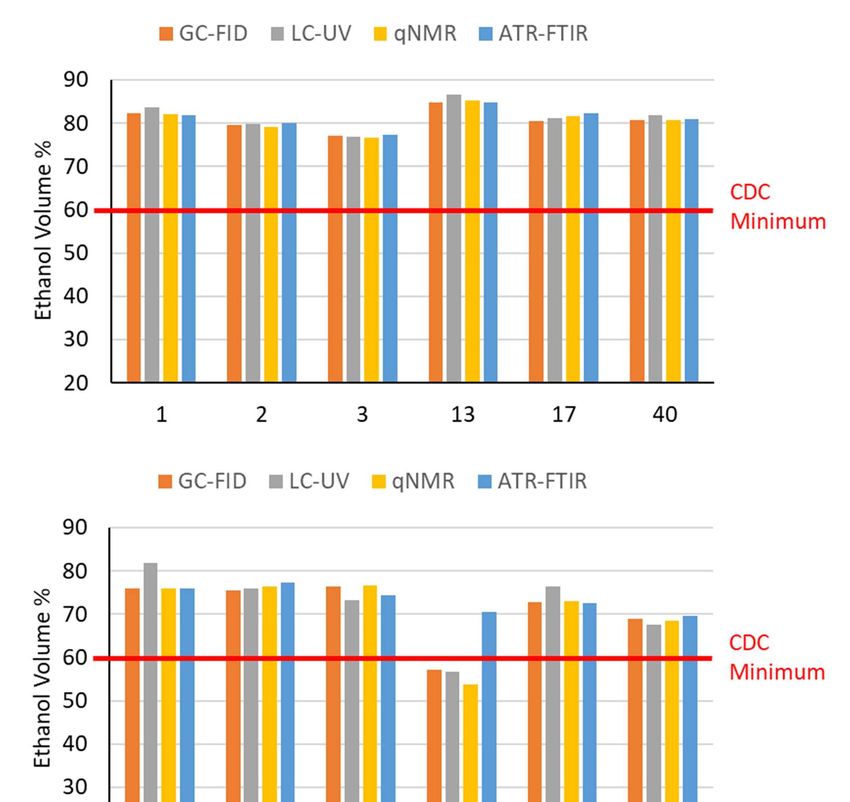
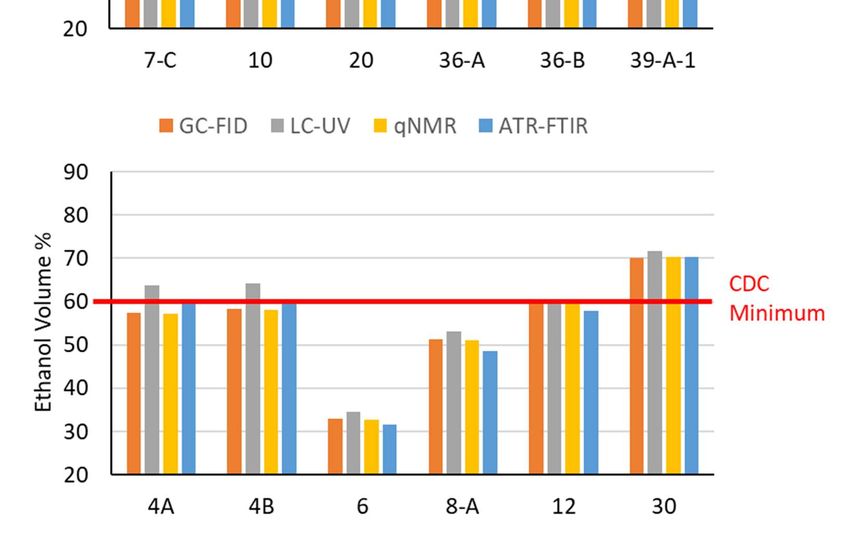
Table 3. Preparation of stock and intermediate stock solutions for impurity compound
 analysis by GC-FID. ............................................................................................................... 12
 Table 4. Calibration curve information for the impurities quantified by GC-FID. ................ 14
 Table 5. Results for ethanol (mass %) in 18 hand sanitizers by four methods. ..................... 21
 Table 6. Results for ethanol (volume %) in 18 hand sanitizers by four methods along with
 the average method result for comparison to the CDC minimum value and the product label.
 ................................................................................................................................................. 21
 Table 7. Summary of results for methanol (mass %) in 5 hand sanitizers by three methods. 24
 Table 8. Summary of results for isopropanol (volume %) in 6 hand sanitizers by three
 methods. .................................................................................................................................. 25
This publication is available free of charge from: https://doi.org/10.6028/NIST.IR.8342

 Table 9. Quantitative GC-FID results for impurities over the FDA limits in select hand
 sanitizers. ................................................................................................................................ 36
 Table 10. Quantitative GC-FID results for impurities below the FDA limits in select hand
 sanitizers. ................................................................................................................................ 37
 Table 11. Density results for select hand sanitizers obtained using three techniques ............ 42
 Table 12. Comparing the ethanol volume % predicted from density to measured values by
 ATR-FTIR for hand sanitizers believed to follow the WHO/FDA guidance. ........................ 43
 Table 13. Summary of method suitability for hand sanitizer measurements. ........................ 46

 List of Figures
 Figure 1. Relationship of volume % and mass % for ethanol in water mixtures at 20 ℃. ...... 5
 Figure 2. Spectra of calibrants used for the ATR-FTIR method. ............................................ 8
 Figure 3. Calibration plots of LC chromatographic peak area versus alcohol %. ................. 16
 Figure 4. Determination of density of hand sanitizers with a hydrometer. ............................ 18
 Figure 5. Plots of NIST method results for ethanol (volume %) in select hand sanitizers. ... 22
 Figure 6. Comparison of the NIST average result to the product label claim for ethanol
 volume %. ............................................................................................................................... 23
 Figure 7. ATR-FTIR spectra of hand sanitizers compared to ethanol and methanol. ........... 26
 Figure 8. Estimated ethanol volume % in hand sanitizers by ATR-FTIR. ............................ 27
 Figure 9. Example NMR spectrum of a hand sanitizer (Sample 2) showing ethanol, other
 ingredients, and impurities. ..................................................................................................... 28
 Figure 10. NMR estimates of denaturants in hand sanitizers. ............................................... 29
 Figure 11. NMR estimates of impurities above the FDA limits in some hand sanitizers. ..... 30
 Figure 12. Example GC-FID chromatograms of simple, non-gel formulation hand sanitizers.
 ................................................................................................................................................. 32
 Figure 13. Example GC-FID chromatograms for more complex (gel) hand sanitizer
 formulations and a calibrant.................................................................................................... 33
 Figure 14. Example GC-FID chromatograms for impurities in two hand sanitizers and a
 calibrant................................................................................................................................... 34
 Figure 15. Plots of GC-FID results for impurities above FDA limits in some hand sanitizers.
 ................................................................................................................................................. 38
 Figure 16. Separation and detection of a non-gel hand sanitizer (upper chromatogram) and
 an alcohol mixture (lower chromatogram) using LC-UV....................................................... 40
 Figure 17. Plot of predicted (density) versus measured (ATR-FTIR) ethanol volume %
 results for hand sanitizers following the WHO/FDA formula. ............................................... 44

 iii
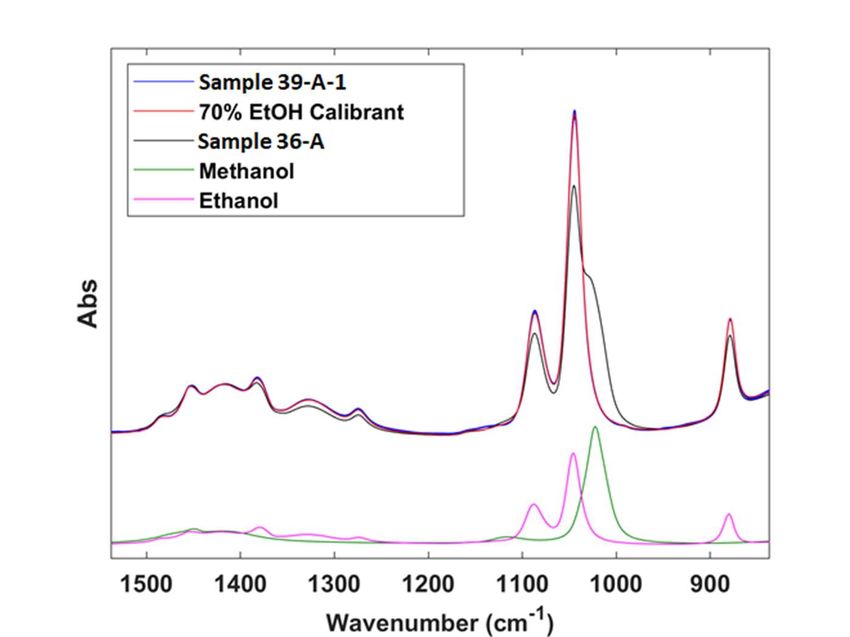
Figure 18. Plot of predicted (density) versus measured (ATR-FTIR) ethanol volume %
 results for all hand sanitizers in this study. ............................................................................. 44
 Figure 19. Summary of results for ethanol and impurities in most hand sanitizers evaluated
 in this work. ............................................................................................................................ 47

 ACRONYMS AND SYMBOLS

 ACS grade reagent meets or exceeds purity standards of the American Chemical Society
 ATR attenuated total reflectance
 C18 octyldecylsilane, analytical column for LC
This publication is available free of charge from: https://doi.org/10.6028/NIST.IR.8342

 CDC Centers for Disease Control and Prevention
 COVID-19 coronavirus disease 2019, officially known as SARS-CoV-2
 D2O deuterium oxide
 DMSO dimethyl sulfoxide
 DMSO2 dimethyl sulfone
 FID flame ionization detection
 FDA Food and Drug Administration
 FTIR Fourier transform infrared spectroscopy
 GC gas chromatography
 gel a liquid hand sanitizer with medium or high viscosity
 HCl hydrochloric acid
 HPLC-grade a solvent of quality for use in high performance liquid chromatography
 ID identifier code used for hand sanitizers
 KHP potassium hydrogen phthalate
 LC liquid chromatography
 LOD limit of detection
 mass % mass fraction expressed in percent
 MS mass spectrometry
 m/z mass-to-charge ratio (for MS)
 NIST National Institute of Standards and Technology
 NISTIR NIST Internal Report
 NMR nuclear magnetic resonance spectroscopy
 non-gel a liquid hand sanitizer with low viscosity
 ppm mass fraction expressed as parts per million (µg/g)
 %RSD percent relative standard deviation
 qNMR quantitative nuclear magnetic resonance spectroscopy
 δ (ppm) relative chemical shift, in parts per million of the magnetic field (for NMR)
 RF response factor (for chromatography)
 SD standard deviation
 SRM Standard Reference Material
 USA United States of America
 USP United States Pharmacopeia
 UV ultraviolet absorbance
 volume % volume fraction expressed in percent
 WHO World Health Organization

 iv
Introduction
 In January 2020, the World Health Organization (WHO) declared the coronavirus disease
 2019 (COVID-19) a global pandemic and public health emergency [1]. To help control the
 spread and decrease the risk of getting sick from this infectious virus [2], the WHO and the
 United States (U.S.) Centers for Disease Control and Prevention (CDC) recommend proper
 hand hygiene, including frequent handwashing and the use of alcohol-based hand sanitizers.
 To be deemed generally effective against germs, the CDC recommends that hand sanitizers
 should contain at least 60 % alcohol [3], which can be either ethanol (ethyl alcohol) or
 isopropanol (2-propanol). As a result, the demand and market for hand sanitizer products has
 increased dramatically in the United States and across the globe.
This publication is available free of charge from: https://doi.org/10.6028/NIST.IR.8342

 Hand sanitizers are classified as drugs and are regulated for safety and efficacy by the Food
 and Drug Administration (FDA) in the USA. Typically, hand sanitizer manufacturers are
 registered with the FDA and formulate their products using standard ingredients and testing
 procedures verified by the United States Pharmacopeia (USP). To respond to the increased
 demand and to ensure that hand sanitizers are widely available to the American public, the
 FDA has modified its procedures during the public health emergency and has enabled the
 following guidance and flexibilities for industry [4]: non-traditional manufacturers that are
 not currently registered to make drugs can register as over-the-counter manufacturers of
 alcohol-based hand sanitizers [5]; pharmacies and registered outsourcing facilities can
 compound certain alcohol-based hand sanitizers [6]; and alcohol manufacturers can produce
 alcohol for use in hand sanitizer if they follow guidance developed for industry [7]. The USP
 has also recently assembled their standards into a single collection to support hand sanitizer
 manufacturers during this COVID-19 crisis [8].

 These temporary policy changes by the FDA have greatly increased the supply of alcohol-
 based hand sanitizers on the market. However, this rise in the number of products from non-
 traditional manufacturers has also correlated with an increase in the number of products with
 identified safety and efficacy issues. Notably, several hand sanitizers have been recalled by
 the FDA for containing harmful amounts of impurities including methanol, n-propanol, and
 microbes [9]. There have also been instances where products have been found to be sub-
 potent, containing less than the recommended amount of 60 % ethanol (by volume). To help
 industry measure the levels of impurities and ethanol in their finished products, the FDA has
 also recently provided a sophisticated analytical method based on gas chromatography mass
 spectrometry [10] on their website.

 The FDA guidance provides limits for chemical impurities in raw alcohol materials [5-7],
 which have been interchangeably used as the allowable limits in finished hand sanitizer
 products [10]. The FDA limits are expressed in parts per million (ppm) and are summarized
 in Table 1. We have interpreted ppm to be mass fraction units of µg/g based on the recent
 FDA method [10], although it should be noted that the USP collection of monographs and
 standards provides limits in pure alcohol in units of µL/L [8].

 In response to the COVID-19 health emergency, the National Institute of Standards and
 Technology (NIST) has sought to support industry through the development and evaluation
 of four quantitative methods for the analysis of finished hand sanitizer products. The methods

 1
developed and evaluated by NIST include gas chromatography with flame ionization
 detection (GC-FID), liquid chromatography with ultraviolet absorbance detection (LC-UV),
 quantitative nuclear magnetic resonance spectroscopy (qNMR), and attenuated total
 reflectance Fourier-transform infrared spectroscopy (ATR-FTIR).

 Table 1. FDA Interim Limits for Impurities in Hand Sanitizers (2020) [5-7].

 Hand Sanitizer FDA Interim Limit FDA Interim Limit
 Impurity ppm (µg/g) mass %
This publication is available free of charge from: https://doi.org/10.6028/NIST.IR.8342

 acetal 50 0.005
 acetaldehyde 50 0.005
 acetone 4400 0.44
 amyl alcohol 4100 0.41
 benzene 2 0.0002
 ethyl acetate 2200 0.22
 isoamyl alcohol 4100 0.41
 isobutanol 21700 2.17
 methanol 630 0.063
 n-butanol 1000 0.1
 n-propanol 1000 0.1
 sec-butanol 6200 0.62
 ppm = parts per million

 The four methods used by NIST have been tailored toward the FDA guidance for industry,
 primarily to support non-traditional manufacturers that are making hand sanitizers for the
 first time. The methods have been used to evaluate ‘simple’ hand sanitizer formulas based on
 the FDA guidance [5,6] which is in alignment with WHO recommendations [11]. These
 formulations primarily contain the following ingredients listed in volume percent: 80 %
 denatured ethanol or 75 % isopropanol, 1.45 % glycerin, 0.125 % hydrogen peroxide, and
 water. Also, some of the methods were evaluated for more complex formulas containing
 gelling-agents that more closely resemble ‘typical’ hand sanitizers found in the marketplace.
 The NIST methods can determine and provide comparable results for ethanol, which was the
 principle disinfectant alcohol in all but one of the different hand sanitizer formulations
 evaluated in this work. All methods can also confirm the presence of other alcohols
 potentially present in significant quantities (≈ percent levels) such as isopropanol or the
 harmful impurity, methanol. Two of the methods, qNMR and GC-FID, were also able to
 determine other ingredients and impurities at the requisite sensitivity ppm levels set by the
 FDA limits.

 This NIST Internal Report (NISTIR) provides a description of each method, summary of key
 results, and a discussion of the strengths and weaknesses and applicability of each method for
 analyzing hand sanitizers.

 2
Experimental Section

 2.1. Chemicals

 For all methods except for qNMR, the ethanol measurements in the hand sanitizers were
 calibrated using either (1) solutions prepared from neat ethanol of known purity determined
 at NIST, or (2) NIST Standard Reference Material (SRM) 2899a Ethanol-Water Solution
 (Nominal Mass Fraction 25 %). The qNMR method was calibrated with NIST
 SRM 84l Potassium Hydrogen Phthalate (KHP) or dimethyl sulfone (DMSO 2) as an internal
 standard.
This publication is available free of charge from: https://doi.org/10.6028/NIST.IR.8342

 Hand sanitizers were also all evaluated for isopropanol and tert-butanol (approved
 denaturants) and the potential impurities regulated by the FDA as listed in Table 1.
 Calibrants for the ATR-FTIR method were prepared from ethanol and the reagents water,
 glycerin, and hydrogen peroxide to mimic WHO/FDA recommended hand sanitizer
 formulations. Descriptions of the chemical reagents used for this work are provided in
 Table 2. The chromatographic purities of the standards for the hand sanitizer impurity
 compounds were estimated using GC-FID at NIST and are also reported in Table 2. Other
 method-specific solvents and chemicals used for this work are included in the individual
 method summaries in Section 2.4.

 Table 2. Chemical Reagents for Hand Sanitizer Ingredients and Impurities.
 Chemical Standard Grade or Purity NIST Purity Estimated
 Compound/Reagent
 Information from Product Label by GC-FID (%)
 acetal 99% purity 98.4
 acetaldehyde Puriss, ≥ 99.5 % purity 92.7
 acetone ACS/HPLC grade 100
 amyl alcohol 99 % purity 99.0
 benzene Pesticide grade 99.9
 ethyl acetate HPLC grade 99.9
 glycerin USP grade ND
 hydrogen peroxide 3 %, USP grade ND
 isoamyl alcohol ACS grade 99.7
 isobutanol HPLC grade 99.9
 isopropanol USP grade 100
 methanol Purge and Trap grade 100
 n-butanol 99.9 % purity 99.5
 n-propanol HPLC grade; ≥ 99 % purity 100
 sec-butanol 98 % purity 99.1
 tert-butanol ACS grade ND
 water HPLC grade ND
 ND = not determined

 3
2.2. Hand Sanitizer Materials

 Hand sanitizers for this study were obtained primarily from commercial sources (both online
 and physical retail stores) over the period from April to July 2020. Exceptions included three
 materials that were provided to NIST by a local police department and two samples from
 hand sanitizer dispenser stations (one at NIST and one at a local store). A complete summary
 of the hand sanitizer materials analyzed is provided in Appendix A. Each hand sanitizer was
 given a unique sample identifier code (Sample ID) as it is NIST’s policy to not identify or
 potentially discriminate against any possible vendor. For the code, the first number indicates
 a unique brand, and the subsequent letter represents a different lot of the same brand, where
This publication is available free of charge from: https://doi.org/10.6028/NIST.IR.8342

 applicable. For one of the materials (brand 39), NIST acquired 12 bottles of the same brand
 and same lot (lot A), and each material was labeled as 39-A-1 through 39-A-12 to represent
 the different units. In total, 72 samples across 48 brands were analyzed as part of this study.
 For each hand sanitizer material, the label active ingredient was noted (typically ethyl alcohol
 or alcohol) along with the place of manufacture (if listed) and the first six inactive
 ingredients. Hand sanitizers were further visually characterized by NIST for their
 consistency – either non-gel (non-viscous) or gel. The consistency of the product impacted
 the sample preparation for the GC and LC methods, as gels tend to contain carbomer or other
 polymers that require strong acid to break the crosslinking to prevent the materials from
 fouling the instrument injection ports or columns. The information about the sample
 consistency is also provided in Appendix A. Fifty-eight of the sanitizers evaluated were
 classified by NIST as having a gel consistency and contained multiple inactive ingredients.
 The remaining 14 were characterized as non-gels and had simpler formulations, most of
 which were more consistent with the WHO/FDA recommendations.

 All hand sanitizers were screened using the ATR-FTIR method to provide a quick
 assessment of the ethanol content. Additionally, most of the hand sanitizers were analyzed
 using a qualitative NMR approach to screen for impurity compounds. Of the 72 samples, 31
 hand sanitizers (nearly half) were also selected for additional quantitative analysis primarily
 based on the following four criteria: (1) samples were obtained for analysis from a local
 (Maryland) police department; (2) samples appeared to have less than the recommended
 60 % ethanol (by volume) based on ATR-FTIR results; (3) samples appeared to have
 detectable amounts of the regulated impurities above the FDA limits based on NMR results;
 and/or (4) samples appeared to follow the simple WHO/FDA manufacturing formula. The
 hand sanitizers selected for detailed quantitative analysis based on these criteria are
 highlighted in bold font in Appendix A.

 2.3. Mass-Volume Considerations for Ethanol Mixtures

 According to the CDC guidelines, hand sanitizers should contain a minimum of 60 % alcohol
 by volume to have the proper potency for disinfection [3]. While the alcohol can be either
 ethanol or isopropanol, most hand sanitizers currently in the marketplace contain ethanol as
 the primary disinfectant, as partially evidenced by the hand sanitizers randomly purchased
 for this work (Appendix A). Of these samples, all but one hand sanitizer (Sample 44)
 contained ethanol as the primary disinfectant. Our NIST methods were therefore focused
 primarily on the reliable quantitation of ethanol in finished hand sanitizer products.

 4
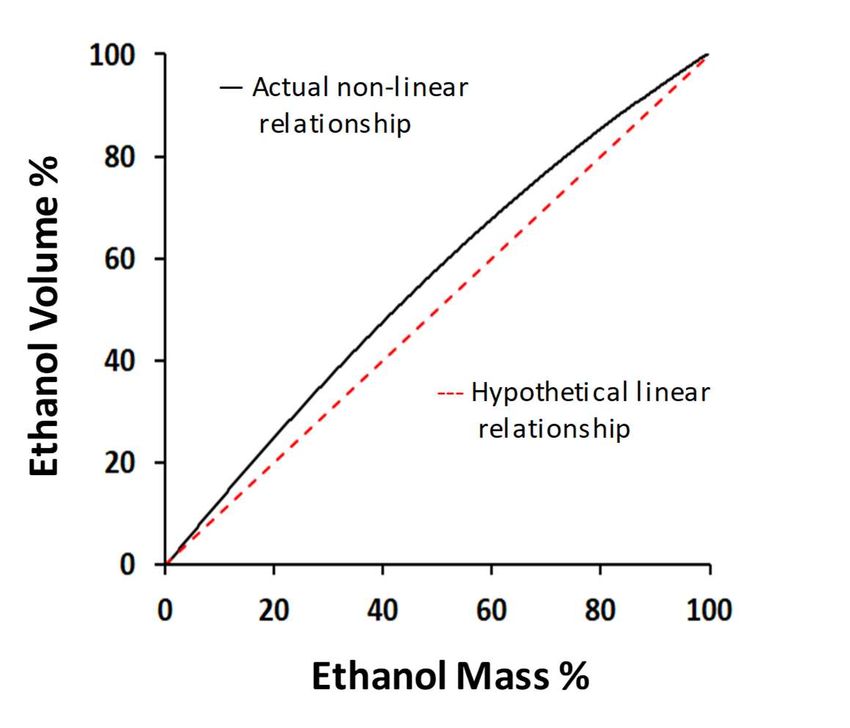
Ethanol content in hand sanitizers is generally reported in units of volume fraction or mass
 fraction in percent, which are used throughout this report and are defined as follows:

 ℎ
 (%), ℎ = × 100 (1)

 ℎ
 (%), ℎ = × 100 (2)

This publication is available free of charge from: https://doi.org/10.6028/NIST.IR.8342

 For solutions of ethanol in water, volume % and mass % are not equal to each other, and this
 reality is important to the reporting and interpretation of our measurement results. For
 ethanol and water solutions like hand sanitizers, the masses of each component combined to
 prepare the solution are additive and are linear with mass %. However, solutions made by
 mixing volumes are not additive and hence are non-linear in volume %. Thus, the
 relationship between mass % and volume % is also non-linear [12], which is graphically
 presented for simple ethanol-water mixtures as the black curve in Figure 1. Figure 1 also has
 a red dashed line for visualization purposes that corresponds to a hypothetical linear mixing
 relationship. It should be noted that the volume % for ethanol is always larger than the
 mass % except for 0 % and 100 %, corresponding to pure water and ethanol, respectively. An
 additional consideration for ethanol determinations is that volume % is temperature
 dependent, whereas mass % is not. However, this is not a major concern when working under
 controlled laboratory conditions. Using density as a proxy to represent volume changes with
 temperature, the density of a 60 % ethanol in water solution (by volume) differs by only
 0.35 % over the range from 19 °C to 23 °C [13].

 Figure 1. Relationship of volume % and mass % for ethanol in water mixtures at 20 ℃.

 5
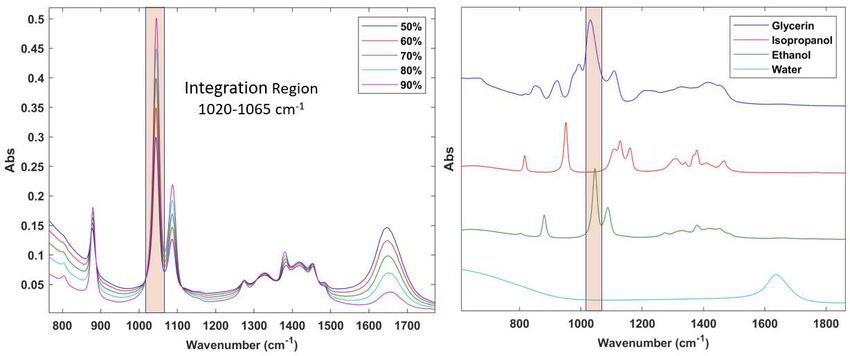
2.4. Analytical Methods

 Four different instrumental methods NMR, ATR-FTIR, GC-FID, and LC-UV were evaluated
 for their ability to determine the content of ethanol, denaturants, and impurities in hand
 sanitizers.

 For the NIST GC-FID and NMR methods, quantitation of ethanol and other components was
 performed using an internal standard approach with calibrants and samples prepared by
 mass %. The use of an internal standard effectively corrects for volume effects and provides
 the greatest quantitative accuracy when combined with mass measurements, which are not
This publication is available free of charge from: https://doi.org/10.6028/NIST.IR.8342

 subject to temperature effects or non-additive mixing behavior. Two of the methods, ATR-
 FTIR and LC-UV, utilize spectroscopic detectors that follow Beer’s law and tend to be linear
 with ethanol content in volume %. Therefore, these two methods were calibrated with known
 solutions of ethanol prepared by mass but converted to volume % as described in the
 subsequent sections.
 To compare the results for ethanol determined in hand sanitizers using the four different
 analytical methods, it was necessary to convert between ethanol content in mass % and in
 volume %, which are not equal to each other as described in Section 2.3. These conversions
 were achieved for the hand sanitizers using the density of pure ethanol and the densities of
 the individual samples, which were determined by NIST.
 Descriptions of the NIST instrumental methods and the approaches used to the estimate the
 density of the hand sanitizers are provided in the following subsections.
 2.4.1. ATR-FTIR Method

 FTIR offers a rapid analytical approach for estimating the major components in hand
 sanitizers and, when coupled with ATR, requires no sample preparation. Of specific interest
 for hand sanitizers is verifying that they contain the recommended minimum amount of
 alcohol to be effective. ATR-FTIR was utilized to screen every hand sanitizer acquired in
 this study to estimate ethanol content. A separate calibration was not developed for
 isopropanol as there was only a single hand sanitizer (Sample 44) obtained with this as the
 primary active ingredient.

 Instrumental
 A Vertex-70 FTIR spectrometer (Bruker Optics) equipped with a DuraScope (Smith’s
 Detection) ATR accessory with a single-bounce diamond element was used to analyze hand
 sanitizer samples. For this application the standard globar mid-IR source, KBr beam-splitter,
 and room temperature DLaTGS detector were used. Spectra were collected over the
 wavenumber range from 550 cm-1 to 4000 cm-1 at 4 cm-1 scanning resolution. Double-sided
 interferograms were acquired with 32 coadded scans for a total acquisition time of
 approximately 30 s. Interferograms were processed using a Blackman-Harris 3-term
 apodization function and 4X zero-filling followed by Fourier transformation. A new
 reference spectrum was typically acquired between each sample after cleaning the sample
 platform. The reference spectrum for all samples was room air (bare crystal). The
 temperature of the samples, instrument or ATR sample platform were not controlled other
 than by the lab air handling system. Lab temperature was monitored periodically during data

 6
collection and found to be consistently between 21 °C and 22 °C. All samples were
 equilibrated to lab ambient temperature in bulk before analysis.

 To minimize potential impacts from evaporation, flat bottom aluminum sample cups with
 5 mm round openings in the base were placed on the ATR stage to serve as sample reservoirs
 with a capacity of approximately 0.5 mL. While some viscous gel formulations were readily
 analyzed by deposition directly on the platform, these reservoirs were necessary for less
 viscous, non-gel hand sanitizers, which tended to spread rapidly across the stainless-steel
 platform when deposited. Data acquisition was initiated immediately after sample deposition.
 Two consecutive repeat scans, without sample replacement, were collected for each analysis.
This publication is available free of charge from: https://doi.org/10.6028/NIST.IR.8342

 Calibrants and Standards
 A series of calibration solutions for ethanol content were prepared based on the WHO/FDA
 recommendations that included only ethanol, glycerin, hydrogen peroxide, and water. The
 solution compositions were based on a volumetric target composition but prepared
 gravimetrically. Apart from water, the components were weighed into 50 mL volumetric
 flasks with target weights based on volume from established densities at 20 °C [14]. No
 density value for 3 % hydrogen peroxide could be found so the density of pure water was
 assumed. The glycerol and hydrogen peroxide targets were fixed at 1.45 % (by volume) and
 0.125 % (by volume) for all calibrants while the ethanol content was varied from 50 % to
 90 % (by volume) in 10 % intervals with the balance made up with water for a total of five
 calibration solutions. After gravimetrically adding the different components to a volumetric
 flask, water (HPLC grade) was added to volume with the mass recorded. The solution
 temperature was slightly elevated at this point due to the enthalpy of mixing. The prepared
 solutions were subsequently allowed to return to ambient temperature before the final
 addition of water to achieve the calibrated volume. The lab temperature was monitored
 during preparation of calibrants and ranged from 19 °C to 20 °C. The mass of ethanol was
 converted to volume using the density of pure ethanol at 20 °C and ratioed to the total
 solution volume to yield the ethanol content in volume % for each calibration solution.

 Quantitation
 ATR-FTIR spectra were acquired for the series of calibrant solutions to generate a calibration
 curve for ethanol content. The series of calibrants were run on several days when multiple
 hand sanitizer samples were being analyzed. The instrument configuration was not changed
 during this investigation, and the calibration was found to be very stable over time. When
 only a small number of samples were being analyzed, a single calibrant, 60 % ethanol (by
 volume), was measured as a control to check for consistency with previous calibration data.
 To identify spectral bands for calibration purposes, pure component spectra were collected
 for the constituents in the calibrant formulations and for isopropanol, which could be present
 in significant quantities in some ethanol-based formulations as a denaturant. Figure 2
 presents spectra of the five calibrants (left panel) as well as the pure component spectra of the
 constituents and isopropanol (right panel). For ethanol quantification purposes one of the C-
 O stretching bands from 1020 cm-1 at 1065 cm-1 was selected. While this band is largely free
 from isopropanol interference, glycerin has significant overlapping absorbance in this region.
 Consequently, deviations in glycerin content from 1.45 % volume, will have some impact on
 prediction accuracy.

 7
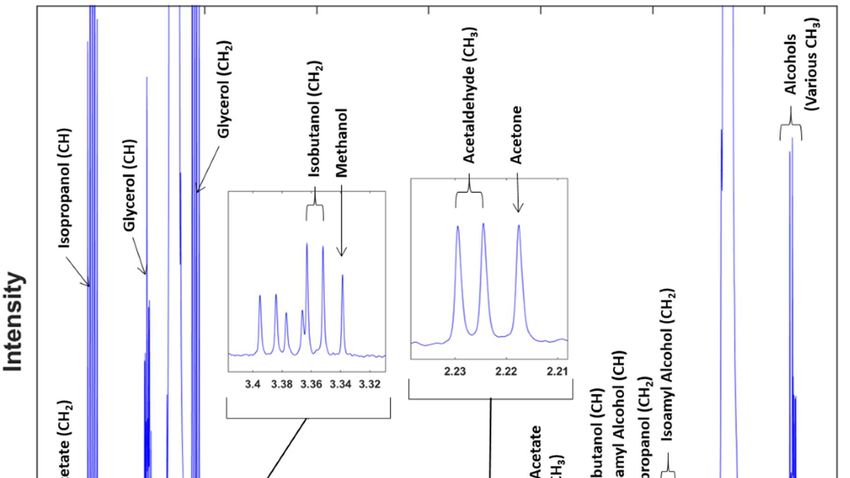
Band integrations were conducted without performing a baseline correction. A linear
 relationship was observed for ethanol content (volume %), and a calibration was performed
 by linear regression of the peak area data (ethanol volume % = 9.3863 × area - 16.8549;
 r2 = 0.9998). Since no baseline was subtracted and other components exhibit broad
 absorbances underlying this band (particularly water), a zero-intercept was not expected.
This publication is available free of charge from: https://doi.org/10.6028/NIST.IR.8342

 Figure 2. Spectra of calibrants used for the ATR-FTIR method.

 2.4.2. NMR Method

 NMR has a long history as a structure elucidation tool but is also a powerful quantitative
 analytical technique. Sample preparation is generally straightforward, and quantification of
 numerous components within a sample can be accomplished using a single reference
 compound of known purity, which can simplify method development. In this study, qNMR
 was used as a screening method to measure ethanol and other components using an internal
 standard approach. After the initial data collection for screening purposes, quantitative
 estimates of numerous impurities in many hand sanitizer samples were obtained using the
 intrinsic ethanol content in the hand sanitizers as a reference based on ATR-FTIR
 measurements. The estimates derived from this approach ultimately informed sample
 selection for further analysis by the chromatography-based techniques.

 Instrumental
 Hand sanitizer samples were analyzed using a Bruker Avance II 600 MHz NMR
 spectrometer equipped with a 5-mm broadband inverse (BBI) probe and a Sample Xpress
 autosampler. Proton NMR was used with quantitation based on an internal standard (1H-
 qNMRIS). The pulse sequence consisted of a 90-degree excitation pulse width with inverse
 gated 13C decoupling during acquisition (Bruker zgig pulse program). Typical instrumental
 acquisition parameters were the following: either 32 or 64 scans with 8 dummy scans,
 spectral sweep width of 20.0276 ppm (12019.23 Hz), 131072 complex data points, 5.45 s
 acquisition time, 45s recycle delay, 1H transmitter offset of 6.175 ppm (3706 Hz), 13C
 transmitter offset of 35.00 ppm (5281.60 Hz). Decoupling was performed using the GARP4

 8
decoupling pulse sequence with the decoupling power level reduced (to minimize sample
 heating) and the 13C transmitter offset set to effectively decouple the 13C satellites on the
 ethanol 1H peaks, which obscured minor components and impurities. All NMR experiments
 were performed at a sample temperature of approximately 25 °C.

 Calibrants and Samples
 Glassware used during sample preparation was rinsed with organic solvents and distilled
 water and placed in an oven at 110 °C prior to use. All samples were prepared as dilutions in
 deuterium oxide (D2O; Cambridge Isotope Laboratory, DLM-4-25, D-99.9%). For
 quantitative measurements based on addition of an internal standard, the calibrant used was
This publication is available free of charge from: https://doi.org/10.6028/NIST.IR.8342

 either KHP or DMSO2. For KHP, internal standard stock solutions were prepared by
 weighing 0.5 g of KHP and 25 g of D2O gravimetrically into a 50 mL vial and thoroughly
 mixing. When DMSO2 was used, individual samples were prepared by weighing 10 mg to 20
 mg into sample vials followed by addition of 1 mL of D 2O. The use of DMSO2 was
 investigated after a precipitate was observed in a small number of samples in the presence of
 KHP. The sample constituents causing this effect were not investigated.

 A total of 18 hand sanitizer samples were measured using an internal standard added for
 quantitative analysis. For most hand sanitizers, samples were analyzed without addition of an
 internal standard, and the content of minor components and impurities were estimated
 retrospectively by using the 1H ethanol peak areas as the internal standard based on the
 intrinsic ethanol content of the hand sanitizer. This required an external estimate of ethanol
 content in the sample, which resulted from the ATR-FTIR analysis of the hand sanitizer.

 Hand sanitizer samples (30 mg to 100 mg) were weighed directly into 1.85 mL screw top
 (PTFE lined) glass sample vials already containing 1 mL of D 2O (with or without internal
 standard) and immediately sealed to minimize loss of any volatile components. After
 weighing, samples were vortex mixed and inspected to ensure complete mixing and
 dissolution. Depending on the viscosity of the hand sanitizer formulation, this process was
 repeated several times to ensure complete dissolution. In some gel formulations, the solution
 remained slightly turbid after mixing. Approximately 1 mL of sample was transferred into
 clean 600 MHz NMR tubes (Wilmad WG-1000-7-SJ, 5 mm diameter, 178 mm long).

 For compound identification and peak assignment purposes, hand sanitizer spectra were
 compared to available spectral data of ingredients and potential impurities from various
 sources and then confirmed by comparisons to spectra of known standards. For these
 comparisons, samples of pure reference compounds of hand sanitizer ingredients and
 impurities (Table 2) were prepared by placing small quantities into D 2O (Cambridge Isotope
 Laboratory, DLM-4-25, D-99.96% with 0.01 mg/mL DSS). These were typically prepared by
 transferring a small drop by glass pipette into the solvent ampoule containing 0.7 mL D 2O,
 mixing, and then transferring into an NMR tube for analysis.

 Quantitation
 For quantitative measurements, the mass % of the primary chemical components (e.g.,
 ethanol, isopropanol) or the levels of the impurities in the hand sanitizer samples, were
 calculated using the following equation:

 9
 mass % = × × × × (3)

 where,
 c = chemical component being determined
 C = multiplicity (# H atoms/peak) of the chemical component spectral peak
 I = multiplicity (# H atoms/peak) of the internal standard peak
 C = relative molar mass (molecular weight, g/mol) of the chemical component
 = relative molar mass (molecular weight, g/mol) of the internal standard
This publication is available free of charge from: https://doi.org/10.6028/NIST.IR.8342

 C = integrated area of the chemical component peak
 = integrated area of the internal standard peak
 HS = mass (g) of the hand sanitizer material
 = mass (g) of the internal standard
 = purity (mass %) of the internal standard

 The internal standard was KHP, DMSO2, or the intrinsic ethanol content in the hand sanitizer
 sample. For KHP, all aromatic protons were integrated together. For DMSO 2 the single peak
 was used. For ethanol, the -CH3 and -CH2- peaks were integrated separately. When glycerin
 was present in the sample, 2 proton signals are completely obscured beneath the ethanol -
 CH2- quartet. The ethanol integration was corrected for this interference by subtracting area
 counts based on the estimated glycerin content from one or both remaining peaks. Similarly,
 the isopropanol -CH3 peak is highly overlapped with the ethanol -CH3 peak, and a correction
 for this was made from an estimate of isopropanol content from the -CH- peak. After any
 required corrections for underlying peaks or other nearby impurity peaks, the areas of the two
 ethanol peaks were checked for consistency and used together to estimate the ethanol content
 or to serve as the internal standard peak area for estimating impurity content. For most
 impurities, mass % results were converted to ppm (µg/g) to be consistent with FDA
 guidance.

 2.4.3. GC Methods

 Capillary GC has high selectivity and sensitivity for characterizing alcohols and impurity
 compounds [8,10] and was used for the analysis of hand sanitizers. FID was selected as the
 predominant detection method for GC because it is simple to operate, robust, and provides
 excellent quantitative reproducibility. Additional qualitative measurements were conducted
 combining GC with mass spectrometric (MS) detection for identifying impurities in hand
 sanitizer samples.

 2.4.3.1. GC-FID

 Instrumental
 GC-FID was used to analyze and quantitate alcohols and impurities in the hand sanitizer
 samples. Two separate GC-FID methods were developed to analyze ethanol or isopropanol,
 the active ingredients in the hand sanitizers that are present in the high percent range, and for
 impurities that may be present in the low µg/g (ppm) range. The gas chromatograph used in

 10
both methods was an Agilent 7890A equipped with an autosampler and an FID detector. An
 RXI-1301 Sil MS column (Restek, Bellefonte, PA) with dimensions 60 m x 250 µm x 1 µm
 df (film thickness) was used. Helium was used as the carrier gas at a flow rate of 1 mL/min.
 For both methods the FID temperature was set at 250 °C. The hydrogen, air and makeup gas
 (nitrogen) for the detector were set to 34 mL/min, 375 mL/min, and 29 mL/min, respectively.

 For the determination of ethanol or isopropanol, the initial oven temperature was set to 40 °C
 for 1 min before ramping to 250 °C at a rate of 10 °C/min. The final oven temperature was
 held for 10 min for a total run time of 32 min. The injection port temperature was 250 °C and
 a split liner (4 mm internal diameter) was used containing a silanized glass wool plug. A
This publication is available free of charge from: https://doi.org/10.6028/NIST.IR.8342

 sample size of 0.4 µL was injected using a 10 µL syringe into a split/splitless injector with a
 split ratio of 100:1.

 For the analysis of the impurities in the hand sanitizers, the initial oven temperature was set
 to 40 °C for 1 min before ramping to 250 °C at a rate of 5 °C/min. The final oven
 temperature was held for 5 min for a total run time of 48 min. The injection port temperature
 was 275 °C and a split liner (4 mm internal diameter) was used containing a silanized glass
 wool plug. A sample size of 0.4 µL was injected using a 10 µL syringe into a split/splitless
 injector with a split ratio of 50:1.

 Calibrants and Samples
 For determining ethanol content in non-gel hand sanitizers, samples were prepared
 gravimetrically by diluting 250 µL of hand sanitizer and 250 µL of an internal standard
 solution in 50 mL of water. The internal standard solution consisted of 60 % - 80 % (by
 mass) n-propanol or acetonitrile in water. For gel hand sanitizers, samples were also prepared
 gravimetrically as described, but 5 µL of concentrated HCl was added to the hand sanitizer
 sample and internal standard mixture to break the polymer crosslinking in the samples prior
 to dilution with water.

 Calibration solutions for ethanol determinations were gravimetrically prepared in water from
 neat ethanol with known purity assessed at NIST for recent measurements using GC-FID and
 Karl Fischer analysis. For some analyses, the calibration solutions also included standards of
 neat methanol and isopropanol with purity estimated by GC-FID for this work (Table 2). For
 each measurement set, four to six independent calibrants were gravimetrically prepared that
 bracketed the anticipated alcohol content of the samples by combining 150 - 250 µL of
 alcohol with 250 µL of the same internal standard solution that was added to the hand
 sanitizer samples (60 % - 80 % by mass n-propanol or acetonitrile) in 50 mL of water.

 For determination of impurity content in non-gel hand sanitizers, samples were prepared
 gravimetrically by combining 100 µL of an internal standard solution with 1 mL of a hand
 sanitizer sample. The internal standard solution was gravimetrically prepared by diluting
 300 µL of acetonitrile in 50 mL of dimethyl sulfoxide (DMSO) to yield a ≈ 4000 µg/g (ppm)
 solution. For gel hand sanitizers, 0.5 µL of concentrated HCl was added to the hand sanitizer
 sample and internal standard to break the polymer crosslinking in the samples. After the
 addition of concentrated HCl, the solution was vortex mixed. If the hand sanitizer solution
 did not liquify, then an additional 0.5 µL of HCl was added.

 11
Impurities in the hand sanitizer samples were identified by comparing chromatographic
 retention times with standards prepared from neat chemicals, and the impurity content was
 estimated based on responses of the calibrants. For calibration of the chemical impurities in
 hand sanitizers, three independent mixed stock solutions were first prepared using neat
 chemicals with purity determined by GC-FID (Table 2) and DMSO as the solvent. Table 3
 indicates the target volume of each impurity standard and DMSO that was added to prepare
 the stock solutions. Even though the solutions were prepared using volume targets, the
 masses were recorded to obtain the mass fraction of the impurities in each of the three stock
 solutions as listed in Table 3, which included correction for the purity of the neat chemicals.
 Nine additional intermediate stock solutions were gravimetrically prepared from the three
This publication is available free of charge from: https://doi.org/10.6028/NIST.IR.8342

 independent stock solutions using appropriate dilutions with DMSO as the solvent to achieve
 a wide range in levels (also listed in Table 3). Finally, calibration solutions were prepared
 gravimetrically by adding 100 µL of an internal standard solution (acetonitrile in DMSO
 described above) to 1 mL of an intermediate stock solution except for the highest-level
 intermediate stock solution, which was only used to prepare lower level intermediate stock
 solutions. Table 4 lists the final range of impurity levels (µg/g) in the calibration solutions
 used for quantitation.

 Table 3. Preparation of stock and intermediate stock solutions for impurity compound
 analysis by GC-FID.
 Impurities and Target volume Nominal Nominal mass
 solvent for preparation mass fraction fraction range of
 of high-level (%) of high- intermediate-level
 stock solutions level stock stock solutions
 (µL) solutions (µg/g)
 DMSO (solvent) 3250 NA NA
 Isobutanol 3000 27 45 to 95000
 sec-Butanol 900 7.8 13 to 28000
 Isoamyl 600 5.2 9 to 19000
 alcohol
 Amyl alcohol 600 5.2 9 to 19000
 Acetone 600 5.2 9 to 16000
 Ethyl acetate 300 2.8 5 to 9800
 n-Butanol 150 1.3 2 to 4500
 n-Propanol 150 1.3 2 to 4500
 Methanol 150 1.2 2 to 4400
 Benzene 100 0.9 2 to 3300
 Acetal 100 0.9 2 to 3000
 Acetaldehyde 100 0.4 1 to 1200
 NA = not applicable (dilution solvent)

 12
Quantitation
 The mass % of ethanol (also methanol and isopropanol in some samples) was determined
 using the average response factor (RF) of four to six calibrants. The RFs were determined
 using calibrants and were calculated using the following equation:

 = (4)

 where,
 As = area of the alcohol
This publication is available free of charge from: https://doi.org/10.6028/NIST.IR.8342

 AIS = area of the internal standard
 Cs = mass % of alcohol
 CIS = mass % of the internal standard

 After the RF was determined from the calibrants, the same equation was used to determine
 the mass % (CS) in the diluted hand sanitizer samples. Finally, the mass % of the hand
 sanitizer was calculated by multiplying the mass % of the diluted hand sanitizer by the
 dilution factor.

 For the analysis of hand sanitizer samples using the simple, non-gel WHO/FDA
 formulations, four independently prepared calibrants were prepared using n-propanol as the
 internal standard. The RFs that were generated from the four calibrants were comparable, and
 the percent relative standard deviation (%RSD) of the average RF was low (0.32 % RSD).
 The average RF of the calibrants was used for quantifying the samples (RF of 1.063).
 Quantitation of alcohol in gel hand sanitizers were performed in the same manner as the
 WHO/FDA formulations. The average response factor (0.9748 with 0.39 % RSD) was used
 to quantitate samples obtained from six independently prepared calibrants with acetonitrile as
 the internal standard.

 The impurities were quantified using a calibration curve constructed from the ratio of the
 impurity to internal standard peak areas versus the ratio of the impurity to internal standard
 levels in µg/g (ppm). Linear regression with a non-zero intercept was used. At least one
 calibrant prepared from each of the three independently prepared stock solutions were
 incorporated in the calibration curve. When possible, calibrant levels that bracketed the range
 of the FDA interim limits for the individual impurities were used. In some cases, the impurity
 content of a hand sanitizer sample was outside of the calibration range; in these cases, the
 value was marked indicating it was outside the calibration range. Table 4 lists the calibration
 curve information, including linear regression slope and intercept, and the calibration range
 for the impurities in the hand sanitizer samples. The limits of detections (LODs) are defined
 here as the lowest calibration point detected. For most impurities, this was a calibrant
 prepared about ten times lower that the lowest calibration point used for quantitation.

 13
Table 4. Calibration curve information for the impurities quantified by GC-FID.
 LOD
 Impurity Calibration Range (µg/g) m b r2 (µg/g)
 Acetaldehyde 9-474 0.59 0.0046 0.9992 8.1
 Methanol 29-1154 0.66 0.0063 1.0000 2.0
 Acetone 121-4797 0.98 -0.0028 1.0000 9.2
 n-Propanol 31-1277 1.24 -0.0056 0.9999 2.0
 Ethyl acetate 67-2936 0.85 -0.0060 1.0000 4.7
 sec-Butanol 185-7935 1.27 -0.0201 0.9999 13.4
This publication is available free of charge from: https://doi.org/10.6028/NIST.IR.8342

 Isobutanol 622-27124 1.47 -0.0570 0.9999 45.9
 Benzene 22-886 2.17 -0.0069 0.9999 1.6
 n-Butanol 31-1378 1.36 -0.0067 0.9999 2.2
 Acetal 22-896 1.03 -0.0033 0.9999 1.5
 Isoamyl alcohol 123-5299 1.50 -0.0170 0.9998 8.9
 Amyl alcohol 125-5307 1.48 -0.0238 0.9998 9.0
 m = slope of linear regression; b = intercept of linear regression; r 2 = coefficient of determination of linear
 regression; LOD = Limit of Detection

 2.4.3.2. GC-MS

 GC-MS was used for qualitative analysis of the hand sanitizer samples to identify unknown
 impurities, primarily through spectral matching to the NIST Library and by retention time
 matching of select calibrants that were prepared for GC-FID analysis.

 Instrumental
 GC-MS was used to confirm the identity of the impurities in select hand sanitizer samples.
 The instrument used was an Agilent 7890A gas chromatograph equipped with an
 autosampler coupled with an Agilent 5975c inert XL mass select detector. A J&W Scientific
 DB-624 UI column with dimensions 60 m x 250 µm x 1.4 µm d f (film thickness) was used.
 Helium was used as the carrier gas and was maintained at a constant flow rate of 1 mL/min.
 The MS source and quadrupole temperatures were set at 230 °C and 150 °C, respectively.
 The MS was operated in scan mode between the mass to charge (m/z) range of m/z 29 to
 m/z 200. To protect the lifetime of the filament, the ion source and detector were turned off
 when ethanol (3.10-3.5 min) and DMSO (23-28 min) were eluting.

 The initial oven temperature was set to 40 °C for 5 min before ramping to 65 °C at a rate of
 2 °C/min. After reaching 65 °C, the oven was ramped to 240 °C at a rate of 10 °C/min. The
 final oven temperature was held for 10 min for a total run time of 45 min. The injection port
 temperature was 250 °C, and a split liner (4 mm internal diameter) was used containing a
 silanized glass wool plug. A volume of 0.4 µL was injected using a 10 µL syringe into a
 split/splitless injector with a split ratio of 50:1.

 Calibrants and Samples
 The calibration solutions and hand sanitizer samples for the qualitative GC-MS analyses
 were the same as prepared and described for the GC-FID measurements.

 14
2.4.4. LC-UV Method

 Ethanol and isopropanol, as well as the harmful impurity methanol, have modest absorbance
 at 200 nm. Thus, it was possible to develop a LC method with absorbance detection to
 identify and determine these alcohols in hand sanitizer products. However, LC-UV is not
 very sensitive and was only able to detect these alcohols at low percent levels. In addition,
 many of the other regulated impurities are also not strong UV absorbing compounds, so LC-
 UV was not suitable for their detection in the µg/g (ppm) range.

 Instrumental
This publication is available free of charge from: https://doi.org/10.6028/NIST.IR.8342

 The LC system was comprised of a temperature-controlled autosampler and column
 compartment, binary pump, solvent degasser, and a fixed-wavelength UV detector. The
 method utilized a Phenomenex C18-2 with 5 µm particles and 100 Å pore size of dimensions
 250 mm (length) x 4.6 mm (internal diameter). The column was maintained at a temperature
 of 15 °C. Isocratic elution was used with a binary mobile phase comprised of 95 % water, 5
 % acetonitrile (vol/vol) at a flow rate of 1.0 mL/min to separate the three target alcohols. The
 total chromatographic analysis time was 10 min. Detection was by UV absorbance at 200
 nm. Samples were placed in the temperature-controlled autosampler compartment
 maintained at 5 °C. Injection volumes of 1 µL were used to minimize peak tailing as well as
 fouling of the column by gel hand sanitizers. All chromatographic peak areas were
 determined by manual integration.

 As most of the gel hand sanitizers have potential ingredients with greater retention than the
 alcohols, it was necessary to include a column flush cycle after the analysis of each gel
 sample. This was accomplished by injection of 100 µL of methanol in conjunction with this
 isocratic separation. The flow rate was lowered to 0.2 mL/min for 2 min and then the 1.0
 mL/min flow rate was resumed. A total chromatographic analysis time of 12 min was used
 for the flush cycle.

 Calibrants and Samples
 Calibrants were prepared by diluting neat standards of individual alcohols with water
 gravimetrically to mass percentages encompassing the levels expected in the hand sanitizers
 of 40 % to 80 % (by mass). In addition, SRM 2898, nominally 25 % (by mass) ethanol, was
 included in the calibration. Five ethanol calibrants were used for ethanol determination.
 Calibrants for methanol and isopropanol measurements were prepared at three levels
 covering the range of approximately 10 % to 50 % (by mass). Although prepared
 gravimetrically, the content of the ethanol and isopropanol calibration solutions were
 subsequently converted from mass % to volume % as will be discussed.

 Hand sanitizer samples with non-gel consistency were analyzed directly after transfer to a
 2-mL autosampler vial. Hand sanitizers with a gel consistency required additional sample
 preparation. A 2-mL autosampler vial with a cap was weighed and approximately 1 mL of
 hand sanitizer sample was transferred using a gas-tight syringe. The vial with cap and
 contents was weighed again. Next, 3 µL of concentrated HCl was added to the sample to
 break the crosslinking of the gelling agent and produce a sample with much lower viscosity.
 The vial, cap, hand sanitizer sample, and HCl was weighed again. The vial was vortex mixed

 15
You can also read