A COVID 19 vaccination model for Aotearoa New Zealand
←
→
Page content transcription
If your browser does not render page correctly, please read the page content below
www.nature.com/scientificreports
OPEN A COVID‑19 vaccination model
for Aotearoa New Zealand
Nicholas Steyn1,2,3, Michael J. Plank1,3*, Rachelle N. Binny1,4, Shaun C. Hendy1,2,
Audrey Lustig1,4 & Kannan Ridings1,2
We develop a mathematical model to estimate the effect of New Zealand’s vaccine rollout on the
potential spread and health impacts of COVID-19. The main purpose of this study is to provide a
basis for policy advice on border restrictions and control measures in response to outbreaks that may
occur during the vaccination roll-out. The model can be used to estimate the theoretical population
immunity threshold, which represents a point in the vaccine rollout at which border restrictions and
other controls could be removed and only small, occasional outbreaks would take place. We find that,
with a basic reproduction number of 6, approximately representing the Delta variant of SARS-CoV-2,
and under baseline vaccine effectiveness assumptions, reaching the population immunity threshold
would require close to 100% of the total population to be vaccinated. Since this coverage is not likely
to be achievable in practice, relaxing controls completely would risk serious health impacts. However,
the higher vaccine coverage is, the more collective protection the population has against adverse
health outcomes from COVID-19, and the easier it will become to control outbreaks. There remains
considerable uncertainty in model outputs, in part because of the potential for the evolution of new
variants. If new variants arise that are more transmissible or vaccine resistant, an increase in vaccine
coverage will be needed to provide the same level of protection.
COVID-19 was first detected in Wuhan, China in late 2 0191, before spreading globally to become a pandemic
in March 20202. New Zealand adopted an elimination approach early in the pandemic3 and, as a result, has
experienced significantly lower cumulative incidence of cases and deaths than many other countries4. Strict
border controls have been implemented to keep the virus out, including complete closure to most non-residents,
and mandatory government-managed quarantine on arrival for those allowed to enter. Although this has been
largely successful in preventing community transmission of COVID-19, 10 border-related re-incursions were
detected in the period up to 31 March 20215. However, with the development of effective vaccines, widespread
vaccination could allow these border restrictions to be safely relaxed.
New Zealand’s vaccination programme began in February 2021 and almost exclusively uses the two-dose
Pfizer/BioNTech BNT162b2 mRNA vaccine6. On 10 March 2021, the New Zealand government published their
vaccine roll-out p lan7, which identified four successive groups for vaccination: (1) 50,000 frontline border work-
ers, managed isolation and quarantine (MIQ) staff, and their household contacts; (2) 480,000 frontline health
workers and people in high-risk settings; (3) approximately 1.7 m priority individuals, primarily those in older
age groups; (4) the remainder of the general population aged 16 + (approximately 2 m people). In August 2021,
the age of eligibility was reduced to 12 years. As of mid December 2021, 94% of the eligible population have
received at least one dose and 90% are fully vaccinated.
Quantifying the effect of the vaccine roll-out on the population-level risk of severe health outcomes and on
the degree of population immunity is critical for informing the response to future border-related outbreaks and
decisions about when and how to relax border restrictions. Evidence suggests the Pfizer/BioNTech BNT162b2
mRNA vaccine is highly effective against mild and severe COVID-19, with efficacy against disease from stage
three clinical trials reported to be 95% (90.3%, 97.6%)8. Data from Israel9, a country with high vaccination rates,
suggests an effectiveness against mild disease of 94% (87%, 98%) and an effectiveness against severe disease of
92% (75%, 100%). The same study also found high effectiveness against documented infection with SARS-CoV-2
of 92% (88%, 95%), suggesting similar effectiveness against t ransmission10.
Since late 2020, several SARS-CoV-2 variants of concern have been identified that are more transmissible and/
or more resistant to v accines11. The Alpha (B.1.1.7) variant, which became dominant in the UK in early 2021, is
estimated to be 43–90% more transmissible than ancestral SARS-CoV-212. The Delta (B.1.617.2) variant, which
1
Te Pūnaha Matatini: the Centre for Complex Systems and Networks, Auckland, New Zealand. 2Department of
Physics, University of Auckland, Auckland, New Zealand. 3School of Mathematics and Statistics, University of
Canterbury, Christchurch, New Zealand. 4Manaaki Whenua, Lincoln, New Zealand. *email: michael.plank@
canterbury.ac.nz
Scientific Reports | (2022) 12:2720 | https://doi.org/10.1038/s41598-022-06707-5 1
Vol.:(0123456789)
www.nature.com/scientificreports/
was first identified in India and subsequently displaced the Alpha variant in the UK to become dominant in mid
2021, has a secondary attack rate that is approximately 40% higher than A lpha13. The effectiveness of the Pfizer/
BioNTech vaccine after 2 doses against symptomatic disease has been estimated to be around 88% for the Delta
variant, compared to around 93% for Alpha14. This suggests that there is limited reduction in vaccine effective-
ness for Delta after two doses (although the same study showed a bigger reduction in effectiveness after only
one dose). Effectiveness against hospitalisation and mortality remains high against Delta, with Public Health
England estimating 96% effectiveness against h ospitalisation15.
While we do not consider specific variants in this work, we present results for three values of the basic repro-
duction number R0 = 3.0, 4.5, and 6.0. These are broadly reflective of spread of the original variant of SARS-
CoV-2, the Alpha variant, and the Delta variant respectively. However, there is uncertainty as to the exact value
of R0 for the Delta variant in particular, and these three values should be interpreted as a range of low, medium
and high transmission scenarios. While there is considerable uncertainty in vaccine effectiveness, our baseline
assumptions are chosen to best represent the current understanding of the vaccine’s effect on the Delta variant
after two doses.
We develop an age-structured vaccination model that we implement in two ways: (A) a deterministic SEIR
model; and (B) a stochastic branching process model. The former is intended to analyse population-level dynam-
ics and is similar to other SEIR models developed for COVID-1916,17. The latter is intended to analyse small-scale
outbreaks where stochasticity plays an important role and is similar to our previous branching process model
for COVID-19 s pread18,19. This builds on earlier models used to inform the response to previous outbreaks of
COVID-19 in New Zealand19,20 by incorporating the effects of vaccination, age-structured contact rates, and
contact tracing. This paper does not present new empirical data, but the model assumptions and parameter
estimates are informed by previously published data from New Zealand and international studies.
The primary objective of this paper is to develop a model that can be used to understand the potential impacts
of COVID-19 at various stages in the vaccine roll-out and inform a range of policy questions. The model does
not yet account for heterogeneity of vaccine coverage, inequities in health outcomes for different g roups21, or
waning of immunity over time. Extensions to the model to account for these will be necessary in future work.
Results
Effect of vaccination on transmission potential. We investigate potential outcomes of an epidemic
occurring at different stages in the vaccine roll-out (Fig. 1). A key aim of national vaccination programmes is to
vaccinate enough people that the effective reproduction number is below 1 without the need for other interven-
tions. The proportion of the population that need to be vaccinated to achieve this is known as the population
immunity threshold. In this section, we estimate the reproduction number Rv at different stages in the vaccine
roll-out and predict the vaccination coverage required to reach the population immunity threshold.
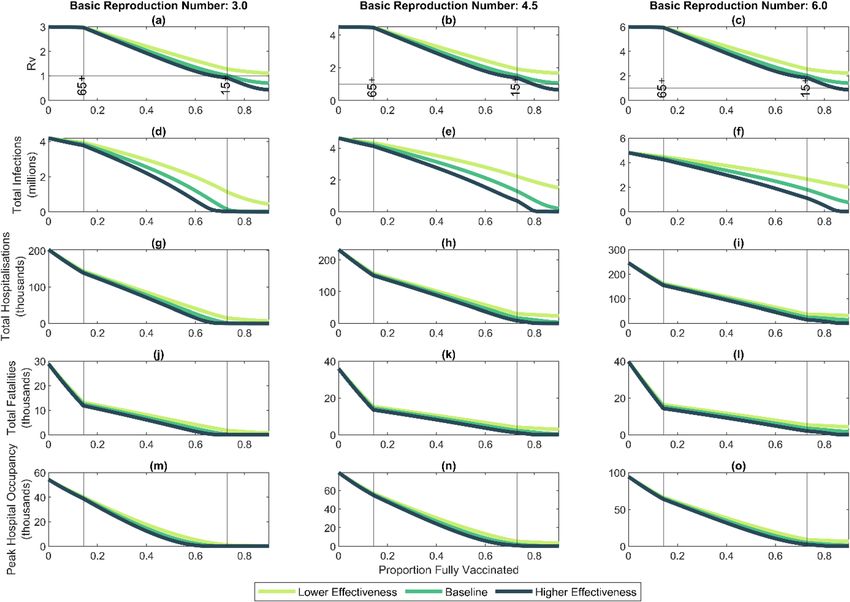
With an assumed basic reproduction number of R0 = 3 before vaccination, reaching the population immu-
nity threshold ( Rv < 1) requires vaccinating 74% of the total population including children under baseline
vaccine effectiveness assumptions, and 68% under the high effectiveness assumptions (Table 1, Fig. 1a). Under
lower effectiveness parameters, the population immunity threshold cannot be reached. Similar results have been
found for Australia22 and the UK23. With an assumed basic reproduction number of R0 = 4.5 before vaccination,
reaching the population immunity threshold under baseline effectiveness assumptions requires vaccinating 91%
of the total population (Fig. 1b). Even under the higher effectiveness assumption, vaccination of a significant
proportion of under 15-year-olds is needed to reach the population immunity threshold. With an assumed basic
reproduction number of R0 = 6.0 before vaccination, the population immunity threshold would require almost
100% vaccine coverage in the baseline scenario, and would require vaccination of under-15-year-olds even in
the higher effectiveness scenario (Fig. 1c).
The first stage of the vaccine roll-out, where older age groups are vaccinated, does not substantially reduce
the effective reproduction number at an overall population level (Fig. 1a–c). These age groups have lower contact
rates than other age groups, so contribute a relatively small amount to overall transmission. These groups are
at greatest risk of severe health outcomes, however, so vaccinating them is expected to substantially reduce the
potential morbidity and mortality if a large outbreak were to occur (see below).
The vaccine coverage required to reach the population immunity threshold for different values of R0 and under
the three vaccine effectiveness scenarios are shown in Table 2 and Fig. 2. Under the baseline vaccine effective-
ness assumptions, the maximum value of the basic reproduction number for which population immunity can be
achieved with 90% coverage of over 15-year-olds is R0 = 2.9. If R0 is between 3.0 and 4.3, population immunity
can be achieved with 90% coverage of the whole population. If R0 is above 4.3 (which is likely for the Delta variant
of concern24), population immunity cannot be achieved under baseline vaccine assumptions without a vaccine
coverage of more than 90% of the whole population.
Open borders scenario. To model the effect of relaxing border restrictions, which currently require
14 days of quarantine for all international arrivals from outside a safe travel zone, we assume there are five
non-vaccinated imported cases per day. This is a counterfactual scenario in which no interventions are made to
control the epidemic beyond vaccination. This does not mean that the number of hospitalisations and fatalities
reported below would be expected to occur, but it demonstrates that, under these scenarios, a significant public
health response would still be needed to prevent a major epidemic and the associated health impacts.
We run the deterministic SEIR implementation for two years (730 days) in a population with either 90%
vaccination coverage across all age groups, or 90% vaccination coverage across over 15-year-olds. If the model
is run for a longer time period, more cases, hospitalisations, and fatalities occur, even if Rv < 1. The choice of
five imported non-vaccinated infected individuals per day is arbitrary and, over the two-year simulation, equates
Scientific Reports | (2022) 12:2720 | https://doi.org/10.1038/s41598-022-06707-5 2
Vol:.(1234567890)
www.nature.com/scientificreports/
Figure 1. High vaccine coverage greatly reduces potential morbidity and mortality but, for a highly
transmissible variant (R0 = 6), population immunity is unlikely to be achieved via vaccination alone: (a–c)
effective reproduction number Rv after vaccination; (d–f) total infections; (g–i) total hospitalisation; (j–l)
total fatalities; (m–o) peak hospital occupancy for an unmitigated epidemic over a two-year period as a
function of total vaccine courses administered, assuming there is no further vaccination after the outbreak
begins. Results are shown for three values of the basic reproduction number: R0 = 3.0, R0 = 4.5, R0 = 6.0.
Along the horizontal axis, the roll-out begins in the 65 + year-old age group; once 90% of the 65 + year old
group is vaccinated (left-hand vertical line), vaccination of the 15–64-year-old group begins; once 90% of the
15–64-year-old group is vaccinated (right-hand vertical line), vaccination of the under 15-year-old age group
begins. Vaccine effectiveness assumptions as shown in Table 1.
Effectiveness Baseline (%) Lower effectiveness (%) Higher effectiveness (%)
Against infection (eI ) 70 50 90
Against transmission given infection (eT ) 50 40 50
Against disease given infection (eD ) 80 80 80
Implied overall transmission reduction 85 70 95
Implied overall protection against severe disease 94 90 98
Table 1. Vaccine effectiveness parameters. These are chosen to reflect estimates of the effectiveness of the
Pfizer-BioNTech mRNA vaccine after 2 doses24. The lower effectiveness parameters represent a potential SARS-
CoV-2 variant of concern that partially evades immunity provided by the Pfizer vaccine. See Supplementary
Information sec. 3 for more details. The overall reduction is transmission is given by 1 − (1 − eI )(1 − eT ), and
the overall protection against severe disease is 1 − (1 − eI )(1 − eD ).
to approximately 2500 symptomatic cases, 200 hospitalisations, and 35 fatalities among imported cases, inde-
pendent of vaccine effectiveness and coverage, and the assumed basic reproduction number R0. To focus on the
effects of community transmission, we do not include imported cases in the results presented below. Other case
importation rates are tested in Supplementary Information sec. 2.5.
Scientific Reports | (2022) 12:2720 | https://doi.org/10.1038/s41598-022-06707-5 3
Vol.:(0123456789)www.nature.com/scientificreports/
Baseline Lower effectiveness Higher effectiveness
Vaccine effectiveness eI = 70%, eT = 50% eI = 50%, eT = 40% eI = 90%, eT = 50%
R0 = 3.0 74% 95%* 68%
R0 = 4.5 91%* – 80%
R0 = 6.0 98%* – 85%
Table 2. Population immunity threshold estimates for each vaccine effectiveness scenario at three different
values of R0. Estimates assume a structured roll-out, beginning in 65 + year-olds, then 15–64 year-olds, and
finally under 15-year olds, with up to 90% of each group vaccinated. Estimates with an asterisk are greater than
90% and assume equal coverage in all age groups.
Figure 2. Number of vaccinated individuals required to reach the population immunity threshold (i.e. Rv = 1)
for varying values of R0 under the same age-prioritised roll-out sequence and maximum 90% coverage as in
this figure. Points above the thin horizontal line require vaccination of under 15-year-olds. Vertical dotted lines
indicate the largest value of R0 for which the population immunity threshold can be reached with 90% coverage
of over 15-year-olds. Vertical dashed lines indicate the largest value of R0 for which the population immunity
threshold can be reached with 90% coverage of the total population.
With vaccine coverage of 90% of the over 15-year-old age groups and an assumed value of R0 = 3.0 before
vaccination, we found that Rv = 1.02 under baseline vaccine effectiveness parameters. This is slightly above the
population immunity threshold, so each imported infection leads to many local cases, and there are substantial
health impacts in this scenario (Table 3). Even in the higher effectiveness scenario, Rv = 0.93, so each imported
infection still leads to multiple local cases, and the health impacts are non-negligible. This highlights the impor-
tance of increasing vaccination coverage even if population immunity is achieved.
For scenarios with higher values of R0, which are more likely for the Delta variant, vaccinating 90% of over
15-year-olds is not sufficient to bring Rv near or below 1, meaning that there is the potential for a self-sustaining
epidemic wave to occur resulting in large numbers of hospitalisations and fatalities. Corresponding results with
a vaccine coverage of 90% of the whole population including children are shown in Table 4.
In all scenarios, a significant proportion of infections, hospitalisations and deaths occur in vaccinated indi-
viduals, which is the expected outcome when vaccine coverage is high and effectiveness is less than 100%. This
demonstrates the need for continued testing and other public health measures to be directed at vaccinated as
well as non-vaccinated individuals.
Figure 1d–o show the number of infections, hospitalisations and fatalities in an unmitigated epidemic at
different stages in the vaccine roll-out sequence. Although vaccinating older age groups first does not greatly
reduce in the total number of infections, it does lead to a sharper reduction in hospitalisations and fatalities.
These scenarios assume that the vaccination programme ceases once the outbreak begins and so they represent
the potential effect of opening the border once a certain number of individuals are fully vaccinated.
Control of border‑related outbreaks. In this section, we use the stochastic branching process imple-
mentation of the model to simulate outbreaks seeded by a single infected case. The results from these simulations
can be interpreted as the expected number of community cases per fully infectious case arriving at the border.
We consider four outputs: the number of infections when an outbreak is first detected; the probability that an
outbreak eliminates before it reaches 1000 cumulative infections, without population-level interventions; the
time from detection until elimination, defined as 14 days since the last infection event, with fixed post-detection
interventions; and the number of hospitalisations that occur before elimination is achieved (Fig. 3). As these
outbreaks are all relatively small we do not model fatalities. In all simulations, case isolation and contact trac-
ing measures are introduced when the outbreak is first detected, resulting in a 44% reduction in the effective
reproduction number (see “Methods”). In simulations of the time to elimination, additional population-wide
interventions are implemented when the outbreak is first detected, modelled by an additional reduction of 67%
Scientific Reports | (2022) 12:2720 | https://doi.org/10.1038/s41598-022-06707-5 4
Vol:.(1234567890)www.nature.com/scientificreports/
Baseline Lower effectiveness Higher effectiveness
R0 = 3.0
Vaccine effectiveness eI = 70%, eT = 50% eI = 50%, eT = 40% eI = 90%, eT = 50%
Rv 1.02 1.28 0.93
Infections 150,000 (44%) 1,100,000 (61%) 25,000 (18%)
Hospitalisations 2000 (35%) 15,000 (47%) 310 (15%)
Fatalities 230 (35%) 1800 (47%) 37 (15%)
Peak in hospital 32 (after 415 days) 990 (after 210 days) N/A
R0 = 4.5
Rv 1.53 1.92 1.39
Infections 1,300,000 (44%) 2,200,000 (58%) 690,000 (18%)
Hospitalisations 17,000 (35%) 30,000 (47%) 8,800 (15%)
Fatalities 2200 (35%) 4100 (47%) 1100 (15%)
Peak in hospital 2000 (after 140 days) 5200 (after 100 days) 750 (after 174 days)
R0 = 6.0
Rv 2.04 2.56 1.85
Infections 1,800,000 (44%) 2,700,000 (58%) 1,100,000 (19%)
Hospitalisations 25,000 (35%) 37,000 (47%) 15,000 (15%)
Fatalities 3400 (35%) 5300 (47%) 2000 (15%)
Peak in hospital 4700 (after 90 days) 8900 (after 70 days) 2400 (after 110 days)
Table 3. Results from an unmitigated epidemic with R0 = 3 (upper), R0 = 4.5 (middle), and R0 = 6 (lower)
before vaccination and 90% vaccine coverage for over 15-year-olds. All results are given to 2 significant figures
and only include the locally acquired cases, not those imported from overseas. All scenarios assume protection
against severe disease given infection of eD = 80%. Numbers in parentheses are the percentage of infections/
hospitalisations/fatalities that occur in vaccinated individuals.
Baseline Lower effectiveness Higher effectiveness
R0 = 3.0
Vaccine effectiveness eI = 70%, eT = 50% eI = 50%, eT = 40% eI = 90%, eT = 50%
Rv 0.71 1.11 0.43
Infections 13,000 (73%) 440,000 (82%) 3700 (47%)
Hospitalisations 240 (35%) 6700 (47%) 100 (15%)
Fatalities 26 (35%) 730 (47%) 11 (15%)
Peak in hospital N/A 210 (after 310 days) N/A
R0 = 4.5
Rv 1.06 1.67 0.65
Infections 210,000 (73%) 1,500,000 (82%) 8700 (47%)
Hospitalisations 3800 (35%) 24,000 (47%) 240 (15%)
Fatalities 410 (35%) 2900 (47%) 26 (15%)
Peak in hospital N/A 3200 (after 120 days) N/A
R0 = 6.0
Rv 1.41 2.22 0.87
Infections 770,000 (73%) 2,000,000 (82%) 26,000 (47%)
Hospitalisations 14,000 (35%) 32,000 (47%) 710 (15%)
Fatalities 1700 (35%) 4300 (47%) 77 (15%)
Peak in hospital 1300 (after 150 days) 6600 (after 80 days) N/A
Table 4. Results from an unmitigated epidemic with R0 = 3 (upper), R0 = 4.5 (middle) and R0 = 6(lower)
before vaccination and 90% vaccine coverage for the entire population (including children). All results given to
2 significant figures and do not include imported cases, only the resulting community transmission cases. All
scenarios assume protection against severe disease given infection of eD = 80%. Numbers in parentheses are
the percentage of infections/hospitalisations/fatalities that occur in vaccinated individuals.
Scientific Reports | (2022) 12:2720 | https://doi.org/10.1038/s41598-022-06707-5 5
Vol.:(0123456789)www.nature.com/scientificreports/
Figure 3. Detection and control of small outbreaks as vaccine coverage increases: (a–c) number of infections
when a community outbreak is first detected; (d–f) probability an outbreak is eliminated before reaching 1000
cases without population-level interventions; (g–i) time from detection to elimination with population-level
interventions; (j–l) total number of hospitalisations before outbreak is eliminated. Results are shown for three
values of R0 and three values of the probability of testing for symptomatic individuals in the period before
pre pre pre
the outbreak is detected: pdetect = 5% (red), pdetect = 10% (amber) and pdetect = 15% (green). In (d–f), case
isolation and contact tracing are introduced after outbreak detection giving 43% reduction in Reff ; in (g–l),
population-level restrictions are also introduced after outbreak detection giving a total 81% reduction in Reff ;
note that in (i) and (l) when R0 = 6, an 81% reduction in Reff is insufficient to achieve elimination when vaccine
coverage is less than around 20%. The black vertical line represents the point in the vaccine roll-out at which
vaccination of under 15-year-olds begins. Points are the median and error bars represent the interquartile range
of 10,000 independently initialised realisations of the stochastic model.
in the effective reproduction number. This is consistent with estimates of the relative reduction in transmission
from control measures in response to previous outbreaks in New Zealand and may be achieved via Alert Level
changes or other public health interventions.
Until high levels of vaccination are achieved, probability of detection is the most important factor affecting
the size of outbreaks at detection (Fig. 3a–c). This shows the ongoing importance of high rates of community
testing for early outbreak detection. In a completely non-vaccinated population, the probability of elimination
is around 60% when R0 = 3.0, around 50% when R0 = 4.5, and around 40% when R0 = 6. (Fig. 3d–f). This is
partly due to stochasticity of transmission, meaning that a relatively high proportion of infected individuals
do not transmit the virus. Vaccination of the older age groups at the start of the roll-out does not substantially
change the probability of elimination. However, once the roll-out in those under 65 years old begins (> 16%
fully vaccinated), the probability of elimination steadily increases with vaccine coverage. Once Rv drops below
approximately 1.77, case isolation and contact tracing are theoretically sufficient to bring the effective reproduc-
tion number below 1. This occurs when approximately 47%, 66% or 78% of the population have been vaccinated
when R0 = 3, 4.5 or 6 respectively. Once coverage is greater than these values, assuming contact tracing and
case isolation remain effective even in very large outbreaks, all outbreaks will eventually eliminate. In practice,
however, the observed probability of elimination in Fig. 3d–f may still be less than 1 because some outbreaks
still reach 1,000 cases before elimination.
As the detection probability or vaccination coverage increases, outbreaks can be eliminated more rapidly
(Fig. 3g–i). It may be possible to lift population-level restrictions before elimination is formally achieved, but we
do not model this here. The number of hospitalisations decreases sharply with vaccination coverage (Fig. 3j–l),
Scientific Reports | (2022) 12:2720 | https://doi.org/10.1038/s41598-022-06707-5 6
Vol:.(1234567890)www.nature.com/scientificreports/
thanks to protection of high-risk groups in the early stages of the vaccine roll-out. When R0 = 6, however, the
assumed reduction of 81% in the reproduction number due to post-detection interventions is not sufficient for
outbreak control at low vaccine coverage (Fig. 3i), suggesting that stronger measures may be required. However,
this result should be viewed with caution because we currently lack data on transmission of new variants under
stay-at-home restrictions or other strong interventions. The assumption we make that a given control measure
leads to the same proportional reduction in transmission regardless of R0 may not always be v alid25.
Discussion
We have investigated an age-structured model for transmission of COVID-19 in a partially vaccinated popula-
tion, parameterised to represent New Zealand’s age-structure and age-specific contact rates. In New Zealand the
Pfizer/BioNTech vaccine was originally approved for use in people aged over 16 years but has since also been
approved for 12–15-year-olds. Our results show that, under baseline vaccine effectiveness assumptions and with
R0 = 4.5, vaccination of over 90% of the population will likely be necessary to reach the population immunity
threshold, defined as a reproduction number that is less than 1 in the absence of other interventions. This would
require vaccination of under 16 year olds. If R0 = 6 (which could represent a highly transmissible SARS-CoV-2
variant such as Delta13), population immunity would require approximately 98% of the total population, some-
thing which is unlikely to be achievable in practice.
The model also assumes that vaccine coverage is evenly spread throughout the population within each age
group. In reality, we expect coverage to be heterogeneous. This means that, even if Rv < 1 at a national level,
communities with relatively low vaccine coverage (or relatively high contact rates) could still have Rv > 1 locally,
which would expose them to major outbreaks. It will be important to pay attention to vaccine coverage in differ-
ent geographic and socioeconomic groups to identify at-risk communities and prioritise them for vaccination.
Our results show that vaccination of the priority age group (over 65 years) at the beginning of the programme
does not greatly reduce the potential for community transmission of the virus, but sharply reduces hospitalisa-
tions and fatalities by protecting the highest-risk groups in the model. However, there are other risk factors
we have not accounted for here. Māori and Pacific peoples have previously been shown to be at greater risk of
hospitalisation21 and f atality26 after accounting for age and reported comorbidities. Any strategy to minimise
negative health outcomes from COVID-19 should prioritise these groups for vaccination. It will also be essential
to ensure that Māori and Pacific communities can access the vaccine in a way that meets their cultural, linguistic
and social needs27. This includes removing costs and barriers, and ensuring that it is easy and convenient to access
the vaccine. Once high-risk groups are vaccinated, extending high coverage levels to lower-risk groups including
young people and, provided regulatory approval is obtained, children will be crucial to minimising the potential
for transmission and reaching the population immunity threshold.
Whether or not New Zealand reaches the theoretical population immunity threshold, the higher vaccination
coverage is, the more collective protection the population has against infections, hospitalisations and deaths
from COVID-19. Conversely, even if population immunity is achieved, transmission can still occur. As a rule-
of-thumb, for any effective reproduction number less than 1, the average number of cases caused by a single
re-introduction is given by Reff /(1 − Reff )28. For example, if Reff = 0.95, there will be an average of 19 commu-
nity cases for every border re-introduction. This means that, regardless of the population immunity threshold,
it will be essential to continue to vaccinate as many people as possible to minimise the combined potential for
transmission and health impacts.
Nguyen et al.17 also investigated alternative age-based vaccine prioritisation schemes for New Zealand and
focused on the minimum vaccine allocation required to reach the population immunity threshold. The results
from our SEIR model are comparable to those of Nguyen et al.17 when R0 = 4.5 and we investigated in greater
detail the outcomes for a more transmissible variant with R0 = 6. In addition, our stochastic model allowed us to
investigate the effect of increasing levels of vaccine coverage on the dynamics and control of small border-related
incursions of COVID-19. Our results also show that, until a high proportion of the population is vaccinated, the
probability of case detection is still an important determinant of outbreak size. This demonstrates that high rates
of community testing for surveillance purposes will remain crucial throughout the vaccine roll-out to minimise
the risk of a large outbreak. Although the model ignores seasonal effects, these will be particularly important
during the winter influenza season when the incidence of symptoms consistent with COVID-19 is relatively high
and seasonality may increase the transmission potential of SARS-CoV-229.
As vaccine coverage increases, the stringency and duration of population-level restrictions (e.g. via New Zea-
land’s COVID-19 Alert Level system) required to eliminate an outbreak decreases. Under the baseline scenario
with R0 = 4.5, once approximately 60% of the population is fully vaccinated, the model estimates that it will be
possible to eliminate any new outbreaks with case isolation and contact tracing alone. However, it is extremely
unlikely that the contact tracing system would perform at the level required if there were a large number of
imported cases that triggered multiple concurrent outbreaks, which was the situation New Zealand faced in
March 2020. In the medium term, a modest reduction in transmission could be achieved by baseline measures
such as mask use, widespread community testing, and isolation of symptomatic individuals. For example, if 70%
of symptomatic cases are isolated (with 80% effectiveness) an average of 2 days after onset of symptoms, Reff
is reduced by 11%. This would imply that effective population immunity could be achieved when vaccination
reduces Reff to approximately 1.1. However, this will still require very high vaccine coverage and is subject to the
caveats discussed above about low coverage and high contact groups remaining vulnerable.
Together these results suggest that, until we get close to the population immunity threshold, a major public
health response that included significant interventions would still be required to control any resurgent outbreaks
and prevent a major epidemic. Nonetheless, as vaccination coverage increases, it may be possible for the require-
ment for 14 day government-managed isolation period to be replaced with a combination of testing, shorter
Scientific Reports | (2022) 12:2720 | https://doi.org/10.1038/s41598-022-06707-5 7
Vol.:(0123456789)www.nature.com/scientificreports/
quarantine periods or home isolation for arrivals from low-risk countries. Future work will model the risk from
different border policies and different traveller risk profiles. However, strong border restrictions designed to
keep COVID-19 out of the community are likely to be required until very high vaccination coverage is achieved
nationally.
We have investigated outcomes when the overall vaccine effectiveness against transmission is 70%, 85% and
95%. Published evidence shows the Pfizer-BioNTech mRNA vaccine is highly effective in preventing documented
infection after two doses9,30,31, thereby implying high effectiveness against transmission10. Despite this, there is
still some uncertainty around the exact effectiveness of this vaccine in reducing transmission. Furthermore,
the ongoing emergence of variants of concern that are potentially more t ransmissible12 or less responsive to
vaccines32 could mean that, in future, R0 is substantially higher or vaccine effectiveness is substantially lower than
the values assumed in this p aper33. Our baseline vaccine effectiveness parameters are also consistent with more
recent estimates for the Delta variant34, while our lower effectiveness scenario represents a variant of concern
that is able to partially evade immunity, such as the Beta v ariant35. Higher values of R0 or lower values of vaccine
effectiveness against transmission mean that higher vaccination coverage is required to obtain the same level of
protection at a population level. Although the Pfizer vaccine has high effectiveness against the Delta variant after
two doses, effectiveness after only one dose is significantly l ower13. This means that administering the full course
of two doses is essential to providing full immunity. Booster doses are now being rolled out36 and these may be
required to reach the higher effectiveness scenario, or even the baseline scenario. Continued research into the
pathogenicity, transmission characteristics, and responsiveness to vaccines of emerging variants of SARS-CoV-2
is needed to evaluate their effect on population immunity levels and the risk they pose.
The model contains a number of simplifications, limitations, and sources of uncertainty. Firstly, it models
transmission of SARS-CoV-2 at a national level and ignores geographic and socioeconomic heterogeneities that
will affect transmission rates. It also does not consider differential transmission rates in specific settings (such
as households, schools and workplaces). Secondly, there is still uncertainty about the intrinsic transmissibility
and vaccine effectiveness, particularly for new and potential future variants of concern. Data is still being gath-
ered and analysed on this internationally; model results will need to be updated as new data becomes available.
Thirdly, the rates of contact between age groups are based on 2008 survey data from EU countries37, mapped onto
the current age structure of New Zealand’s population. We have also assumed an age-dependent susceptibility
profile based on modelled e stimates38, which are subject to uncertainty and are difficult to measure directly. If
actual age-dependent contact rates or susceptibility have a significantly different structure than assumed, this
would affect how cases are distributed across age groups, which would change model outputs for hospitalisations
and deaths. Fourthly, the results describe model outcomes under specific assumptions about the interventions
taken in response to cases. These are either counterfactuals modelling a completely unmitigated epidemic, or
elimination scenarios that assume strong and effective interventions are implemented for as long as is needed
to eliminate an outbreak. We do not attempt to predict the outcomes of other control responses or behavioural
factors that may change the effectiveness of interventions such as contact tracing, quarantine or prolonged
restrictions. Finally, the model also ignores the effects of seasonality, waning immunity, population dynamics
(births, deaths, ageing and migration) and environmental factors (e.g. pollution, latitude, humidity, and tem-
perature) which have been shown to be correlated with SARS-CoV-2 transmission rates or s everity29,39–41. These
factors will introduce additional challenges in achieving and maintaining high levels of population immunity.
In particular, there is growing evidence that immunity against infection from the Pfizer vaccine wanes over a
period of several months, but high levels of immunity can be provided by a booster d ose36. Models can be used
42
to investigate the consequences of waning immunity and booster d oses and the effects of this in New Zealand
will be addressed in future work.
We have focused on hospitalisations as a metric of demand on the healthcare system and have not modelled
other outcomes, such as ICU occupancy, which may be equally important. A more detailed clinical pathways
model could be applied to our model outputs, for example using an age-specific profile of ICU admission risk
and length of ICU stay distribution. However, we note that ICU admission risk is subject to more uncertainty
because of smaller numbers and significant variation between countries in observed ICU rates so we have not
attempted to do this for New Zealand here.
Until the vaccine rollout is complete, retaining the elimination strategy has two key benefits. Firstly, it protects
people who have not yet been offered the vaccine and the minority of people for whom the vaccine is less effective,
or who cannot be vaccinated for medical reasons. Secondly, by keeping cases to a minimum, it maximises the
ability of the contact tracing system to reduce transmission. This decreases the likelihood of needing to use the
alert level system to control future outbreaks. Nonetheless this work provides insight into some of the opportuni-
ties to change policy settings that may arise as New Zealand’s vaccination programme rolls out.
Methods
Full details of the SEIR and branching process models are provided in Supplementary Information sec. 1 and
Supplementary Figs. S1 and S2.
Age‑structured contact rates. We used an age-structured model of SARS-CoV-2 transmission in New
Zealand with the population divided into 15 five-year age bands, plus an over-75-year-old age band. The rela-
tive contact rates within and between age groups are defined by a matrix C , Prem, et al.37 (see Supplementary
Information sec. 1.3 and Supplementary Figs. S3 and S4). Susceptibility to infection and the proportion of infec-
tions (in non-vaccinated individuals) that result in clinical disease, hospitalisation, and fatality vary by age (see
Supplementary Table S1). We assume that subclinical individuals have a transmission rate that is τ = 50% of
that of clinical cases38.
Scientific Reports | (2022) 12:2720 | https://doi.org/10.1038/s41598-022-06707-5 8
Vol:.(1234567890)www.nature.com/scientificreports/
Vaccination coverage. In each model scenario, the proportion of age group i that is vaccinated, denoted
vi , is assumed to be fixed, i.e. we do not attempt to model simultaneous vaccination and transmission dynam-
ics. The interplay between these dynamics is important in countries rolling out vaccination programmes at the
same time as dealing with high rates of infection, but is less important for countries such as New Zealand where
COVID-19 is currently eliminated. For simplicity, we assume that all individuals are either not vaccinated, or
fully vaccinated (i.e. more than 7 days after their second dose). To model different staging points in the vaccine
roll-out, we assume that at most 90% of any age group can be vaccinated, with vaccinations beginning in the
65 + year age groups, then in the 15–64 years age groups, and finally in the 0–14 years age groups. At a given
stage in the roll-out, we assume the vaccine coverage vi is the same for each five-year age group i within the same
priority age band. See Supplementary Information sec. 2.2 for a more fine-grained age prioritisation.
Vaccine effectiveness. The effectiveness of the vaccine is described by three parameters: effectiveness
against infection (eI ), effectiveness against transmission conditional on breakthrough infection (eT ), and effec-
tiveness against severe disease conditional on breakthrough infection (eD ) (see Table 1). For simplicity, we do
not model any additional reduction in mild disease beyond that provided by prevention of infection. We also
assume that the vaccine is equally effective in all age groups and we do not consider the effect of any waning of
immunity over time. We assume the vaccine blocks infection in an “all-or-nothing” fashion. This means that the
vaccine prevents any infection from occurring in a fixed proportion eI of the vaccinated population, with the
remaining vaccinated population being fully susceptible (see Supplementary Information sec. 2.3 for an alterna-
tive assumption).
Next generation matrix. The next generation matrix, NGM i,j , defines the average number of individuals
in group i that will be infected by a single infectious individual in group j over their whole infectious period
given a fully susceptible population:
clin
NGMi,j = Uui tI C
j,i [pj + τ (1 − pjclin )]
where C is the contact matrix, tI is the mean duration of the infectious period in days, Uui describes the prob-
ability that a contact by an individual in age group i with an infectious individual results in transmission, pjclin
is the fraction of infections in age group j that are clinical, and τ is the relative infectiousness of subclinical
individuals. The basic reproduction number of the age-structured model is the dominant eigenvalue of the next
generation matrix, denoted R0 = ρ(NGM). In model simulations, the value of the constant U is chosen to give
the desired value of R0. When a proportion vi of age group i are vaccinated (but with no immunity from prior
infection), the next generation matrix NGM v is given by:
v
NGMi,j = (1 − eI vi )(1 − eT qj )NGMi,j
where qj = (1 − eI )vj /(1 − eI vj ) is the proportion of infections in age group j that are vaccinated. This reflects
the assumption that transmission from vaccinated individuals is reduced by eT and infection of vaccinated indi-
viduals is reduced by eI . The vaccinated reproduction number is Rv = ρ(NGM v ).
Initial conditions. Seed cases representing international arrivals are assumed to be non-vaccinated and
clinical, are distributed over all age groups in proportion to the size of those groups, spend the full infectious
period in the community, and have the same contact patterns as the general population. If some proportion of
seed cases are vaccinated or subclinical, this is equivalent to a smaller number of unvaccinated, clinical seed
cases; model results are not highly sensitive to this assumption (see Supplementary Fig. S11). We do not model
higher vaccination or surveillance rates for border workers, who are more likely to be a seed case.
Testing and contact tracing. We simulate the outbreak dynamics under three different levels of commu-
nity testing: low, moderate, and high, corresponding to the probability of detecting a symptomatic COVID-19
case of 5%, 10%, and 15% respectively during the period of time before the outbreak is first detected. We assume
there is a delay from symptom onset to the return of a positive test result of 4 days on average and that the detec-
tion rate is the same for vaccinated and non-vaccinated individuals and across all age groups. Once an outbreak
is detected, we assume that testing rates increase and case isolation and contact tracing begins. As a simplified
representation of this, we assume that all infections have a probability of being detected by contact tracing of
70%, with a mean delay of 6 days after the infection time. We assume that, independently of contact tracing,
the probability of detecting a clinical infection as a result of testing following symptom onset increases to 40%,
representing increased awareness of infection risk. Once an infection is detected, the individual is assumed to
be immediately isolated so that there is no further transmission. Because the stochastic implementation of the
model is used to represent relatively small outbreaks, we assume that the testing and contact tracing param-
eters are independent of the number of cases (i.e. we do not model a decrease in system performance as cases
stretch case management capacity). Together, case isolation and contact tracing measures result in a reduction
in the reproduction number of around 44% (see Supplementary Information sec. 1.2), which is consistent with
estimates from empirical data from New Zealand’s March–April 2020 o utbreak20. The individual values of the
testing probabilities and delay times are less important than their combined effect on the reproduction number.
Sensitivity analysis. Additional sensitivity analysis is shown in Supplementary Figs. S5, S6, S7, S8, S9, S10,
S11, S12, S13 and S14.
Scientific Reports | (2022) 12:2720 | https://doi.org/10.1038/s41598-022-06707-5 9
Vol.:(0123456789)www.nature.com/scientificreports/
Research methods statement. All methods were carried out in accordance with relevant guidelines and
regulations.
Data availability
No new datasets are presented in this research. Code to reproduce the results is available as electronic online
material and at https://github.com/nicsteyn2/TPM-COVID19-VaccineModel.
Received: 21 July 2021; Accepted: 1 February 2022
References
1. World Health Organisation. Report of the WHO-China Joint Mission on Coronavirus Disease 2019 (COVID-19). https://www.who.
int/docs/default-source/coronaviruse/who-china-joint-mission-on-covid-19-final-report.pdf (2020).
2. World Health Organisation. Coronavirus disease 2019 (COVID-19) Situation Report 51. https://www.who.int/docs/default-source/
coronaviruse/situation-reports/20200311-sitrep-51-covid-19.pdf?sfvrsn=1ba62e57_10 (2020).
3. Baker, M. G., Kvalsvig, A. & Verrall, A. J. New Zealand’s COVID-19 elimination strategy. Med. J. Aust. 213, 198–200. https://doi.
org/10.5694/mja2.50735 (2020).
4. World Health Organisation. Weekly Epidemiological Update. https://www.who.int/docs/default-source/coronaviruse/situation-
reports/20210223_weekly_epi_update_28.pdf?sfvrsn=8064676c_16. Accessed 23 Feb 2021.
5. Grout, L. et al. Estimating the failure risk of quarantine systems for preventing COVID-19 outbreaks in Australia and New Zealand.
MedRxiv https://doi.org/10.1101/2021.02.17.21251946 (2021).
6. Ministry of Health. Border Worker Vaccinations: An Important Step in New Zealand’s Pandemic Response. https://www.health.govt.
nz/news-media/media-releases/border-worker-vaccinations-important-step-new-zealands-pandemic-response (2021).
7. New Zealand Government. COVID-19 Vaccine Rollout Plan: 10 March 2021. https://covid19.govt.nz/updates-and-resources/lat-
est-updates/covid-19-vaccine-rollout-plan/ (2021).
8. Polack, F. P. et al. Safety and efficacy of the BNT162b2 mRNA covid-19 vaccine. N. Engl. J. Med. 383, 2603–2615. https://doi.org/
10.1056/NEJMoa2034577 (2020).
9. Dagan, N. et al. BNT162b2 mRNA covid-19 vaccine in a nationwide mass vaccination setting. N. Engl. J. Med. 384, 1412–1423.
https://doi.org/10.1056/NEJMoa2101765 (2021).
10. Lipsitch, M. & Kahn, R. Interpreting vaccine efficacy trial results for infection and transmission. Vaccine. 39, 4082–4088. https://
doi.org/10.1101/2021.02.25.21252415 (2021).
11. Public Health England. SARS-CoV-2 Variants of Concern and Variants Under Investigation in England. Technical Briefing 14. https://
assets.p ublis hing.s ervic e.g ov.u k/g overn ment/u pload s/s ystem/u pload s/a ttach ment_d ata/fi
le/9 91343/V arian ts_o f_C oncer n_V OC_
Technical_Briefi ng_14.pdf (2021).
12. Davies, N. G. et al. Estimated transmissibility and impact of SARS-CoV-2 lineage B.1.1.7 in England. Science https://doi.org/10.
1126/science.abg3055 (2021).
13. Public Health England. SARS-CoV-2 Variants of Concern and Variants Under Investigation in England. Technical Briefing 15. https://
assets.p ublis hing.s ervic e.g ov.u k/g overn ment/u pload s/s ystem/u pload s/a ttach ment_d ata/fi
le/9 93198/V arian ts_o f_C oncer n_V OC_
Technical_Briefi ng.pdf (2021).
14. Lopez Bernal, J. et al. Effectiveness of covid-19 vaccines against the B.1.617.2 (delta) variant. N. Engl. J. Med. 385, 585–594. https://
doi.org/10.1056/NEJMoa2108891 (2021).
15. Stowe, J. et al. Effectiveness of COVID-19 Vaccines Against Hospital Admission with the Delta (B.1.617.2) Variant. https://khub.net/
web/phe-national/public-librar y/-/document_librar y/v2WsRK3ZlEig/view/479607266 (2021).
16. Bubar, K. M. et al. Model-informed COVID-19 vaccine prioritization strategies by age and serostatus. Science 371, 916–921. https://
doi.org/10.1126/science.abe6959 (2021).
17. Nguyen, T. et al. COVID-19 vaccine strategies for Aotearoa New Zealand: A mathematical modelling study. Lancet Reg. Health
West. Pac. 15, 100256. https://doi.org/10.1016/j.lanwpc.2021.100256 (2021).
18. Plank, M. J., Binny, R. N., Hendy, S. C., Lustig, A. & Ridings, K. Vaccination and testing of the border workforce for COVID-19
and risk of community outbreaks: A modelling study. R. Soc. Open Sci. 8, 210686. https://doi.org/10.1098/rsos.210686 (2021).
19. Hendy, S. et al. Mathematical modelling to inform New Zealand’s COVID-19 response. J. R. Soc. N. Z. 51, S86–S106. https://doi.
org/10.1080/03036758.2021.1876111 (2021).
20. James, A. et al. Successful contact tracing systems for COVID-19 rely on effective quarantine and isolation. PLoS ONE 16, e0252499.
https://doi.org/10.1371/journal.pone.0252499 (2021).
21. Steyn, N. et al. Māori and pacific people in New Zealand have higher risk of hospitalisation for COVID-19. N. Z. Med. J. 134,
28–43 (2021).
22. Zachreson, C., Chang, S. L., Cliff, O. M. & Prokopenko, M. How will mass-vaccination change COVID-19 lockdown requirements
in Australia?. Lancet Reg. Health West. Pac. 14, 100224. https://doi.org/10.1016/j.lanwpc.2021.100224 (2021).
23. Moore, S., Hill, E. M., Tildesley, M. J., Dyson, L. & Keeling, M. J. Vaccination and non-pharmaceutical interventions for COVID-
19: A mathematical modelling study. Lancet Infect. Dis. 21, 793–802. https://doi.org/10.1016/S1473-3099(21)00143-2 (2021).
24. Scientific Pandemic Influenza Group on Modelling. SPI-M-O: Summary of Further Modelling of Easing Restrictions: Roadmap Step
4.https://assets.publishing.service.gov.uk/government/uploads/system/uploads/attachment_data/file/993510/S1287_SPI-M-O_
Summar y_Roadmap_step_4.pdf (2021).
25. Golding, N. et al. Situational Assessment of COVID-19 in Australia Technical Report 15 March 2021. https://www.doherty.edu.au/
uploads/content_doc/Technical_Report_15_March_2021_RELEASED_VERSION.pdf (2021).
26. Steyn, N. et al. Estimated inequities in COVID-19 infection fatality rates by ethnicity for Aotearoa New Zealand. N. Z. Med. J. 133,
28–39 (2020).
27. Ryan, J. Preparations for the Nationwide Roll-Out of the Covid-19 Vaccine. https://oag.parliament.nz/2021/vaccines/overview.htm
(2021).
28. Miller, J. C. A primer on the use of probability generating functions in infectious disease modeling. Infect. Dis. Model. 3, 192–248.
https://doi.org/10.1016/j.idm.2018.08.001 (2018).
29. Gavenčiak, T. et al. Seasonal variation in SARS-CoV-2 transmission in temperate climates. MedRxiv https://doi.org/10.1101/2021.
06.10.21258647 (2021).
30. Moustsen-Helms, I. R. et al. Vaccine effectiveness after 1st and 2nd dose of the BNT162b2 mRNA Covid-19 vaccine in long-term
care facility residents and healthcare workers: A Danish cohort study. MedRxiv https://d oi.o rg/1 0.1 101/2 021.0 3.0 8.2 12522 00 (2021).
31. Weekes, M. et al. Single-dose BNT162b2 vaccine protects against asymptomatic SARS-CoV-2 infection. Authorea https://doi.org/
10.22541/au.161420511.12987747/v1 (2021).
32. Madhi, S. A. et al. Efficacy of the ChAdOx1 nCoV-19 covid-19 vaccine against the B.1.351 variant. N. Engl. J. Med. 384, 1885–1898.
https://doi.org/10.1056/NEJMoa2102214 (2021).
Scientific Reports | (2022) 12:2720 | https://doi.org/10.1038/s41598-022-06707-5 10
Vol:.(1234567890)www.nature.com/scientificreports/
33. Dyson, L. et al. Possible future waves of SARS-CoV-2 infection generated by variants of concern with a range of characteristics.
Nat. Commun. 12, 5730. https://doi.org/10.1038/s41467-021-25915-7 (2021).
34. UK Health Security Agency. COVID-19 Vaccine Surveillance Report (Week 49). https://www.gov.uk/government/publications/
covid-19-vaccine-weekly-surveillance-reports (2021).
35. Abu-Raddad, L. J., Chemaitelly, H. & Butt, A. A. Effectiveness of the BNT162b2 covid-19 vaccine against the B.1.1.7 and B.1.351
variants. N. Engl. J. Med. 385, 187–189. https://doi.org/10.1056/NEJMc2104974 (2021).
36. Andrews, N. et al. Effectiveness of BNT162b2 (Comirnaty, Pfizer-BioNTech) COVID-19 booster vaccine against covid-19 related
symptoms in England: Test negative case-control study. N. Engl. J. Med. https://doi.org/10.1101/2021.11.15.21266341 (2021).
37. Prem, K., Cook, A. R. & Jit, M. Projecting social contact matrices in 152 countries using contact surveys and demographic data.
PLoS Comput. Biol. 13, e1005697. https://doi.org/10.1371/journal.pcbi.1005697 (2017).
38. Davies, N. G. et al. Age-dependent effects in the transmission and control of COVID-19 epidemics. Nat. Med. 26, 1205–1211.
https://doi.org/10.1038/s41591-020-0962-9 (2020).
39. Ma, Y., Pei, S., Shaman, J., Dubrow, R. & Chen, K. Role of meteorological factors in the transmission of SARS-CoV-2 in the United
States. Nat. Commun. 12, 3602. https://doi.org/10.1038/s41467-021-23866-7 (2021).
40. Nichols, G. L. et al. Coronavirus seasonality, respiratory infections and weather. BMC Infect. Dis. 21, 1101. https://d oi.o
rg/1 0.1 186/
s12879-021-06785-2 (2021).
41. Pegoraro, V., Heiman, F., Levante, A., Urbinati, D. & Peduto, I. An Italian individual-level data study investigating on the associa-
tion between air pollution exposure and Covid-19 severity in primary-care setting. BMC Public Health 21, 902. https://doi.org/
10.1186/s12889-021-10949-9 (2021).
42. Keeling, M. J. et al. Waning, boosting and a path to endemicity for SARS-CoV-2. BMC Public Health https://doi.org/10.1101/2021.
11.05.21265977 (2021).
Acknowledgements
The authors acknowledge the support of the New Zealand Ministry of Health in supplying information on vac-
cine sequencing plans in support of this work. We are grateful to Courtney Addison, Samik Datta, Nigel French,
Ricci Harris, Markus Luczak-Roesh, Anja Mizdrak, Matt Parry, Patricia Priest, James Stanley, Ian Town, Robin
Turner, and the COVID-19 Modelling Steering Group for feedback and informal peer review comments on an
earlier version of this manuscript. This work was funded by the New Zealand Ministry of Business, Innovation
and Employment and Te Pūnaha Matatini, Centre of Research Excellence in Complex Systems.
Author contributions
N.S., M.P. and S.C. conceptualised the research and wrote the main manuscript text. N.S. and K.R. collated data
and reviewed literature to inform study design. N.S. wrote code for model simulation and prepared Figures and
Tables. All authors reviewed the manuscript.
Competing interests
The authors declare no competing interests.
Additional information
Supplementary Information The online version contains supplementary material available at https://doi.org/
10.1038/s41598-022-06707-5.
Correspondence and requests for materials should be addressed to M.J.P.
Reprints and permissions information is available at www.nature.com/reprints.
Publisher’s note Springer Nature remains neutral with regard to jurisdictional claims in published maps and
institutional affiliations.
Open Access This article is licensed under a Creative Commons Attribution 4.0 International
License, which permits use, sharing, adaptation, distribution and reproduction in any medium or
format, as long as you give appropriate credit to the original author(s) and the source, provide a link to the
Creative Commons licence, and indicate if changes were made. The images or other third party material in this
article are included in the article’s Creative Commons licence, unless indicated otherwise in a credit line to the
material. If material is not included in the article’s Creative Commons licence and your intended use is not
permitted by statutory regulation or exceeds the permitted use, you will need to obtain permission directly from
the copyright holder. To view a copy of this licence, visit http://creativecommons.org/licenses/by/4.0/.
© The Author(s) 2022
Scientific Reports | (2022) 12:2720 | https://doi.org/10.1038/s41598-022-06707-5 11
Vol.:(0123456789)You can also read


