Economic profile Central Highlands | June 2019 - Central Highlands Development Corporation
←
→
Page content transcription
If your browser does not render page correctly, please read the page content below
Economic profile Central Highlands | June 2019
Abbreviations

Throughout this profile a series of abbreviations has been utilised.
These are summarised below:

ABS                      Australian Bureau of Statistics

CH                       Central Highlands

CHDC                     Central Highlands Development Corporation

CHRC                     Central Highlands Regional Council

Central Queensland SA4   Central Queensland Statistical Area Level 4

GRP                      Gross Regional Product

LGA                      Local Government Area

M2                       Square metres

QGSO                     Queensland Government Statistician’s Office

QLD                      Queensland

RTA                      Residential Tenancies Authority

SA4                      Statistical Area Level 4

TRA                      Tourism Research Australia
Contents

Overview                                         Housing
Our region in numbers                        2   Building approvals                                                   30

Regional snapshot                           4    Residential lot approvals                                            31

                                                 Lot registrations                                                    32
Demographics
                                                 New lot sales and median price                                       33
Population                                   5
                                                 Dwelling sales and median price                                      34
Population projections                      6
                                                 Median weekly rent                                                   35
Non-resident population                      7

Age                                         8    Tourism
Origin                                      9    Output                                                               36

Wellbeing                                   11   Employment                                                           37

Education                                   13   Distribution of tourist dollar and visitor profile                   38

Income and families                         14   Emerald Airport                                                      39

Dwelling tenure and structure               15
                                                 Trends
Employment                                       Business activity                                                    40

Industry                                    16   Business registrations                                               42

Occupation                                  18   Employment                                                           43

Age and qualifications                      19
                                                 Appendix: Agribusiness Regional Stocktake
Method of travel to work                    20   Baseline Data to Drive Growth                                        44

Industry                                         Bibliography                                                         49

Output                                      21
                                                 Central Highlands Development Corporation                            50
Value-added                                 22

Local expenditure and regional exports      23

Regional imports and key industry drivers   24

Key industry drivers                        25

Summary indicators and gap analysis         27

Gap analysis                                28

Major projects                              29

                                                                          Central Highlands Development Corporation    1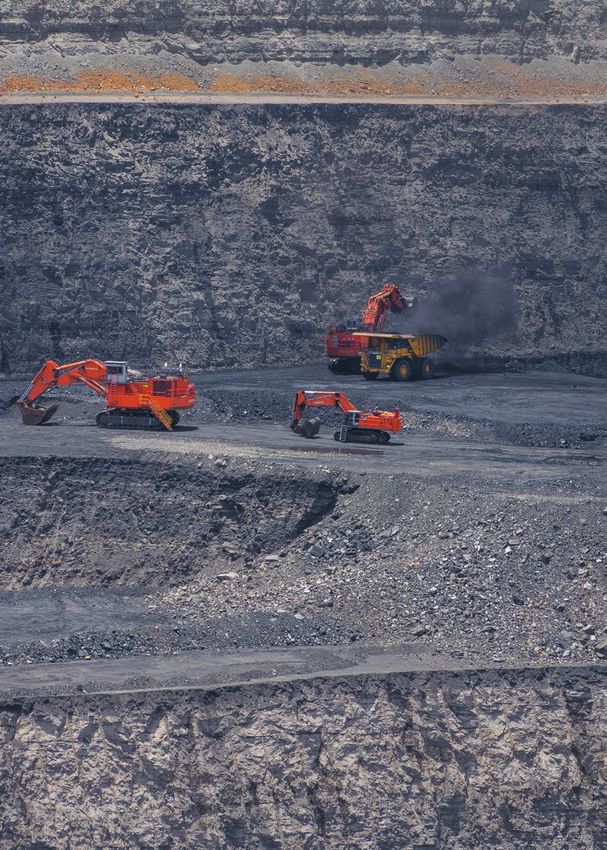
Our region in numbers
Central Highlands
Region overview Resources
$8.419bn 34.5% 58.0%
22.2%
Output generated
$2,190.264 m
$3.777bn 63.6%
Total value-added
The Mining sector Contribution of the Mining is the largest employer
comprises 6,079 jobs Mining sector to the of both the resident (22.2%)
$5.706bn out of the 17,019 jobs in
the region
total value-added for the
Central Highlands
and non-resident (63.6%)
workforce
Total regional export
$813.163m $2.033bn
$1.436bn Mining is the highest contributor in
terms of local expenditure
Domestic imports to the region
Total local expenditure
Upper
Bowen Basin
$3.929bn
GRP for the Central Highlands region
Tieri
Oaky Creek
Capella
2,899
55 Gregory Crinum
Kestrel Yarrabee
Businesses registered and operating Jellinbah East
in the Central Highlands Rubyvale Ensham
Curragh
Sapphire A4 Emerald
A4
Blackwater Bluff
Bogantungan
Galilee Comet Bluff
A4
Basin Blackwater Duaringa
Cook
↑41.2%
Willow 55
7
Gemfields Minerva
Increase in number of
Springsure Woorabinda
businesses with turnover of
$10 million or more from
2017 to 2018
Meteor Downs South
Rolleston
Rolleston
60 Bauhinia
7
55
Legend
Capricorn Way
Great Inland Way
Major Sealed
Minor Sealed
Source: Economic Profile Central Highlands
Part Sealed Arcadia
(June 2019) chdc.com.au
Valley
2 Central Highlands QLD 2019 Economic Profile
Surat Basin
Agribusiness
$839m ↑90% 15% 90%
Economic value (2017) Value increase in wheat
compared to $780m (2016) ($10m to $19m)
1,445 ↓50%
Agricultural businesses Value decrease in sorghum of national of Queensland’s
($40m to $20m) mungbean crop mandarin exports
1.301m ↑8.62%
megalitres Value increase in cotton
10%+
1.37m
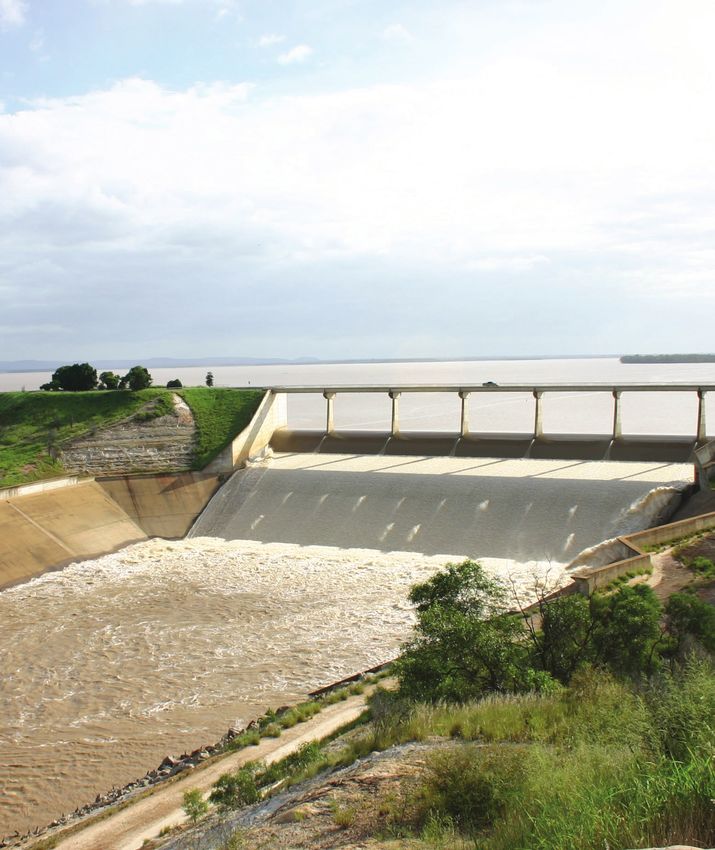
Fairbairn Dam, second largest ($58m to $63m) Head of cattle
storage in Queensland
$106m ↑112%
Value increase in pulses
Value of chickpea production of national table grape crop
($50m to $106m)
Tourism Community profile
$235.556m 4.4% Median weekly
income
$1,823
Tourism total output Unemployment rate in the Central
$1,402
Highlands (6.2% in QLD)
4 nights 28,645 $843
Average length of stay domestic $660
overnight visitors Population
3
Tourism is the 3rd highest
employment sector in the
Central Highlands
33 y.o. CH QLD CH QLD
Median age vs QLD average of 37 Personal Household
204,073 67.3% 16,190
Annual passengers through Labour force
Emerald airport 2018–19 FY
Largest 4,045
Non-residential workforce
gemfields in of the population live
the Southern and work in the region
Hemisphere
Top Key drivers in terms of regional exports, employment,
value-added and local expenditure on goods and services are:
$56.685m five Mining, livestock, grains & other agriculture, accommodation &
food services, retail trade, education & training
In wages
Central Highlands Development Corporation 3
Overview
Regional snapshot
The Central Highlands is a robust region that sits at the heart of
Queensland’s resources and agricultural sectors.
Spanning almost 60,000km2, the region includes a significant portion of Australia’s largest
coal reserve, the Bowen Basin, and is strategically located to service Australia’s newest mining
province, the Galilee Basin.
Sustained by irrigation sourced from water storage on the Nogoa and Comet Rivers, the
Central Highlands is also characterised by thriving farming industries, including beef, cotton,
grapes and citrus.
Major freight routes intersect the region, with the Capricorn Highway linking the coast to the
outback and the Gregory Highway connecting northern Queensland and New South Wales.
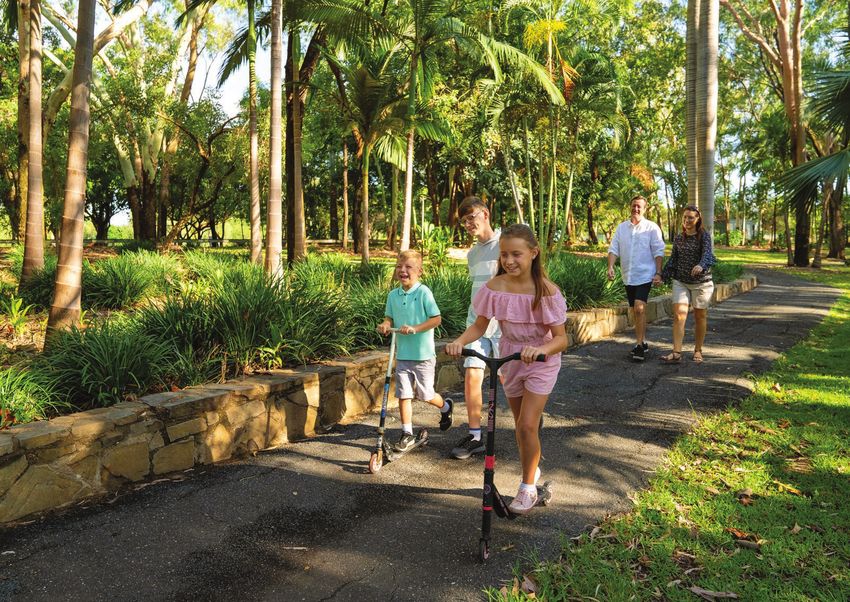
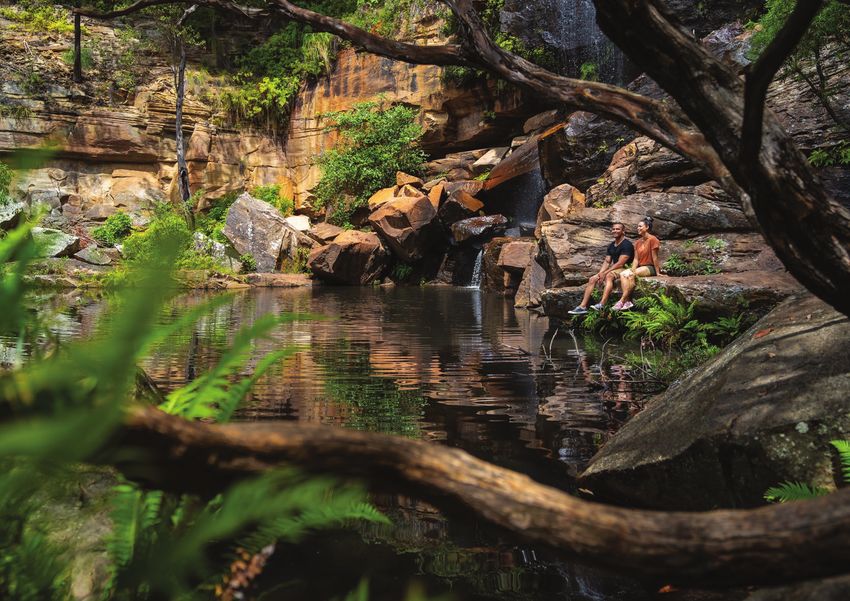
Pristine natural attractions, such as Carnarvon Gorge and the Sapphire Gemfields, are driving an
emerging tourism market.
A population of more than 28,000 with a median age of 33 helps to underpin the Central
Highlands’ economic strength of a skilled, locally-based workforce.
Indicator Central Queensland Period Source (year)
Highlands
Demographics
Estimated resident population 28,645 5,011,216 2018 ABS (2019a)
Projected population 30,133 7,161,661 2041 QGSO (2018b) (Medium series)
Resident population growth 0.2% 1.6% 2016–2041 QGSO (2018b) (Medium series)
(annual average)
Resident and non-resident -0.1% – 2016–2021 QGSO (2018a) (Medium series), QGSO (2018c) &
population growth QGSO (2018d) (Series A)
Median age 33 37 2016 ABS (2017)
Median personal income (weekly) $843 $660 2016 ABS (2017)
Median household income (weekly) $1,823 $1,402 2016 ABS (2017)
Employment
Unemployment rate 4.4% 6.2% 2018 Department of Jobs and Small Business (2019)
Labour force 16,190 2,648,089 2018 Department of Jobs and Small Business (2019)
Non-residential workforce 4,045 – 2018 QGSO (2018c)
Industry
Gross regional product $3.93bn $348.97bn 2018 REMPLAN (2019)
Passengers Emerald Airport 206,748 – 2017–18 CHRC (2019)
4 Central Highlands QLD 2019 Economic Profile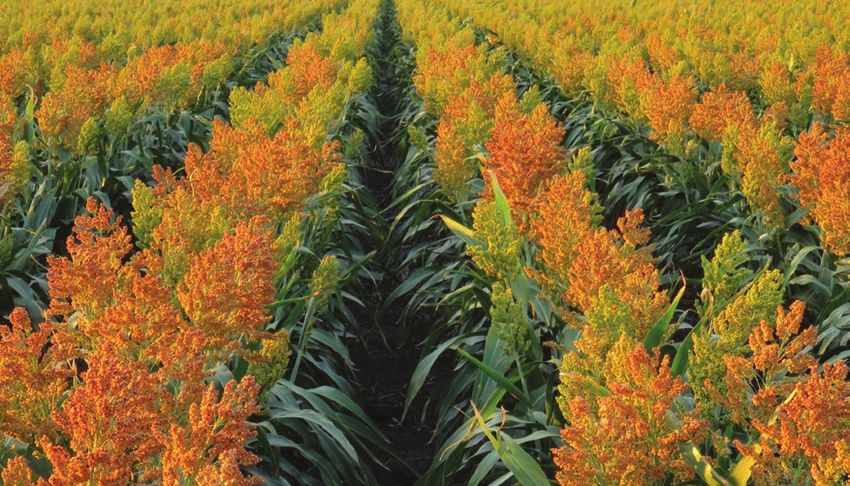
Demographics

Population

+0.2%                                   +0.2%                                 30,133                             The Central Highlands
                                                                                                                 population is predicted
Population growth                       Forecast population                   Population                         to remain steady in
per year from                           growth per year from                  by 2041                            contrast to the state
2008 to 2018                            2016 to 2041                                                             average

Population
The estimated resident population in the Central Highlands as at 30 June 2018 is 28,645 people. Between 2008 and
2018 the Central Highlands (estimated resident) population increased by 555 people (2.0%), with an average annual
compound population growth of 0.2% between 2008 and 2018. The Central Highlands population peaked at 29,782 in
2013 and began to experience a decline thereafter.

35,000

30,000                                        29,541     29,741      29,782       29,598
                       28,714      29,082                                                    29,143     28,690      28,604          28,645
            28,090

25,000

20,000

15,000

10,000

5,000

0                                                                                                                                            Year
             2008      2009         2010       2011      2012         2013         2014      2015        2016        2017           2018

Source: ABS (2019a)

Population projections
Queensland Government population projections, 2018 edition (medium series) were released in November 2018.

Between 2016 and 2041, the population of the Central Highlands is projected to increase by 1,350 people. This is
equivalent to an annual average increase of 0.2% between 2016 and 2041.

Population projections by age cohort – Central Highlands

    Year                        0–14            15–29             30–49             50–64             65–79                  80+              Total

    2016                        7,227           5,743             8,848              4,878             1,775                 312             28,783

    2021                        6,984           5,544             8,395              4,945            2,320                  470             28,658

    2026                        6,616           5,657             8,239              4,808            2,842                  682             28,845

    2031                        6,503           5,743              8,315             4,618             3,181                 959             29,319

    2036                        6,513            5,714            8,309              4,666             3,317                1,236            29,755

    2041                        6,542           5,603             8,402              4,756            3,315                 1,514            30,133

    2016–2041                   -685             -140              -446               -122            1,540              1,202               1,350

Source: QGSO (2018b)

                                                                                                      Central Highlands Development Corporation       5
Demographics
Population projections
65–79 years The majority of the
Central Highlands
Age group projected to experience population sits within
the largest increase in population the workforce working
from 2016 to 2041 (1,540 people) age demographic of 15–65
Population projections by age cohort – Central Highlands
2016 2026 2036 2041
10,000
8,000
8,848
8,402
8,309
8,239
7,227
6,000
6,616
6,542
6,513
5,743
5,714
5,657
5,603
4,878
4,000
4,808
4,756
4,666
3,317
3,315
2,000
2,842
1,514
1,236
1,775
682
312
0 Age
0–14 15–29 30–49 50–64 65–79 80+
Source: QGSO (2018b)
Population growth comparison
Central Highlands Central Queensland SA4 Queensland
2.00
1.75
1.7%
1.5% 1.6%
1.50 1.5%
1.4%
1.25
1.1%
1.00 1.0%
0.9% 0.9%
0.75
0.50
0.4%
0.3% 0.3% 0.3%
0.25
0.1%
0 Year
2016–2021 2021–2026 2026–2031 2031–2036 2036–2041
-0.25 -0.1%
Source: QGSO (2018a)
For each five year period from 2016 to 2041, the annual average population growth in the Central Highlands is projected to gradually
increase then remain steady. The annual average population growth in Central Queensland SA4 (comprising the Banana, Central
Highlands, Gladstone, Livingstone, Rockhampton and Woorabinda LGAs) and Queensland are projected to gradually decline.
Average annual population growth in the Central Highlands is estimated to be lower than the surrounding Central Queensland SA4
and broader Queensland projections.
6 Central Highlands QLD 2019 Economic ProfileDemographics
Non-resident population
3.6% vs 0.2% 4,045
Average annual growth of the non-resident The non-resident population
population of 3.6% has outpaced resident currently sits at 4,045.
population growth of 0.2% from 2008 to 2018
Non-resident population
The estimated non-resident population in the Central Highlands as at 30 June 2018 is 4,045 people. The average
annual non-resident population growth between 2008 and 2018 of 3.6% is significantly higher than the resident
population growth over the same period at 0.2%.
Estimated resident population Non-resident workers on shift
40,000
2,840
35,000 5,585
4,835 4,740
3,380 3,955 4,045
3,225 3,150 3,360
2,840 2,680
30,000
29,082 29,541 29,741 29,782 29,598 29,143
28,090 28,714 28,690 28,604 28,645
25,000
20,000
15,000
10,000
5,000
0 Year
2008 2009 2010 2011 2012 2013 2014 2015 2016 2017 2018
Source: ABS (2019a) and QGSO (2018c)
Non-resident population projections
Between 2016 and 2021, the non-resident population of the Central Highlands is projected to decrease by 100 people.
When combined with the forecasted resident population growth, total full-time equivalent population growth in the
Central Highlands between 2016 and 2021 is projected to decrease by 132 people (average annual growth of -0.1%).
4,000
3,500
3,360
3,150 3,230
3,110 3,110
3,000 3,050 3,000 3,000 3,000
2,500
2,000
1,500
1,000
500
0 Year
2016 2017 2018 2019 2020 2021 2022 2023 2024
Source: QGSO (2018d)
Central Highlands Development Corporation 7Demographics
Age
The proportion
of retirees in the 60–69 years old 33
Central Highlands Age group has experienced the Average age compared
(7.6%) is lower than most growth from 2011 to 2016 to the national
Queensland (15.3%) average of 37
The following demographic section is based on Place of Usual Residence data obtained from the 2016 ABS Census, the latest
data available. The 2016 ABS Census was held on 9 August 2016 and data from the 2016 Census was released from mid-2017.
Age distribution Change in age distribution, 2011 to 2016
Analysis of the age structure of the Central Highlands Between 2011 and 2016, the Central Highlands’ population
residents in 2016 compared to Queensland shows there is a decreased by 713 people. The largest changes in age structure
larger proportion of residents aged less than 15 years (24.7%, in this area between 2011 and 2016 were in the age groups:
compared to 19.4% in Queensland). The Central Highlands
• 35 to 49 (-473 persons)
also comprises a higher proportion of 25 to 54 year olds
than Queensland (45.5%, compared to 40.5%). Conversely, the • 15 to 19 (-330 persons), and
proportion of retirees (those aged 65 years and over) in the
• 60 to 69 (+264 persons).
Central Highlands (7.6%) is lower than Queensland (15.3%).
Central Highlands Queensland
9.0%
0–4 0–4 -192
6.3%
8.9%
5–9 5–9 173
6.7%
6.9%
10–14 10–14 -115
6.4%
5.6%
15–19 15–19 -330
6.3%
6.1%
20–24 20–24 -227
6.7%
16.5%
25–34 25–34 -182
13.8%
21.9%
35–49 35–49 -473
20.2%
13.0%
50–59 50–59 146
12.8%
7.5%
60–69 60–69 264
10.7%
4.1%
70–84 70–84 206
8.3%
0.5%
85+ 85+ 17
1.8% % of population Persons
0 5 10 15 20 25 30 -600 -400 -200 0 200 400
Source: ABS (2017) Source: ABS (2017)
8 Central Highlands QLD 2019 Economic ProfileDemographics
Origin
There is a higher proportion
of Aboriginal people in the
Central Highlands (4.0%)
compared to Queensland (3.2%)
Indigenous status Country of birth
Analysis of the Indigenous status of Central Analysis of the country of birth of Central Highlands’ residents shows a
Highlands’ residents in 2016 compared to higher proportion of residents born in Australia (76.0%, compared to 71.1% in
Queensland shows that there is a higher Queensland). The top 10 countries of birth for Central Highlands’ residents
proportion of Aboriginals in the Central include Australia, New Zealand, England, Philippines, South Africa, India,
Highlands (4.0%, compared to 3.2% in Zimbabwe, Papua New Guinea, United States of America, and Germany.
Queensland). Overall, the local Indigenous
population accounts for 4.3% of the total
Central Highlands’ population, which is
slightly higher than Queensland (4.0%).
% of population Central Highlands % of population Central Highlands
90 Queensland 90 Queensland
89.5%
80 80
83.4%
76.0%
70 70
71.1%
60 60
50 50
40 40
30 30
20 20
12.3%
10 10
6.5%
4.3%
4.0%
3.8%
3.7%
3.2%
1.3%
0.9%
0.8%
0.8%
1.0%
0.5%
1.1%
0.4%
0.4%
0.4%
0.4%
0.2%
0.2%
0.3%
0.3%
0.2%
0.2%
0.2%
0.2%
0 0
Non-
Indigenous
Aboriginal
Torres Strait
Islander
Both Aboriginal
and Torres
Strait Islander
Not stated
Australia
New Zealand
England
Philippines
South Africa
India
Zimbabwe
Papua
New Guines
United States
of America
Germany
Source: ABS (2017) Source: ABS (2017)
Central Highlands Development Corporation 9Demographics
Origin
Population growth in the
Central Highlands is being 8,635
driven by arrivals from People migrated to the Central Highlands from
overseas, as well as other outside of Queensland. The second highest group of
intrastate locations migrants to the Central Highlands was from overseas
Migration
Of the population living in the Central Highlands, 15,749 (56.2%) also lived in the Central Highlands five
years ago. The largest migration of residents to the Central Highlands over the five year period from 2011 to
2016 from outside of the LGA was from residents who had previously lived overseas (725 people, or 2.6% of
total Central Highlands’ residents), followed by residents from Rockhampton (452 people, or 1.6% of total
Central Highlands’ residents). The largest migration of residents to the Central Highlands from outside of
Queensland was from Tweed in New South Wales (31 people, or 0.1% of total Central Highlands residents).
Central
15,749
Highlands (R)
Overseas 725
Rockhampton (R) 452
Isaac (R) 419
Brisbane (C) 376
Mackay (R) 349
Livingstone (S) 246
Sunshine Coast
217
(R)
State undefined
184
(QLD)
Moreton Bay (R) 174
Gold Coast (C) 163
Townsville (C) 158
Bundaberg (R) 155
Other 8,635
Persons
0 2,500 5,000 7,500 10,000 12,500 15,000 17,500
Source: ABS (2017)
10 Central Highlands QLD 2019 Economic ProfileDemographics
Wellbeing
Top 28%
The SEIFA Index of Disadvantage for the
Central Highlands is 1,006 and is in the top
28% of least disadvantaged LGAs in Australia
Need for assistance
Of the population living in the Central Highlands, 717 people (2.6%) have a need for assistance due to a profound
disability, long term health condition or age. This is half the proportion of the population in Queensland with a need
for assistance, reflective of a younger population profile in the Central Highlands.
Central Highlands Queensland
Has need for 2.6%
assistance with
core activities 5.2%
Does not have 84.3%
need for assistance
with core activities 87.3%
13.1%
Not stated
7.6% % of population
0 10 20 30 40 50 60 70 80 90 100
Source: ABS (2017)
SEIFA (Disadvantage) SEIFA score
Socio Economic Indexes for Areas (SEIFA) is 500 1,200
a suite of indexes that has been created by
the Australian Bureau of Statistics (ABS) from
social and economic Census information.
Each index ranks geographic areas across
Australia in terms of their relative socio-
economic advantage and disadvantage. This
report presents information from the Index
of Relative Socio-economic Disadvantage
(IRSD), a general socio-economic index that
summarises a range of information about the
economic and social conditions of people
and households within an area. This index
includes measures of relative disadvantage
only and is not evidence of relative advantage.
The SEIFA index of disadvantage for the
Central Highlands (R) is 1,006. The local
government area index of the Central
Highlands (R):
• Ranks 393 out of 544 local government
areas with SEIFA scores in Australia
• There are 151 local government areas
which are less disadvantaged, and
• There are 392 local government areas that
are more disadvantaged.
Central Highlands Development Corporation 11Demographics Wellbeing Tieri The Gemfields The least disadvantaged The most disadvantaged localities are locality in the Central The Gemfields (788) and Willows (828) Highlands (1,092) Of 60 suburbs and localities located within the Central Highlands with a resident population, the least disadvantaged suburb is Tieri (1,092) and the most disadvantaged suburb is The Gemfields (788) followed by Willows (828). SEIFA Disadvantage 2016 Localities Score National rank 2016 Localities Score National rank The Gemfields SSC 32819 788 296 / 13,691 Minerva SSC 31869 1,041 9,643 / 13,691 Willows SSC 33110 828 441 / 13,691 Comet SSC 30661 1,052 10,514 / 13,691 Duaringa SSC 30889 931 2,090 / 13,691 Albinia SSC 30023 1,064 11,437 / 13,691 Bingegang SSC 30257 961 3,415 / 13,691 Arcturus SSC 30081 1,064 11,438 / 13,691 Dingo SSC 30852 961 3,417 / 13,691 Cairdbeign SSC 30480 1,064 11,439 / 13,691 Bluff SSC 30296 971 4,005 / 13,691 Orion SSC 32252 1,064 11,443 / 13,691 Balcomba SSC 30122 975 4,262 / 13,691 Carbine Creek SSC 30538 1,072 11,971 / 13,691 Barnard SSC 30168 975 4,263 / 13,691 Chirnside SSC 30608 1,072 11,972 / 13,691 Boolburra SSC 30321 975 4,264 / 13,691 Hibernia SSC 31338 1,072 11,977 / 13,691 Coomoo SSC 30697 975 4,269 / 13,691 Theresa Creek (Qld) SSC 32836 1,072 11,979 / 13,691 Gainsford SSC 31104 975 4,272 / 13,691 Buckland (Qld) SSC 30408 1,075 12,126 / 13,691 Goowarra SSC 31219 975 4,273 / 13,691 Cona Creek SSC 30665 1,075 12,127 / 13,691 Mackenzie SSC 31742 975 4,278 / 13,691 Mantuan Downs SSC 31769 1,075 12,130 / 13,691 Capella SSC 30534 983 4,813 / 13,691 Nandowrie SSC 32120 1,075 12,131 / 13,691 Blackwater SSC 30283 987 5,085 / 13,691 Wealwandangie SSC 33047 1,075 12,133 / 13,691 Springsure SSC 32658 997 5,911 / 13,691 Belcong SSC 30210 1,077 12,243 / 13,691 Central Highlands (R) 1,006 393 / 544 Bundoora (Qld) SSC 30431 1,077 12,244 / 13,691 Arcadia Valley SSC 30078 1,023 8,071 / 13,691 Crinum SSC 30757 1,077 12,245 / 13,691 Consuelo SSC 30672 1,023 8,075 / 13,691 Khosh Bulduk SSC 31535 1,077 12,248 / 13,691 Humboldt SSC 31385 1,023 8,079 / 13,691 Lilyvale SSC 31673 1,077 12,249 / 13,691 Jellinbah SSC 31451 1,023 8,080 / 13,691 Lowestoff SSC 31713 1,077 12,250 / 13,691 Lowesby SSC 31712 1,023 8,081 / 13,691 Mount Macarthur SSC 32006 1,077 12,252 / 13,691 Rewan SSC 32445 1,023 8,082 / 13,691 Retro SSC 32444 1,077 12,254 / 13,691 Stewarton (Qld) SSC 32686 1,023 8,083 / 13,691 Wyuna (Qld) SSC 33220 1,077 12,256 / 13,691 Togara SSC 32867 1,023 8,084 / 13,691 Tieri SSC 32853 1,092 12,929 / 13,691 Argyll SSC 30083 1,025 8,250 / 13,691 Alsace SSC 30046 No score Lochington SSC 31687 1,025 8,256 / 13,691 Blackdown SSC 30277 No score Emerald (Qld) SSC 30982 1,026 8,336 / 13,691 Carnarvon Park SSC 30547 No score Rolleston SSC 32485 1,031 8,775 / 13,691 Cheeseborough SSC 30591 No score Bauhinia SSC 30185 1,040 9,551 / 13,691 Coorumbene SSC 30714 No score Goomally SSC 31203 1,040 9,558 / 13,691 Cotherstone SSC 30735 No score Mimosa (Qld) SSC 31865 1,040 9,560 / 13,691 Dromedary (Qld) SSC 30887 No score Mungabunda SSC 32087 1,040 9,562 / 13,691 Fork Lagoons SSC 31080 No score Oombabeer SSC 32244 1,040 9,563 / 13,691 Gordonstone SSC 31223 No score Rhydding SSC 32446 1,040 9,564 / 13,691 Wallaroo (Qld) SSC 32996 No score Gindie SSC 31137 1,041 9,641 / 13,691 Wooroona SSC 33189 No score 12 Central Highlands QLD 2019 Economic Profile
Demographics

Education

Central Highlands’
residents
                                        The largest increase in
                                        qualifications from 2011              31.0%
predominantly                           to 2016 was for residents             of the population hold
hold Certificate                        with Graduate Diplomas                educational qualifications
qualifications                          and Graduate Certificates

Qualifications
Analysis of the qualifications of the population in the Central Highlands compared to Queensland shows 7.8%
of Central Highlands’ residents with a Bachelor Degree or higher, compared to 14.7% in Queensland. A higher
proportion of Central Highlands’ residents hold a Certificate qualification (18.8%) compared to Queensland (17.2%).

Overall, 31.0% of the population hold educational qualifications, and 57.0% hold no qualifications, compared with
38.9% and 52.4%, respectively for Queensland.
     Central Highlands                 Queensland

Postgraduate             0.8%
Degree                     2.9%

Graduate Diploma         0.8%
and Graduate
Certificate              1.4%

Bachelor                           6.2%
Degree                                      10.5%

Advanced                        4.5%
Diploma and
Diploma                             7.0%

                                                          18.8%
Certificate
                                                        17.2%

Inadequately                                    12.1%
described/
not stated                              8.7%

                                                                                                                  57.0%
No qualifications
                                                                                                         52.4%                           % of population
                     0                     10               20           30           40           50                 60                  70
Source: ABS (2017)

Change in Qualifications, 2011 to 2016
The largest changes in the qualifications of the population of the Central Highlands between 2011 and 2016 are in those with:
•   No Qualifications (-1,363 persons)
•   Graduate Diplomas and Graduate Certificates (+53 persons), and
•   Postgraduate Degrees (+38 persons).

Postgraduate
                                                                                                                                38
Degree
Graduate Diploma
                                                                                                                                    53
and Graduate
Bachelor
                                                                                                                               29
Degree
Advanced Diploma
                                                                                                                               18
and Diploma

Certificate                                                                                                                    20

No qualifications         -1,363
                                                                                                                                               Persons

                     -1,400               -1,200         -1,000   -800         -600         -400           -200            0                   200
Source: ABS (2017)

                                                                                                        Central Highlands Development Corporation 13
Demographics
Income and families
23.0% The Central Highlands
comprises a higher
of Central Highlands’ proportion of couple
residents earn families with children than
$1,500 per week or more the Queensland average
Weekly Individual Income
Analysis of individual income levels in the Central Highlands in 2016 compared to Queensland shows that the
median weekly income is higher for local residents when compared to the broader State; $843 vs $660.
Overall, 23.1% of persons earn a low income (less than $400 per week) and 23.0% earn a high income ($1,500 or more
per week), compared to 28.4% and 15.1%, respectively in Queensland.
Central Highlands Queensland
% of population
20
16.4%
15.4%
15
13.7%
11.5%
9.4%
9.4%
10
8.7%
8.5%
8.5%
8.0%
8.0%
8.0%
7.9%
7.7%
7.1%
7.1%
6.8%
6.3%
6.2%
5.7%
5.6%
5.1%
5
4.1%
3.9%
0.7%
0.5%
0
Negative Nil $1 to $149 $150 to $300 to $400 to $650 to $800 to $1,000 to $1,249 to $1,500 to $2,000 or Not
income $299 $399 $649 $799 $999 $1,249 $1,499 $1,999 more stated
Source: ABS (2017)
Family Composition
Central Highlands comprises a higher proportion of couple families with children (51.1%) when compared with
Queensland (42.5%), and a lower proportion of couple families with no children (36.6%) compared with Queensland (39.4%).
Overall, 11.1% of families are one parent families, and 1.2% are other families, compared with 16.5% and 1.6%, respectively
for Queensland.
Central Highlands Queensland
Couple family 36.6%
with no children 39.4%
Couple family 51.1%
with children 42.5%
One parent 11.1%
family 16.5%
1.2%
Other family
1.6% % of families
0 10 20 30 40 50 60
Source: ABS (2017)
14 Central Highlands QLD 2019 Economic ProfileDemographics
Dwelling tenure and structure
Rented dwellings
represent the highest 45.6%
proportion of dwelling of dwellings are
tenure in the Central owned outright or with
Highlands a mortgage
Dwelling Tenure Dwelling Structure
Analysis of the housing tenure of dwellings in the Central As at 2016, there are 10,713 separate houses in the Central
Highlands in 2016 compared to dwellings in Queensland Highlands; 1,657 medium density dwellings, 6 high density
shows there is a larger proportion of rented dwellings or dwellings, 938 caravans, cabins or houseboats; and 38 other
dwellings under other tenure types. This is reflective of the dwellings.
large non-resident workforce in the region, who are renting or
There is a significantly higher proportion of ‘Caravan, cabin,
living in various short term accommodation arrangements.
houseboat’ dwellings in the Central Highlands (6.8%) compared
Overall, 45.6% of dwellings are owned outright or with a to Queensland (2.1%). This can be attributed to the large
mortgage, 34.6% are being rented and 6.3% are other tenure number of non-residents staying in employer-provided
types, compared to 58.6%, 31.3% and 2.0%, respectively in accommodation while working in the region.
Queensland.
Central Highlands Queensland Central Highlands Queensland
Owned outright Separate house
22.0% 77.4%
27.4% 73.7%
Owned with a mortgage Medium density
23.5% 12.0%
31.3% 15.7%
Rented High density
34.6% 0.0%
31.3% 7.8%
Other tenure type Caravan, cabin, houseboat
6.3% 6.8%
2.0% 2.1%
Not stated Other
13.6% 0.3%
8.2% 0.2%
% of dwellings
0 10 20 30 40
Not stated
Source: ABS (2017)
3.6%
0.6%
% of dwellings
0 20 40 60 80 100
Source: ABS (2017)
Central Highlands Development Corporation 15Employment
Industry
Mining The Agriculture,
Within the Central Highlands forestry & fishing sector
workforce, the Mining sector experienced the largest
comprises the largest increase in jobs from
number of employees 2011 to 2016
The following graphs illustrate the profile of employed people whose place of work is located within the Central Highlands.
This includes residents and non-residents.
Employment by industry Change in jobs by industry sector,
The total employment estimate for the Central Highlands as at
2011 to 2016
the 2016 Census is 17,019 jobs. The ‘Mining’ sector comprises Between the 2011 and 2016 Census periods, there was a net
6,079 jobs, followed by the ‘Agriculture, forestry & fishing’ decrease of 2,239 jobs in the Central Highlands.
sector (1,791 jobs) and the ‘Retail trade’ sector (1,184 jobs).
Mining 6,079 Mining -564
Agriculture, Agriculture,
forestry & fishing
1,791 forestry & fishing
180
Retail trade 1,184 Retail trade -54
Education & Education &
training
1,132 training
140
Accommodation & Accommodation &
food services
1,010 food services
-125
Construction 971 Construction -1,112
Health care & Health care &
social assistance
768 social assistance
18
Other services 660 Other services -120
Transport, postal & Transport, postal &
warehousing
627 warehousing
-130
Public administration Public administration
& safety
602 & safety
-5
Administrative & Administrative &
support services
469 support services
16
Professional, scientific Professional, scientific
& technical services
374 & technical services
-118
Wholesale trade 342 Wholesale trade -97
Manufacturing 325 Manufacturing -258
Rental, hiring & Rental, hiring &
real estate services
268 real estate services
-20
Electricity, gas, water Electricity, gas, water
& waste services
144 & waste services
31
Financial & insurance Financial & insurance
services
126 services
-32
Arts & recreation Arts & recreation
services
84 services
10
Information media & Information media &
telecommunication
63 telecommunication
1
Jobs Jobs
0 1,000 2,000 3,000 4,000 5,000 6,000 7,000 -1,200 -1,000 -800 -600 -400 -200 0 200
Source: ABS (2017) Source: ABS (2017)
16 Central Highlands QLD 2019 Economic ProfileEmployment
Industry
17,019 Mining
The Central Highlands has a is the largest employer of both
total workforce of 17,019, with the resident (22.2%) and
67.3% of workers residing locally non-resident (63.6%) workforce
Industry Sector Total jobs Resident workforce Non-resident workforce
% Change % Change % Change
No. from 2011 No. from 2011 No. from 2011
Agriculture, forestry & fishing 1,791 11.2% 1,530 7.4% 261 40.0%
Mining 6,079 -8.5% 2,545 -24.3% 3,534 7.7%
Manufacturing 325 -44.3% 204 -49.4% 121 -32.8%
Electricity, gas, water & waste services 144 27.4% 121 32.7% 23 5.6%
Construction 971 -53.4% 613 -37.3% 358 -67.6%
Wholesale trade 342 -22.1% 266 -20.7% 76 -26.5%
Retail trade 1,184 -4.4% 1,073 2.0% 111 -40.4%
Accommodation & food services 1,010 -11.0% 831 -7.3% 179 -25.0%
Transport, postal & warehousing 627 -17.2% 500 -11.6% 127 -33.7%
Information media & telecommunications 63 1.6% 39 -28.1% 24 221.6%
Financial & insurance services 126 -20.3% 104 -27.1% 22 40.7%
Rental, hiring & real estate services 268 -6.9% 203 -18.2% 65 62.6%
Professional, scientific & technical services 374 -24.0% 299 -24.5% 75 -22.0%
Administrative & support services 469 3.5% 320 4.2% 149 2.1%
Public administration & safety 602 -0.8% 522 -0.8% 80 -0.7%
Education & training 1,132 14.1% 1,023 11.6% 109 44.9%
Health care & social assistance 768 2.4% 667 3.0% 101 -1.6%
Arts & recreation services 84 13.5% 66 7.6% 18 43.2%
Other services 660 -15.4% 535 -7.8% 125 -37.3%
Total 17,019 -11.6% 11,461 -11.8% 5,558 -11.4%
Source: REMPLAN (2019)
Central Highlands Development Corporation 17Employment
Occupation
4.4% The Central Highlands
workforce is dominated by
The unemployment rate has Machinery Operators and
increased from 2.4% in 2009 Drivers and Technicians and
to 4.4% in 2018 Trades Workers
Unemployment rate
The unemployment rate in the Central Highlands in 2018 was 4.4%. From 2009 to 2018, the unemployment rate in
the Central Highlands has ranged from a low of 2.4% in 2009 to a peak of 5.0% in 2015.
Central Highlands Central Queensland SA4 Queensland
8.0%
7.0%
6.0%
5.0%
4.0%
3.0%
2.0%
1.0%
0 Year
2009 2010 2011 2012 2013 2014 2015 2016 2017 2018
Source: Department of Jobs and Small Business (2019); ABS (2019b)
Occupation
Compared to the Central Queensland SA4 and State averages, the Central Highlands has a higher proportion of
‘Technicians and Trades Workers’ and ‘Machinery Operators and Drivers’.
Work in the Central Highlands Work in Central Queensland SA4 Work in Queensland
% of workers
30
24.5%
25
21.0%
20.3%
18.3%
20
14.6%
14.2%
13.7%
15
12.5%
12.2%
12.1%
12.1%
11.7%
12.0%
11.3%
10.5%
10.2%
10.1%
10.1%
9.9%
9.0%
10
8.7%
6.8%
6.4%
5.9%
5
0.8%
0.8%
0.6%
0
Managers Professionals Technicians & Community & Clerical & Sales workers Machinery Labourers Not stated/
trade workers personal administrative operators & inadequately
service workers drivers described
Source: REMPLAN (2019)
18 Central Highlands QLD 2019 Economic ProfileEmployment
Age and qualifications
25–44 yrs
Workers in the Central
Highlands are predominantly
in the 25 to 44 year age group
Age Qualifications
The workforce age profile for the Central Highlands Workers in the Central Highlands have a lower representation
shows a higher proportion of workers in the 25 to 44 of graduate qualifications (Bachelor Degree and higher)
year age group compared to the Central Queensland SA4 when compared to the Central Queensland SA4 and State
and State benchmarks. averages. A higher proportion of workers have Certificate or
No Qualifications in comparison to these benchmark areas.
Work in the Central Highlands
Work in the Central Highlands
Work in Central Queensland SA4
Work in Central Queensland SA4
Work in Queensland
Work in Queensland
4.7% 1.2%
Postgraduate
15–19 6.4% 2.2%
Degree
5.9% 5.0%
8.4% Graduate 0.9%
Diploma and
20–24 9.1% 1.8%
Graduate
9.7% Certificate 2.5%
24.1% 10.2%
Bachelor
25–34 21.4% 12.4%
Degree
21.8% 18.1%
25.0% 6.6%
Advanced
35–44 21.8% Diploma and 8.3%
Diploma
22.0% 11.0%
22.1% 36.7%
45–54 22.7% Certificate 32.5%
21.9% 26.4%
13.1% 42.6%
No
55–64 15.4% 40.5%
qualifications
14.9% 34.6%
% of workers
0 10 20 30 40 50
2.3%
65–74 2.9% Source: REMPLAN (2019)
3.5%
0.2
Over 0.4%
0.4%
% of workers
0 5 10 15 20 25 30
Source: REMPLAN (2019)
Central Highlands Development Corporation 19Employment
Method of travel to work
67.3% 65.9%
of the population of workers travel by car
live and work to work
in the region
Breakdown of the Central Highlands’ workforce
Of the 17,019 jobs in the Central Highlands, 11,461 workers (67.3%) also live in the region. Approximately 32.7% of
workers (5,558 workers) in the Central Highlands live outside of the region. This is significantly higher than
Central Queensland SA4 (12.8%) and is indicative of the large proportion of non-resident workers in the region.
Central Highlands Central Queensland SA4
Work and 67.3%
live in region 87.2%
Work in region, 32.7%
live elsewhere 12.8%
% of workers
0 10 20 30 40 50 60 70 80 90 100
Source: REMPLAN (2019)
Method of travel to work
Over 98.7% of the Central Highlands’ workforce use the following methods to travel to work. Approximately 65.9%
of workers travel by car (either as driver or passenger), 6.2% work from home and 5.6% of workers use the bus.
(One method)
10,185
Car, as driver
Did not
2,321
go to work
Worked at home 1,047
(One method)
1,023
Car, as passenger
(One method)
954
Bus
(One method)
781
Walked only
(One method)
171
Other
(One method)
113
Truck
(Two methods)
Bus and car 107
as driver
(Two methods)
96
Car and other
Jobs
0 2,000 4,000 6,000 8,000 10,000 12,000
Source: REMPLAN (2019)
20 Central Highlands QLD 2019 Economic ProfileIndustry
Output
$8.419 bn 59.9%
Output generated Mining contributes 59.9% of
total output in the Central
Highlands
Output
Output data represents the gross revenue generated by Mining $5,046.981
businesses/organisations in each of the industry sectors in
Agriculture,
a defined region. forestry & fishing
$520.966*
The output generated by the Central Highlands’ regional Construction $490.302
economy is estimated at $8.419 billion.
Rental, hiring &
real estate services
$474.416
The 2016–17 Agribusiness Snapshot identifies that the Central
Highlands conservatively delivered approximately $839 million Manufacturing $300.006
in agricultural value (ACIL Allen based on ABS, 2016–17). Due
Transport, postal &
to the problematic nature of data collected for agriculture warehousing
$207.189
in the region, CHDC commissions an annual comprehensive Accommodation &
$173.494
Agribusiness Regional Stocktake which provides accurate food services
information on production and business data trends across Education &
training
$152.760
key agricultural commodities for the Central Highlands, and is
available from the CHDC website. Retail trade $138.990
Administrative &
support services
$133.459
Wholesale trade $132.216
Public administration
& safety
$116.290
Electricity, gas, water
& waste services
$101.647
Health care &
social assistance
$99.031
Other services $98.907
Professional, scientific
& technical services
$98.560
Financial & insurance
services
$89.871
Information media &
telecommunication
$31.188
Arts & recreation
services
$12.777
Output ($m)
0 1,000 2,000 3,000 4,000 5,000 6,000
Source: REMPLAN (2019)
*See appendix (p. 45)
Central Highlands Development Corporation 21Industry
Value-added
$3.777 bn 58.0%
Total value-added Mining sector contributes
58.0% of total value-added
for the Central Highlands
Value-added
Value-added data represents the marginal economic value Mining $2,190.264
that is added by each industry sector in a defined region.
Rental, hiring &
Value-added can be calculated by subtracting local real estate services
$298.567
expenditure and expenditure on regional imports from the Agriculture,
$202.060
output generated by an industry sector, or alternatively, by forestry & fishing
adding the Wages & Salaries paid to local employees, the Construction $163.440
gross operating surplus and taxes on products and production.
Value-added by industry sector is the major element in the Education &
$111.658
training
calculation of Gross Regional Product.
Transport, postal &
warehousing
$91.284
The total value-added by the Central Highlands’ regional
economy is estimated at $3.777 billion. Retail trade $84.371
Administrative &
support services
$77.528
Public administration
& safety
$74.930
Accommodation &
food services
$69.224
Financial & insurance
services
$67.842
Health care &
social assistance
$67.831
Wholesale trade $66.709
Manufacturing $53.911
Electricity, gas, water
& waste services
$49.066
Professional, scientific
& technical services
$46.856
Other services $43.851
Information media &
telecommunication
$12.795
Arts & recreation
services
$4.886
Value-added ($m)
0 500 1,000 1,500 2,000 2,500
Source: REMPLAN (2019)
22 Central Highlands QLD 2019 Economic ProfileIndustry
Local expenditure and regional exports
$1.436 bn $5.706 bn
Total local expenditure Total regional export
Local expenditure Regional exports
Local Expenditure data represents the value of intermediate Regional Exports data represents the value of goods and
goods and services purchased by local industry sectors within services exported outside of the region that have been
the region. A high level of local expenditure on intermediate generated by industry sectors within the region. The following
goods and services proportionate to total output is indicative graph depicts the contribution to total regional exports
of well-developed local supply chains and also that any generated by each of the industry sectors ranked from highest
expansion in this sector would typically deliver broad based to lowest.
benefits for the region’s economy.
The total regional export estimate for the Central Highlands is
The total local expenditure estimate for the Central Highlands $5.706 billion.
is $1.436 billion.
Mining $818.427 Mining $4,763.820
Agriculture, Agriculture,
forestry & fishing
$144.289 forestry & fishing
$415.231
Construction $132.075 Manufacturing $120.794
Rental, hiring &
Manufacturing $61.631 real estate services
$79.963
Rental, hiring &
real estate services
$57.351 Construction $73.137
Transport, postal & Accommodation &
warehousing
$33.848 food services
$68.311
Accommodation & Transport, postal &
food services
$21.570 warehousing
$62.919
Education &
Wholesale trade $20.933 training
$39.237
Administrative & Administrative &
support services
$20.361 support services
$20.243
Electricity, gas, water Electricity, gas, water
& waste services
$18.511 & waste services
$18.629
Retail trade $17.940 Wholesale trade $17.232
Other services $16.934 Other services $10.292
Professional, scientific
& technical services
$16.484 Retail trade $5.706
Public administration Professional, scientific
& safety
$14.142 & technical services
$3.830
Education & Financial & insurance
training
$14.090 services
$2.135
Health care & Information media &
social assistance
$11.899 telecommunication
$1.890
Financial & insurance Health care &
services
$6.125 social assistance
$1.229
Information media & Public administration
telecommunication
$5.953 & safety
$1.043
Arts & recreation Arts & recreation
services
$2.951 services
$0.475
Local expenditure ($m) Regional exports ($m)
0 200 400 600 800 1,000 0 1,000 2,000 3,000 4,000 5,000
Source: REMPLAN (2019) Source: REMPLAN (2019)
Central Highlands Development Corporation 23Industry
Regional imports and key industry drivers
$3.206 bn Top 5
Total regional imports Key drivers in terms of regional exports, employment, value-added and local
expenditure on goods and services are: Mining, livestock, grains & other
agriculture, accommodation & food services, retail trade, education & training
Regional imports Key industry drivers
Regional Imports data represents the value of goods and Taking into consideration potential import replacement
services imported into the Central Highlands by businesses/ opportunities as well as current contributions to the regional
organisations in each of the industry sectors. Another way of economy in terms of employment, value-added and local
defining imports is as an outflow of money from the Central expenditure on goods and services (backward linkages), key
Highlands. The following graph depicts the contribution to total industry sectors have been identified. In order to understand
regional imports generated by each of the industry sectors the contributions of industry sectors in more detail, the general
ranked from highest to lowest. 19 industry sector classification has been broken down to the
45 industry sub-sector level. The following key industry
The total regional imports estimate for the Central Highlands is
sub-sectors have been identified as the key drivers of the
$3.206 billion.
Central Highlands region’s economy:
Mining $2,038.290 • Mining
Construction $194.787 • Livestock, Grains & Other Agriculture
• Accommodation & Food Services
Manufacturing $184.463
• Retail Trade
Agriculture,
forestry & fishing
$174.617
• Education & Training
Rental, hiring &
real estate services
$118.498
Accommodation &
food services
$82.699
Transport, postal &
warehousing
$82.056
Wholesale trade $44.574
Other services $38.122
Retail trade $36.679
Administrative &
support services
$35.570
Professional, scientific
& technical services
$35.220
Electricity, gas, water
& waste services
$34.069
Public administration
& safety
$27.218
Education &
training
$27.012
Health care &
social assistance
$19.301
Financial & insurance
services
$15.904
Information media &
telecommunication
$12.440
Arts & recreation
services
$4.940
Regional imports ($m)
0 500 1,000 1,500 2,000 2,500
Source: REMPLAN (2019)
24 Central Highlands QLD 2019 Economic ProfileIndustry
Key industry drivers
17,019
Total jobs estimate for the
Central Highlands
Employment data refers to employed people whose place of work is located within the Central Highlands,
which includes residents and non-residents. It is based on the ABS 2016 Census Place of Work data.
Employment
Employment is a key social outcome of economic development; employment
data represents the number of people employed by businesses/
organisations in each of the industry sectors in the Central Highlands.
The total employment estimate for the Central Highlands is 17,019 jobs.
The key industries contribute 10,859 jobs or 63.8% of total jobs
in the Central Highlands.
9.8%
Livestock, grains & other agriculture (1,662)
Mining (5,871)
Retail trade (1,184)
36.2%
Accommodation & Food Services (1,010)
Education & training (1,132) 34.5%
Other (6,160)
Source: REMPLAN (2019)
5.9%
6.7%
Regional Exports
7.0%
Regional Exports represents the value of goods and services exported
outside of the Central Highlands region that have been generated by local
businesses/organisations. Another way of defining exports is as an inflow of
money into the region.
The total regional export estimate for the region is $5.706 billion. The
selected sectors contribute $5.265 billion (92.3%) of total regional exports. 0.7%
1.2%
7.0%
0.1%
Livestock, grains & other agriculture ($398.52 million)
Mining ($4,753.62 million)
7.7%
Retail trade ($5.71 million)
Accommodation & Food Services ($68.31 million)
Education & training ($39.24 million)
Other ($440.72 million)
Source: REMPLAN (2019)
83.3%
Central Highlands Development Corporation 25Industry
Key industry drivers
$111.66 m $813.163 m
Education & training Mining is the highest contributor
contribution of total in terms of local expenditure
value-added (45 industry sector level)
Value-added
The total value-added estimate for the Central Highlands is $3.777 billion.
The selected sectors contribute $2.614 billion (69.2%) of total value-added.
4.8%
Livestock, grains & other agriculture ($181.21 million)
Mining ($2,168.02 million)
30.8%
Retail trade ($84.37 million)
Accommodation & Food Services ($69.22 million)
Education & training ($111.66 million)
Other ($1,162.59 million)
Source: REMPLAN (2019)
1.8%
3.0%
57.4%
2.2%
Local expenditure
The following graph shows the value of intermediate goods and services
purchased by industry sectors within the Central Highlands. The total local
expenditure estimate for the Central Highlands is $1.436 billion. The selected
sectors contribute $994.424 million (69.3%) of total local expenditure.
8.9%
Livestock, grains & other agriculture ($127.66 million)
Mining ($813.16 million)
30.7%
Retail trade ($17.94 million)
Accommodation & Food Services ($21.57 million)
Education & training ($14.09 million)
Other ($441.09 million)
Source: REMPLAN (2019) 1.0%
1.5%
56.7%
The industry sectors may not necessarily make the largest contributions to 1.3%
the region’s economy at present, however due to well-developed local supply
chains these sectors have a significant capacity to deliver broad based
economic benefits for the region.
26 Central Highlands QLD 2019 Economic ProfileIndustry
Summary indicators and gap analysis
21.5% $3.929 bn $2.944 bn
The Central Highlands GRP for the Total imports by industry
accounts for 21.5% of the Central Highlands region sectors
Central Queensland SA4 GRP
Indicator GRP Output Value-added Regional exports Regional imports
($m) ($m) ($m) ($m) ($m)
Central Highlands $3,929.301 $8,419.049 $3,777.075 $5,706.115 $3,206.459
Central Queensland SA4 $18,234.285 $41,109.946 $17,175.415 $17,662.483 $12,175.192
Queensland $348,969.000 $705,670.707 $325,534.292 $109,808.957 $104,900.706
Source: REMPLAN (2019)
The Central Highlands accounts for: Domestic imports – demand (from rest of Australia) ($m)
• 21.5% of Central Queensland SA4 and 1.1% of Queensland’s
Mining $2,033.183
GRP
• 20.5% of Central Queensland SA4 and 1.2% of Queensland’s Construction $178.303
output Agriculture,
forestry & fishing
$170.652
• 22.0% of Central Queensland SA4 and 1.2% of Queensland’s
Rental, hiring &
value-added real estate services
$101.187
Transport, postal &
• 32.3% of Central Queensland SA4 and 5.2% of Queensland’s warehousing
$71.130
regional exports
Manufacturing $59.823
• 26.3% of Central Queensland SA4 and 3.1% of Queensland’s
regional imports. Wholesale trade $44.143
Accommodation &
food services
$43.479
Import Replacement Opportunities
Other services $37.613
Imports reflect demand in the area’s economy for goods and
services not supplied locally and therefore represent ‘Gaps’ Retail trade $36.679
in local supply chains. Imports from the rest of Australia may
Electricity, gas, water
indicate opportunities for import replacement, increased & waste services
$34.007
value-adding and supply chain development. Supply of these
Administrative &
goods and services is currently feasible in the Australian support services
$31.588
context and may provide a guide to realistic, high value Professional, scientific
$30.434
strategic opportunities to further develop the local economy. & technical services
The total replacement of imports with local production is Public administration
$27.213
& safety
improbable however it may be possible to capture a proportion
of this escape expenditure. Education &
training
$26.848
Total imports by industry sectors in the Central Highlands from Health care &
social assistance
$18.652
the rest of Australia are estimated at $2.944 billion.
Financial & insurance
services
$14.550
Information media &
telecommunication
$9.666
Arts & recreation
services
$4.406
Value of domestic imports ($m)
0 500 1,000 1,500 2,000 2,500
Source: REMPLAN (2019)
Central Highlands Development Corporation 27Industry
Gap analysis
$473.615m $285.454m
Exploration & Mining Support Professional, Scientific &
Services have the largest imports Technical Services in imports
from the ‘rest of Australia’ from the ‘rest of Australia’
External Industry What are the selected local demand sector(s) importing from rest of Australia? ($m)
Sectors Supplying Exploration & mining support services $473.615
to the Region Professional, scientific & technical services $285.454
Financial & insurance services $268.102
In order to identify potential
Technical equipment & appliance manufacturing $176.353
gaps within the region,
Petroleum & coal product manufacturing $166.629
REMPLAN data has been
Transport support services & storage $145.701
applied at the 45 industry
Metal & metal product manufacturing $140.751
sector level. The local
Wholesale trade $130.653
industry sectors import a
Transport $130.596
total of $2.944 billion of
Construction services $110.722
goods and services from the
Construction $104.034
rest of Australia, conversely
Property services $79.971
industry sectors in the rest
Accommodation & food services $79.810
of Australia supply $2.944
Mining $71.816
billion of goods and services
Electricity $68.887
to the local industries as part
Repair, maintenance & other services $63.419
of the process of production.
Public admin., regulatory services, order & safety $55.932
Information media & telecommunication $48.957
Basic chemical, cleaning & polymer manufacturing $42.300
Transport equipment & parts manufacturing $38.636
Retail trade $38.290
Food product manufacturing $37.368
Livestock, grains & other agriculture $28.625
Administrative & support services $21.612
Apparel manufacturing $21.104
Non-metallic mineral product manufacturing $21.101
Saw mill, wood & paper product manufacturing $15.494
Pharmaceutical product manufacturing $15.274
Gas, water & waste services $10.200
Sports, recreation & gambling $9.285
Printing (incl. the reproduction of recorded media) $8.727
Education & training $8.558
Postal & courier pick-up & delivery service $8.172
Beverage product manufacturing $5.241
Agriculture, forestry & fishing support services $3.295
Forestry, fishing & hunting $2.680
Furniture manufacturing $1.919
Other manufactured products $1.578
Heritage, creative & performing arts $0.938
Aquaculture $0.765
Personal services $0.733
Defence $0.131
Residential care & social assistance services $0.128
Rental & hiring services (except real estate) $0.000
Health care services $0.000 ($m)
0 100 200 300 400 500
Source: REMPLAN (2019)
28 Central Highlands QLD 2019 Economic ProfileIndustry
Major projects
The 2018 Development
Register profiles $7.1bn
$5.9 bn $50.5 bn
Mining investment projects account Current total project investment,
of projects in progress
for $5.9 billion of total investment including projects of significance
in the region
projects in the Central Highlands outside of the Central Highlands region
Category Not started ($m) In progress ($m) Completed ($m) Total ($m)
Community Infrastructure $5.18 $6.87 $19.88 $31.93
Retail Construction — — — —
Industrial Construction $18.50 $15.20 — $33.70
Residential Construction — $37.95 — $37.95
Workforce Accommodation Construction — — — —
Road — $55.10 $27.60 $82.70
Flood Restoration and Mitigation $5.00 — $3.60 $8.60
Tourism — — $0.59 $0.59
Mining $5,824.00 — $46.00 $5,870.00
Energy $500.00 $415.00 — $915.00
Water and Sewerage $3.00 $117.00 $6.79 $126.79
CH Subtotal $6,355.68 $647.12 $104.46 $7,107.27
Rail (outside the Central Highlands) — $2,200.00 — $2,200.00
Mining (outside the Central Highlands) $38,349.00 $1,900.00 — $40,249.00
Energy (outside the Central Highlands) $900.00 — — $900.00
Outside CH Subtotal $39,249.00 $4,100.00 — $43,349.00
Grand total $45,604.68 $4,747.12 $104.46 $50,456.27
Source: CHDC (2018)
Based on available information, there is currently $7.1 billion in known major project investment currently underway
or planned for short term development in the Central Highlands.
Moreover, known projects of significance that are located outside of the Central Highlands region that will still have
substantial economic benefits to the region approximate $43.3 billion.
Central Highlands Development Corporation 29Housing
Building approvals
70.8% 47%
Separate house approvals have accounted The value of non-residential approvals has
for approximately 70.8% of total dwelling generally accounted for approximately
approvals from 2007–08 to 2017–18 47% of the total value of building approvals
Number of dwelling approvals
There were 22 new dwelling approvals in 2017–18, an increase of 5 dwellings over the previous 12 months, comprising 22 houses
and no “other” (unit) dwellings. Dwelling approvals peaked in 2012–13 at 422 approvals. Since then the volume of approvals
have experienced a significant decrease caused by trends in global mineral prices that affected the economy of the Central
Highlands. Over the 10 year period from 2007–08 to 2017–18, separate house approvals have accounted for approximately
70.8% of total dwelling approvals. The highest levels of unit approvals occurred in 2011–12 (46% of total approvals).
Houses Other
500
171
400
75
158
300
65
285
200 251
50 47 34
198
186
146 149 155
100
2
11 17 22
0 37 Year
2007–08 2008–09 2009–10 2010–11 2011–12 2012–13 2013–14 2014–15 2015–16 2016–17 2017–18
Source: ABS (2019c)
Value of building approvals
The total value of building approvals during 2017–18 is $18.4 million. The value of residential building approvals
peaked in 2012–13 at $235.9 million. The value of ‘non-residential’ approvals has generally accounted for
approximately 47% of the value of total building approvals.
Residential Non-residential
$250m
119.3
$200m
92.7
98.7
$150m
32.9
$100m 116.7
38.2
19.8
14.9 88.9 84.6
38.5
$50m 65.7 5.8
51.6 50.0 55.5 14.9 8.6
3.7 9.8
6.4
0 17.7 Year
2007–08 2008–09 2009–10 2010–11 2011–12 2012–13 2013–14 2014–15 2015–16 2016–17 2017–18
Source: ABS (2019c)
30 Central Highlands QLD 2019 Economic ProfileYou can also read