A Cross-Cultural Analysis of the Influence of Timbre on Affect Perception in Western Classical Music and Chinese Music Traditions
←
→
Page content transcription
If your browser does not render page correctly, please read the page content below
ORIGINAL RESEARCH
                                                                                                                                             published: 29 September 2021
                                                                                                                                          doi: 10.3389/fpsyg.2021.732865

                                                A Cross-Cultural Analysis of the
                                                Influence of Timbre on Affect
                                                Perception in Western Classical
                                                Music and Chinese Music Traditions
                                                Xin Wang 1*, Yujia Wei 1, Lena Heng 2 and Stephen McAdams 2
                                                1
                                                 School of Music and Recording Art, Communication University of China, Beijing, China, 2 Schulich School of Music, McGill
                                                University, Montreal, QC, Canada

                                                Timbre is one of the psychophysical cues that has a great impact on affect perception,
                                                although, it has not been the subject of much cross-cultural research. Our aim is to
                                                investigate the influence of timbre on the perception of affect conveyed by Western and
                                                Chinese classical music using a cross-cultural approach. Four listener groups (Western
                                                musicians, Western nonmusicians, Chinese musicians, and Chinese nonmusicians; 40
                                                per group) were presented with 48 musical excerpts, which included two musical excerpts
                         Edited by:
                                                (one piece of Chinese and one piece of Western classical music) per affect quadrant from
                       Petri Laukka,            the valence-arousal space, representing angry, happy, peaceful, and sad emotions and
       Stockholm University, Sweden
                                                played with six different instruments (erhu, dizi, pipa, violin, flute, and guitar). Participants
                      Reviewed by:
                                                reported ratings of valence, tension arousal, energy arousal, preference, and familiarity
                     Imre Lahdelma,
                  Durham University,            on continuous scales ranging from 1 to 9. ANOVA reveals that participants’ cultural
                    United Kingdom              backgrounds have a greater impact on affect perception than their musical backgrounds,
                   Diana Mary Blom,
           Western Sydney University,
                                                and musicians more clearly distinguish between a perceived measure (valence) and a felt
                            Australia           measure (preference) than do nonmusicians. We applied linear partial least squares
                 *Correspondence:               regression to explore the relation between affect perception and acoustic features. The
                          Xin Wang
                                                results show that the important acoustic features for valence and energy arousal are
              metero_wx@cuc.edu.cn
                                                similar, which are related mostly to spectral variation, the shape of the temporal envelope,
                   Specialty section:           and the dynamic range. The important acoustic features for tension arousal describe the
         This article was submitted to
                                                shape of the spectral envelope, noisiness, and the shape of the temporal envelope. The
                      Emotion Science,
               a section of the journal         explanation for the similarity of perceived affect ratings between instruments is the similar
               Frontiers in Psychology          acoustic features that were caused by the physical characteristics of specific instruments
           Received: 29 June 2021               and performing techniques.
     Accepted: 01 September 2021
     Published: 29 September 2021               Keywords: timbre, affect perception, cross-cultural, valence, tension arousal, energy arousal
                              Citation:
          Wang X, Wei Y, Heng L and
 McAdams S (2021) A Cross-Cultural
Analysis of the Influence of Timbre on
                                                INTRODUCTION
         Affect Perception in Western
  Classical Music and Chinese Music
                                                Music is an important medium of emotional communication. The expression and perception
                             Traditions.        of musical emotion are related to psychophysical and cultural cues (Balkwill and Thompson,
          Front. Psychol. 12:732865.            1999; Balkwill et al., 2004). Psychophysical cues refer to musical elements that are usually
    doi: 10.3389/fpsyg.2021.732865              represented by designations in conventional musical notation, such as pitch, dynamics, tempo,

Frontiers in Psychology | www.frontiersin.org                                          1                                       September 2021 | Volume 12 | Article 732865
Wang et al.                                                                                                           Influence of Timbre on Emotion

rhythm, instrument (timbre), mode, and harmony. Some                       only on timbre but also on the affect expressed. Wu et al.
psychophysical cues are universal and the basis for emotional              (2014) compared different Western sustaining instruments in
communication between individuals with different cultural                  their expression of eight affects using a paired-comparison
backgrounds. Cultural cues refer to musical expressions formed             method. The results indicated that the violin, trumpet, and
during the development of specific musical cultures, such as               clarinet were the most suitable for expressing happy emotions,
the way the note is terminated and specific articulation                   whereas horns and flutes were more likely to convey sad
(Thompson and Balkwill, 2010). People need to learn special                emotions. Their paper also confirmed that brightness, attack
expression rules in a long-term listening environment to build             time, and odd-even harmonic energy ratio were highly correlated
a relationship between expression rules and affect. The similarities       with affect perception. A subsequent study conducted in Western
and differences in how psychophysical and cultural cues influence          non-sustaining instruments extended this work and found that
perceived affect across cultures is still a topic of concern in            the guitar, harp, and plucked violin were highly related to
academia (Fritz et al., 2009).                                             negative affect. The decay slope and density of harmonics
   Researchers usually use affective models to measure perceived           were significant timbral features of affective perception of
affect through self-report. There are two main affective models:           Western non-sustaining instruments (Chau et al., 2015). The
the categorical and dimensional models. The dimensional model              relationship between timbre and dimensional affect first attracted
can describe continuous perceptual levels and is convenient                attention in 2012. Eerola et al. (2012) used a three-dimensional
for establishing an association between affect and acoustic                affect model and emotional dissimilarity ratings to collect the
features through regression analysis or other methods. The                 affect ratings of isolated instrument sounds with the same
most notable dimensional model, based on circumplex model                  duration, pitch, and dynamics, and explored the relationship
of Russell (1980), combines two core dimensions, valence, and              between acoustic features related to timbre and perceived affect
arousal (Schubert, 1999). The other two-dimensional models                 ratings. Their research indicated that valence and energy arousal
with higher citation rates are the positive and negative affective         could be predicted by linear combinations of a few acoustic
model (Watson et al., 1988) and the tension arousal (tension-              features. The role of timbre and pitch register in perceived
relaxation) and energy arousal (awake-tiredness) model (Thayer,            affect ratings has been examined by McAdams et al. (2017)
1986). Adding a third dimension has been proposed over the                 in an extension of the Eerola et al. (2012) study. They used
years due to drawbacks with the two-dimensional model. In                  137 Western musical tones played at pitch class D# across
the field of music and emotion research, the most convincing               each instrument’s entire pitch range at a forte dynamic level
three-dimensional model is the combination of two-dimensional              and found that various timbral features were important for
models of Russell (1980) and Thayer (1986), which includes                 explaining the three perceived affect ratings. Furthermore, each
valence, tension arousal, and energy arousal. Schimmack and                affect dimension was carried by a distinct set of timbral
Grob (2000) demonstrate that the two-dimensional model does                features. Until now, most research has focused on Western
not adequately capture the structure of affective data in their            music and affect perception in Western participants. Little
study and that the three-dimensional model fares better. They              research has been conducted on affect perception with
propose on the basis of neurophysiological studies that the                non-Western instruments. In a study related to Chinese culture,
degree of tension arousal reflects activity of the activation              Liu and Liu (2011) used the zheng (plucked zither) and xun
system, whereas the degree of energy arousal reflects activity             (vessel flute similar to the ocarina) to play Chinese classical
of the arousal system. Since then, many researchers have                   music and explored the relationship between affect and
confirmed this conclusion and applied this model to music                  physiological indicators. They found that music with different
affective perception experiments (Ilie and Thompson, 2006;                 timbres could successfully induce different affects.
Vuoskoski and Eerola, 2010; Zentner and Eerola, 2010; McAdams                 The cue-redundancy model was proposed based on the
et al., 2017). The three-dimensional model of affect was adopted           relationship between music and emotion in cross-cultural
in this paper.                                                             research (Balkwill and Thompson, 1999). Many cross-cultural
   Since the 1930s, researchers have begun to explore the                  studies have confirmed that participants were sensitive to
association between psychophysical cues and affect perception.             the intended emotion aroused by unfamiliar music through
Psychophysical cues have mainly focused on perceptual elements             attending to psychophysical cues (Argstatter, 2015; Cowen
including loudness (Leman et al., 2005) and roughness (Farbood             et al., 2020) such as tempo and rhythm (Balkwill et al.,
and Price, 2014), and structural elements including mode                   2004; Fritz et al., 2009; Zacharopoulou and Kyriakidou, 2009;
(Fang et al., 2017), harmony (Gabrielsson and Lindström,                   Laukka et al., 2013; Midya et al., 2019), complexity (Balkwill
2010), and tempo (Baraldi et al., 2006; Zhang and Pan, 2017).              et al., 2004), harmonic dissonance (Athanasopoulos et al.,
Although, musicians choose different instruments to express                2021; Lahdelma et al., 2021), and tonality (Laukka et al.,
specific affects, little research has been conducted on the                2013; Egermann et al., 2015; Raman and Dowling, 2017;
influence of timbre on affect perception until the 1990s.                  Midya et al., 2019). Timbre is one of the psychophysical
Researchers have confirmed that timbre is correlated with                  cues that has a great impact on affect perception in cross-
perceived discrete affects. In a study by Behrens and Green                cultural research, although not much research has been
(1993), results showed that participants could identify three              conducted on this. Hu and Yang (2017) explored which
types of affective content in solo improvisations performed                acoustic features predicted perceived affect ratings based on
in four different timbres, and the judgment depended not                   an affect regression model for Western and Chinese pop

Frontiers in Psychology | www.frontiersin.org                          2                                 September 2021 | Volume 12 | Article 732865
Wang et al.                                                                                                             Influence of Timbre on Emotion

songs. Their results revealed that timbre features worked                  Chinese music played by CIs than would Western participants
well for both valence and arousal prediction. Heng (2018)                  (and vice versa) because of familiarity and preference.
studied how timbre functioned in communicating affects in
Western classical and Chinese music traditions. Their research             4. Which acoustic features are most effective for perceiving the
indicated that participants trained in the different musical                 different dimensions of affect based on the cross-cultural dataset in
cultures identified the intended emotion significantly differently,          this study?
and Chinese participants performed more accurately on the                      Musical acoustic features mostly related to timbre and
judgments of affects conveyed by the performances of both                  articulation were extracted to examine the relationship between
the Chinese and Western instrumentalists. If the stimuli and               timbral properties and perceived affect ratings through a linear
participants stemmed from the same culture, participants                   partial least squares regression (PLSR; McAdams et al., 2017;
found it easier to decode musical emotion because they could               Lembke et al., 2019).
draw from both psychophysical and cultural cues. This
phenomenon is known as the in-group advantage, which is
associated with in-group familiarity with a given cultural                 MATERIALS AND METHODS
and social background (Elfenbein and Ambady, 2002;
Argstatter, 2015).                                                         Listening Experiment for Affect Ratings
   The current study aims to extend previous research                      Participants
investigating the influence of timbre on the perception of affect          One hundred and sixty participants took part in this listening
conveyed by Western and Chinese classical music using a                    test. Each listener group had 40 participants (Western musicians:
cross-cultural approach by answering the following four                    aged 18–43 years, 28 female; Western nonmusicians: aged
research questions:                                                        19–37 years, 27 female; Chinese musicians: aged 18–24 years,
                                                                           28 female; Chinese nonmusicians: aged 18–23 years, 23 female).
1. Which musical instruments convey similar perceptions of affect:         Musicians were classified as having more than 5 years of formal
  instruments from the same category or instruments from the               musical training in either the Western tradition (M = 13.53,
  same culture?                                                            SD = 6.71) or the Chinese tradition (M = 9.62, SD = 3.43; Zhang
    Six musical instruments were included in this experiment,              et al., 2020). Nonmusicians were classified as having less than
which were a Chinese bowed chordophone – erhu, a Western                   1 year of formal musical training (Western: M = 0.18, SD = 0.42;
bowed chordophone – violin, a Chinese plucked chordophone                  Chinese: M = 0.28, SD = 0.42). Western musicians had significantly
– pipa, a Western plucked chordophone – guitar, a Chinese                  more years of formal training than Chinese musicians, t
aerophone – dizi, and a Western aerophone – flute. To                      (78) = 2.51, p = 0.016. There was no significant difference in
comprehensively examine the differences in the perception of               years of formal training between Western and Chinese
four types of affect conveyed by these six instruments, participants       nonmusicians, t (78) = 0.91, p = 0.37. Chinese participants were
from different cultural and musical backgrounds, including                 recruited in Beijing and were university students who were
Western and Chinese classical music, were involved in                      raised in China. All Chinese musicians had professionally
this experiment.                                                           studied sight singing and ear training for Western tonal music.
                                                                           All Chinese nonmusicians had listened to different types of
2. Do participants’ cultural or musical backgrounds have a greater
                                                                           Western music, such as pop, rock, classical, blues, R&B, etc.
  impact on affect perception?
                                                                           Among them, 16 participants had listened to Western classical
    Four LGs were included: listeners trained in Western classical
                                                                           music in the concert hall, and 28 participants had passively
music from Canada (hereafter termed Western musicians),
                                                                           listened to Western classical music while doing other things.
listeners trained in Chinese classical music from China (hereafter
                                                                           Western participants who were raised in Canada were recruited
termed Chinese musicians), nonmusicians from Canada (hereafter
                                                                           in Montreal through the student community of McGill University.
termed Western nonmusicians), and nonmusicians from China
                                                                           None of Western participants listed Chinese music as the top
(hereafter termed Chinese nonmusicians). We hypothesized
                                                                           three favorite music genres in either active or passive listening
that there would be significant perceptual differences between
                                                                           situations. All participants met the required hearing threshold
Chinese and Western listeners especially for Chinese music
                                                                           of 20 dB HL by a pure-tone audiometric test with octave-spaced
played by Chinese instruments due to an in-group advantage.
                                                                           frequencies from 125 to 8 kHz (Martin and Champlin, 2000;
The second hypothesis was that musicians would perceive the
                                                                           ISO 398-8, 2004). Participants signed an informed-consent
intended affect more accurately with respect to the intended
                                                                           form and were compensated for their participation.
emotion than would nonmusicians.

3. Do preference and familiarity influence affect perception?              Stimuli
    Previous studies have shown that familiar music induces                Four specific emotions (angry, happy, peaceful, and sad) were
increased pleasantness and low tension-arousal potentials                  selected as representative examples of the affect quadrant of
(McLachlan et al., 2013; Daimi et al., 2020). Moreover, the                valence-arousal space. Two musical excerpts (one piece of
more familiar the music, the more liked the pleasant music                 Chinese and one piece of Western classical music, notations
is. So, we hypothesized that Chinese participants would give               shown in Supplementary Figure S1) per emotion were chosen
higher valence scores and lower tension-arousal scores to                  based on a previous study (Wang, 2018). The stimuli were

Frontiers in Psychology | www.frontiersin.org                          3                                   September 2021 | Volume 12 | Article 732865
Wang et al. Influence of Timbre on Emotion
recorded by having musicians on six different instruments artificial ear with the Brüel and Kjær Type 2205 sound level
interpret the musical excerpts with the four different affects. meter (Brüel $ Kjær, Nærum, Denmark) for sound level testing,
We recorded a total of 48 stimuli with eight musical excerpts and the Chinese experiment used the BSWA BHead230 artificial
and six different instruments. head (BSWA Technology, Beijing, China) with NTi XL2 sound
The stimuli played by Chinese instruments were recorded level meter (NTi Audio, Schaan, Liechtenstein). The sound
in Beijing, and the stimuli played by Western instruments level was about 71 dB SPL (A weighting). The experimental
were recorded in Montréal. To ensure recording environment session was programmed with the PsiExp computer environment
consistency, four recording studios in Beijing and three recording (Smith, 1995).
studios in Montréal were respectively tested for reverberation
time T60 (a measure of the time required for the sound in Procedure
a room to decay by 60 dB), and the two recording studios The experimental procedure was explained to the participants
with the most similar reverberation times were selected. The who completed four practice trials prior to the formal experiment
reverberation times T60 of the two recording studios within to become familiar with the interface operation. Participants
each octave band are shown in Table 1. reported ratings of valence, tension arousal, energy arousal,
A Neumann U87 microphone (Georg Neumann GmbH, preference, and familiarity. The interface consisted of five clearly
Berlin, Germany) was selected for recording and placed 70 cm labeled nine-point analogical-categorical scales (Weber, 1991)
from the performer. All stimuli were sampled at 44.1 kHz with for each trial, as shown in Figure 1. The first three ratings
16-bit amplitude resolution. Performers could use different measured perceived affect through a three-dimensional affect
techniques to express different intended affects except for tempo, model: valence (scale endpoints labeled displeasure-pleasure),
which was determined by the tempo annotation on the music tension arousal (relaxation-tension), and energy arousal (tired-
score of the different excerpts. All performers were from a awake). Participants were instructed to judge the affect that
professional conservatory and three performers were recorded the music was trying to express, rather than the affect that
for each instrument. The average duration over which Chinese they were experiencing. The last two ratings measured preference
performers had learned their corresponding instrument was (dislike-like) and familiarity (unfamiliar-familiar) to examine
16.22 years (SD = 4.73), and the average duration for Canadian their influence on perceived affect ratings. Participants could
performers was 13.22 years (SD = 2.63). Subsequently, one Chinese listen to each trial a maximum of three times to reduce the
and two Western musicians selected the best version of each impact of the familiarity rating and were also reminded that
instrument for the formal experiment. To avoid the influence a rating of 5 equated to a neutral rating. Since there were
of loudness on perception results, all stimuli were first calibrated only eight different musical excerpts in this experiment, familiarity
based on a loudness measurement algorithm (ITU-R BS.1770-4, was rated only when each musical excerpt was presented the
2015) and then finely adjusted by ear by two volunteers. first time. All 48 stimuli were pseudo-randomized, such that
the same excerpt played on different instruments was not
Apparatus presented in successive trials. When participants completed all
In Canada, stimuli were stored on a Mac Pro computer (Apple the ratings for each trial, they could click the “next” button
Computer, Inc., Cupertino, CA, United States) and connected to listen to the next trial. To measure retest reliability, participants
to Sennheiser HD650 Pro headphones for playback via a Grace were requested to repeat the experiment after a half an hour
Design m904 (Grace Digital Audio, San Diego, CA, United States) break. During the break time, they filled out the
stereo monitor controller. Participants completed the experiment demographic questionnaire.
separately in an IAC model 120 act-3 double-wall sound-
isolation booth (IAC Acoustics, Bronx, NY, United States). In Analysis of Acoustic Features
China, stimuli were stored on a MacBook Pro (Apple Computer, Several spectral, temporal, and spectrotemporal acoustical features
Inc., Cupertino, CA, United States) and played back directly of timbre (McAdams et al., 1995) were extracted from the 48
through Sennheiser HD650 Pro headphones. Participants experiment stimuli to explore their influence on perceived affect
completed the experiment individually in a sound-proof listening ratings, as well as other potential features describing the articulation
room. To ensure the consistency of sound levels on both sides, caused by different performing techniques. All these features are
the Canadian experiment used the Brüel and Kjær Type 4153 shown in Table 2 (Alías et al., 2016; Sharma et al., 2019).
TABLE 1 | The reverberation time T60 of the two recording studios.
Recording 125 Hz 250 Hz 500 Hz 1 kHz 2 kHz 4 kHz 8 kHz 16 kHz
studio
Montréal T60(s) 0.330 0.323 0.343 0.290 0.318 0.325 0.295 0.235
Beijing T60(s) 0.330 0.333 0.346 0.321 0.308 0.327 0.313 0.218
Difference (%) 0.00 3.08 1.01 9.52 −3.08 0.54 5.60 −8.05
Frequencies in the first row were the center frequencies of octave bands.
Frontiers in Psychology | www.frontiersin.org 4 September 2021 | Volume 12 | Article 732865Wang et al. Influence of Timbre on Emotion
FIGURE 1 | The interface for the listening test.
MIRToolbox (Lartillot and Toiviainen, 2007) and Timbre Toolbox et al., 2011). For the frame energy, the STFT input representation
(Peeters et al., 2011) were used to extract acoustic features. Timbre was adopted with a length of 8,192 sample points, and a Hann
Toolbox performed accurately on individual music notes (Kazazis window of 23.2 ms with 25% overlap. The median and
et al., 2017), but some algorithms especially for temporal features interquartile range were calculated as a default statistical method
did not fit the melody unless individual notes were extracted for time-varying features using the Timbre Toolbox (Peeters
first. Therefore, most of the acoustic features were calculated et al., 2011).
through MIRToolbox, except frequency modulation, amplitude The frequency and amplitude modulation were computed
modulation, and the frame energy computed on the equivalent for the sustaining part of the ADSR model of a musical note
rectangular bandwidth (ERB) input representation. The ERB was in Timbre Toolbox (Zhang and Bocko, 2015); therefore, the
proposed by Moore and Glasberg (1983) for modeling auditory onset of each note had to be obtained first which was implemented
filters based on the response of the basilar membrane. using the MIRToolbox. The results of all the notes were averaged
The power spectrum estimation was applied to calculate to represent the central tendency.
the spectrum, which used the short-time Fourier transform
(STFT) length of 8,192 sample points, with a Hann-windowed
analysis of 50 ms, and an overlap of 50% between successive RESULTS
frames (Lartillot, 2019). The final calculated spectrum was the
linear magnitude spectrum. All spectral and spectrotemporal First, test-retest and Cronbach alpha reliability tests were
features were extracted based on the spectrum and a time conducted to check the validity of the results. Test-retest
series for each feature (Lartillot and Toiviainen, 2007). The results on the two sets of data recorded for each participant
mean value was calculated to represent each feature, which showed that participants had good consistency for all scales,
was the default statistical method of MIRToolbox. with a Pearson’s correlation r(7678) = 0.81, p < 0.001 for
A temporal envelope was needed for temporal features, displeasure/pleasure, r(7678) = 0.61, p < 0.001 for relaxation/
which was calculated by Hilbert transform and filtered using tension, r(7678) = 0.78, p < 0.001 for tired/awake, r(7678) = 0.67,
an auto-regressive filter of infinite impulse response (Lartillot, p < 0.001 for dislike/like. Repeated test results for each
2019). The onset of each note was estimated in order to separate participant were averaged to calculate the Cronbach alpha
notes based on the temporal envelope, then attack time, decay based on standardized items (mean of internal consistency)
time, and the effective duration of each note were extracted. and intraclass correlation coefficients (ICC) as measures of
The mean value of these features was taken to represent the reliability (Koo and Li, 2015). These measures indicated that
central tendency. Event density was also extracted according all scales had very good internal consistency over the 160
to the onset of each note, then mean and SD values participants: Cronbach alphas were 0.996 for displeasure/
were computed. pleasure, 0.983 for relaxation/tension, 0.998 for tired/awake,
The frame energy of the ERB model output was chosen to 0.959 for dislike/like, 0.894 for unfamiliar/familiar. For these
represent the dynamic of the sound. Spectra were partitioned same scales, ICCs of a two-way mixed-effects model on average
to correspond to the human auditory system’s frequency measures using an absolute agreement definition gave similar
resolution using an ERB filter and the energy of the spectrum results: 0.995, 0.976, 0.997, 0.925, and 0.838, respectively.
was calculated. A bank of gammatone filters was one method We will first present the listening results and then the PLSR
of implementing ERB filters in the Timbre Toolbox (Peeters analysis with timbre-related acoustic features.
Frontiers in Psychology | www.frontiersin.org 5 September 2021 | Volume 12 | Article 732865Wang et al. Influence of Timbre on Emotion
TABLE 2 | Acoustic features related with timbre and performing technique.
Category Abbreviation Acoustic feature Definition Description Values
Spectral SpecCent Spectral centroid Geometric center of the Describe shape of spectral Mean
spectrum envelope, related to the
SpecBrig Spectral brightness The amount of energy brightness and fullness Mean
above the cut-off perception
frequency
SpecSpread Spectral spread SD of the spectrum Mean
around its mean value
SpecSkew Spectral skewness Asymmetry of the Mean
spectrum around its
mean value
SpecKurt Spectral kurtosis Flatness of the spectrum Mean
around its mean value
SpecFlat Spectral flatness The ratio between the Estimate noisiness of the Mean
geometric and the sound
arithmetic mean of the
energy spectral value
SpecEntr Spectral entropy Shannon entropy of the Mean
spectrum
Spectrotemporal SpecFlux Spectral flux The distance between Describe the degree of Mean
the spectrum of variation in a spectrum
successive frames over time
Temporal ZcrRate Zero Crossing Rate The number of times Indicator of noisiness, also Mean
that the signal value related to brightness
crosses zero perception
AttTime Attack time The duration between Describe shape of Mean*
the time of start to the temporal envelope, related
end of the attack part to impulsive or sustained
DecTime Decay time The duration of the characteristics of the Mean*
decrease part sound
EffeDur Effective duration The time the energy Estimate staccatos or Mean*
envelop is above a given legatos
threshold
EventDen Event density The number of notes Estimate tempo and Mean*, SD*
detected per second articulation
FreMod Frequency modulation Frequency of energy Estimate vibratos or Mean*
modulation tremolos
AmpMod Amplitude modulation Amplitude depth of Mean*
energy modulation
Dynamic FEngERB Frame energy of ERB Frame energy of ERB Estimate sound energy, Median, IQR
through gammatone related to loudness
filter
*Onset first calculated to separate each tone, then acoustical features extracted to obtain statistical value.
Listening Results to be valid. For this experiment, these ratios for valence,
The listening test was a 4 × 2 × 4 × 2 × 3 mixed-measures design tension arousal, energy arousal, preference, and familiarity
with one between-subjects factor and four repeated measures. were 3.78, 2.12, 2.99, 3.96, and 1.88, respectively. Therefore,
The between-subjects factor had four LG: Western a mixed five-way ANOVA was conducted with two between-
nonmusicians, Western musicians, Chinese nonmusicians, subjects factors (LG, MC) and three within-subject factors
and Chinese musicians. The repeated-measures factors included (ME, ICA, and ICU). To conduct analyses of the effects of
melodies from two music cultures (MC: Western and Chinese), within-subject factors, the Greenhouse-Geisser (ε < 0.75) or
four intended musical emotions of the melodies (ME: Huynh-Feldt (ε ≥ 0.75) epsilon was applied to control for the
angry, happy, peaceful, and sad), two instrument cultures inflation of the F statistic due to sphericity violations.
(ICU: Western and Chinese) and three instrument categories Bonferroni-corrected post hoc pairwise comparisons were
(ICA: bowed chordophones, plucked chordophones, performed for further comparison. Partial eta squared ( h 2p )
and aerophones). was used to estimate effect size (Cohen, 1973). For all statistical
There were 192 groups of variables; therefore, this experiment tests, two-sided p values were used and alpha was set to
was not suitable for examining whether the data for each 0.05. Supplementary Table S1 shows descriptive
group was normally distributed. Howell (2012) has mentioned statistics (mean and SD) of each condition for all
that if the largest variance is no more than four times the participant ratings. The full ANOVA results are presented in
smallest with an equal sample size, an ANOVA is most likely Supplementary Table S2.
Frontiers in Psychology | www.frontiersin.org 6 September 2021 | Volume 12 | Article 732865Wang et al. Influence of Timbre on Emotion
6.5 6.5
6 6
Tension Arousal
5.5 5.5
Valence
5 5
4.5 4.5
4 4
3.5 3.5
Chinese Instrument Western Instrument Chinese Instrument Western Instrument
Instrument Culture Instrument Culture
6.5
6
Energy Arousal
5.5
5
4.5
4
3.5
Chinese Instrument Western Instrument
Instrument Culture
FIGURE 2 | Results of the three-way interaction between instrument category, instrument culture, and musical culture of melodies for valence (upper left),
tension arousal (upper right), and energy arousal (lower center) scales.
The Influence of Timbre on Perceived Affect
Ratings h 2p = 0.05] but not for Western music [F(1.85, 288.12) = 2.24,
The five-way interaction was statistically significant for all three ε = 0.92, p = 0.11]. For Chinese music, post hoc comparisons
perceived affect scales, although the effect sizes were quite revealed that the difference in mean ratings was only significant
small ( h 2p = 0.039, 0.031, 0.031, for energy arousal, tension for the violin and erhu (Z = 0.30, p < 0.001). For Western
arousal, and valence, respectively). Separate four-way ANOVAs music, the mean valence ratings of Western instruments were
for each intended emotion on each scale were conducted. all higher than Chinese instruments for the same instrument
Adjusting for multiple analyses for each scale, only the four-way category. Globally, plucked chordophones and aerophones
interaction for sad on the energy scale was significant (see show the greatest difference between Chinese and
Supplementary Table S3). Western instruments.
Given that our research was primarily interested in interactions A two-way simple effect analysis for musical culture on
among instrument category, instrument culture, and listener energy arousal ratings indicated that there were significant
group for the perceived affect ratings, this section will focus interaction effects between instrument category and instrument
on three-way interactions involving these factors. The main culture for both Chinese music [F(1.90, 296.59) = 127.24, ε = 0.95,
effect of instrument category and instrument culture and their p < 0.001, h 2p = 0.45], and Western music [F(1.86, 289.92) = 2.24,
interaction were significant for all scales. ε = 0.93, p < 0.001, h 2p = 0.43]. For Chinese music, post hoc
The three-way interaction effects between instrument comparisons revealed that the differences in mean ratings were
category, instrument culture, and musical culture were significant for all instrument categories: violin and erhu (Z = 0.18,
significant for valence and energy arousal, but not for tension p < 0.001); pipa and guitar (Z = 0.89, p < 0.001); dizi and flute
arousal, as shown in Figure 2. In each panel in Figure 2, (Z = 0.64, p < 0.001). For Western music, post hoc pairwise
Chinese instruments are on the left and Western instruments comparisons revealed significant differences in mean ratings
on the right. Data points show means for the different categories for the violin and erhu (Z = 0.41, p < 0.001), and for the pipa
of instruments in each culture, playing either Chinese (solid and guitar (Z = 0.66, p < 0.001), but not for the dizi and flute.
line) or Western (dashed line) melodies. For valence ratings, Regardless of whether Chinese or Western music was involved,
a two-way simple effect analysis for the melodies of each guitar ratings for tension arousal were the lowest, and flute
musical culture indicated that there was a significant interaction ratings were next lowest. The other four instruments’ ratings
between instrument category and instrument culture for were similar and higher than guitar and flute in tension arousal.
Chinese music [F(1.94, 301.95) = 17.06, ε = 0.97, p < 0.001, For Chinese music, the pipa and dizi ratings were significantly
Frontiers in Psychology | www.frontiersin.org 7 September 2021 | Volume 12 | Article 732865Wang et al. Influence of Timbre on Emotion
higher than the other four instruments, whereas, for Western The three-way interactions between listener group, instrument
music, these two instruments were not significantly different category, and instrument culture were significant for ratings
from the other instruments. of valence, tension arousal, and preference (Figure 4), but not
The results of the three-way interaction effects between for energy arousal and familiarity. For valence ratings, a simple
instrument category, instrument culture, and intended musical effect analysis combining instrument category and instrument
emotion on the mean ratings of perceived affect are displayed culture into a single factor of instrument indicated that the
in Figure 3. For valence ratings, a simple effect analysis for difference in mean ratings between listener groups was significant
each emotion indicated that there was a significant interaction for the violin [F(3, 156) = 5.44, p = 0.001, h 2p = 0.09], guitar
effect between instrument category and instrument culture for [F(3, 156) = 8.9, p < 0.001, h 2p = 0.15], flute [F(3, 156) = 10.06,
angry music [F(1.96, 305.78) = 4.54, ε = 0.98, p = 0.012, h 2p = 0.03] p < 0.001, h 2p = 0.17], and erhu [F(3, 156) = 9.71, p < 0.001,
and happy music [F(2, 312) = 24.45, p < 0.001, h 2p = 0.14], but h 2p = 0.16], but not for the pipa [F(3, 156) = 0.99, p = 0.40],
not for peaceful music [F(2, 312) = 2.69, p = 0.069] or sad music and dizi [F(3, 156) = 1.71, p = 0.17]. Significant differences between
[F(2, 312) = 1.22, p = 0.27]. For angry music, post hoc comparisons listener groups depended on the musical instrument. For the
revealed that the difference in mean ratings was significant guitar and erhu, the mean ratings of Western listeners were
for the violin and erhu (Z = 0.12, p = 0.039), and for the flute significantly higher than those of Chinese listeners. For the
and dizi (Z = 0.29, p < 0.001), but not for the pipa and guitar. violin, post hoc comparisons revealed that the mean ratings
Post hoc comparisons for happy music revealed that the difference of Western listeners were significantly higher than those of
in mean ratings was only statistically significant for the violin Chinese nonmusicians. These results indicated that participants’
and erhu (Z = 0.38, p < 0.001). For peaceful and sad music, the cultural backgrounds had a great impact on the perceived
mean ratings of Western instruments were all higher than valence rating.
Chinese instruments from the same instrument category. The For tension arousal ratings, a simple effect analysis indicated
erhu was rated as having the lowest (most negative) valence that the difference in mean ratings among listener groups was
of all the instruments overall. significant for violin [F(3, 156) = 3.37, p = 0.02, h 2p = 0.06],
For tension arousal ratings, a simple effect analysis indicated guitar [F(3, 156) = 2.99, p = 0.033, h 2p = 0.05], pipa [F(3,
that there were significant interaction effects between instrument 156) = 11.45, p < 0.001, h 2p = 0.18], and dizi [F(3, 156) = 8.04,
category and instrument culture on all intended emotions: p < 0.001, h 2p = 0.13], but not for erhu [F(3, 156) = 0.99, p = 0.40]
angry [F(2, 312) = 72.39, p < 0.001, h 2p = 0.32]; happy [F(2, or flute [F(3, 156) = 1.71, p = 0.17]. For the violin, post hoc
312) = 39.94, p < 0.001, h 2p = 0.20]; peaceful [F(1.97, comparisons revealed that the mean ratings were significantly
207.64) = 68.32, ε = 0.99, p < 0.001, h 2p = 0.30]; and sad [F(2, higher for Western musicians than for Chinese nonmusicians.
312) = 46.08, p < 0.001, h 2p = 0.23]. For all intended emotions, For the pipa, the mean ratings were significantly higher for
the guitar ratings were the lowest and the flute ratings were Western listeners than for Chinese nonmusicians, and the
next lowest. The rating differences between Chinese instruments ratings of Western musicians were significantly higher than
were relatively small, whereas the differences between Western those of Chinese musicians. For the dizi, Western musicians
instruments were significantly larger. The order of Western rated tension arousal significantly higher than did Chinese
instruments from high to low tension was violin, flute, and listeners. For the guitar, the mean ratings of Western musicians
guitar for all musical emotions. Western instruments had the were significantly higher than for Western nonmusicians.
largest impact on tension arousal ratings. We observed that participants’ cultural backgrounds had a
A simple effect analysis of energy arousal indicated that there greater influence on the perceived tension arousal ratings than
were significant interaction effects between instrument category their musical backgrounds.
and instrument culture for all emotion categories: angry For preference ratings, a simple effect analysis indicated
[F(1.91, 298.39) = 58.27, ε = 0.96, p < 0.001, h 2p = 0.32]; happy that the difference in mean ratings between listener groups
[F(2, 312) = 131.95, p < 0.001, h 2p = 0.46]; peaceful [F(1.97, was significant for the violin [F(3, 156) = 4.42, p = 0.005,
207.64) = 88.92, p < 0.001, h 2p = 0.36]; and sad [F(2, 312) = 55.09, h 2p = 0.08], the erhu [F(3, 156) = 40.23, p < 0.001, h 2p = 0.44],
p < 0.001, h 2p = 0.26]. The guitar ratings were the lowest for and the pipa [F(3, 156) = 4.4, p = 0.005, h 2p = 0.08], but not
all musical emotions, whereas pipa and dizi ratings were for the guitar [F(3, 156) = 0.80, p = 0.50], the flute [F(3, 156) = 0.73,
relatively high. For Western instruments, the effect on energy p = 0.54] or the dizi [F(3, 156) = 0.87, p = 0.46]. For the violin,
arousal ratings from high to low was violin, flute, and the mean ratings of musicians were higher than those of
then guitar. nonmusicians. For the erhu, Chinese musicians’ ratings were
the highest, and the mean ratings were also higher for Chinese
Differences in Perceived Ratings Between nonmusicians than for Western listeners. For the pipa, the
Listener Groups mean ratings of Chinese musicians were significantly higher
We examined the main effect of listener group and its three-way than those of Western nonmusicians. We observed that
interactions with instrument category, instrument culture, musical participants’ cultural and musical backgrounds both had an
emotion, and musical culture for all three perceived affect impact on preference, and this impact was more marked for
ratings, as well as preference and familiarity (see excerpts played on Chinese instruments.
Supplementary Table S2). The main effect of listener group The three-way interactions between listener group, musical
was significant for all ratings except energy arousal. culture, and musical emotion on different perception ratings
Frontiers in Psychology | www.frontiersin.org 8 September 2021 | Volume 12 | Article 732865Wang et al. Influence of Timbre on Emotion
6 8
Angry Happy
5.5 7.5
Valence
Valence
5 7
4.5 6.5
Chinese Instrument Western Instrument Chinese Instrument Western Instrument
Instrument Culture Instrument Culture
5 4.5
Sad
Peaceful
4.5 4
Valence
Valence
4 3.5
3.5 3
Chinese Instrument Western Instrument Chinese Instrument Western Instrument
Instrument Culture Instrument Culture
6 5
Angry Happy
Tension Arousal
Tension Arousal
5.5 4.5
5 4
4.5 3.5
Chinese Instrument Western Instrument Chinese Instrument Western Instrument
Instrument Culture Instrument Culture
5 5.5
Peaceful Sad
Tension Arousal
Tension Arousal
5
4.5
4.5
4
4
3.5
3.5
3 3
Chinese Instrument Western Instrument Chinese Instrument Western Instrument
Instrument Culture Instrument Culture
7 8
Angry Happy
Energy Arousal
Energy Arousal
6.5 7.5
6 7
5.5 6.5
Chinese Instrument Western Instrument Chinese Instrument Western Instrument
Instrument Culture Instrument Culture
5 5
Peaceful Sad
Energy Arousal
Energy Arousal
4.5 4.5
4 4
3.5 3.5
3 3
Chinese Instrument Western Instrument Chinese Instrument Western Instrument
Instrument Culture Instrument Culture
FIGURE 3 | Plots of the three-way interactions between instrument category, instrument culture, and musical emotion for the three perceived
affect scales.
Frontiers in Psychology | www.frontiersin.org 9 September 2021 | Volume 12 | Article 732865Wang et al. Influence of Timbre on Emotion
6.5 Western Instrument 6.5 Chinese Instrument
6 6
5.5 5.5
Valence
Valence
5 5
4.5 4.5
4 4
Bow Pluck Aerophore Bow Pluck Aerophore
Instrument Category Instrument Category
6 Western Instrument 6 Chinese Instrument
5.5 5.5
Tension Arousal
Tension Arousal
5 5
4.5 4.5
4 4
3.5 3.5
3 3
Bow Pluck Aerophore Bow Pluck Aerophore
Instrument Category Instrument Category
8 Western Instrument 8 Chinese Instrument
7 7
Preference
6
Preference
6
5 5
4 4
3 3
Bow Pluck Aerophore Bow Pluck Aerophore
Instrument Category Instrument Category
FIGURE 4 | The results of the three-way interaction effect between instrument category, instrument culture, and listener group on valence, tension arousal, and
preference.
are displayed in Figure 5. For valence ratings, a simple effect listening to Chinese peaceful music, Chinese nonmusicians’
analysis by intended emotion and musical culture indicated ratings were much lower than those of the other listener groups.
that the difference in mean ratings between listener groups For tension arousal ratings, a similar simple effect analysis
was significant for peaceful music [Western: F(3, 156) = 6.27, indicated that the difference in mean ratings between listener
p < 0.001, h 2p = 0.04; Chinese: F(3, 156) = 5.28, p = 0.002, groups was significant for angry music [Western: F(3, 156) = 10,
h 2p = 0.03] and sad music [Western: F(3, 156) = 27.71, p < 0.001, p < 0.001, h 2p = 0.16; Chinese: F(3, 156) = 8.17, p < 0.001,
h 2p = 0.15; Chinese: F(3, 156) = 3.67, p = 0.014, h 2p = 0.03], h 2p = 0.14], happy music [Western: F(3, 156) = 19.15, p < 0.001,
but not for angry music [Western: F(3, 156) = 1.45, p = 0.23; h 2p = 0.27; Chinese: F(3, 156) = 12.09, p < 0.001, h 2p = 0.19],
Chinese: F(3, 156) = 0.93, p = 0.43] or happy music [Western: and Chinese sad music [F(3, 156) = 5.07, p = 0.002, h 2p = 0.09],
F(3, 156) = 0.73, p = 0.54; Chinese: F(3, 156) = 0.08, p = 0.97]. but not for peaceful music [Western: F(3, 156) = 1.82, p = 0.15;
The mean ratings of Western listeners were significantly higher Chinese: F(3, 156) = 0.49, p = 0.69] and Western sad music [F(3,
than those of Chinese listeners when listening to Chinese sad 156) = 0.75, p = 0.52]. For Chinese angry music and Chinese
music and Western peaceful music. The Western nonmusicians’ and Western happy music, the mean ratings of Western listeners
ratings were significantly higher than those of Chinese were significantly higher than those of Chinese listeners. For
nonmusicians when listening to Western sad music. When Chinese sad music, to the contrary, the ratings were higher
Frontiers in Psychology | www.frontiersin.org 10 September 2021 | Volume 12 | Article 732865Wang et al. Influence of Timbre on Emotion
8 Chinese Music 8 Western Music
7 7
6 6
Valence
Valence
5 5
4 4
3 3
Angry Happy Peaceful Sad Angry Happy Peaceful Sad
Music Emotion Music Emotion
Chinese Music Western Music
6.5 6.5
6 6
Tension Arousal
Tension Arousal
5.5 5.5
5 5
4.5 4.5
4 4
3.5 3.5
3 3
Angry Happy Peaceful Sad Angry Happy Peaceful Sad
Music Emotion Music Emotion
Chinese Music Western Music
8 8
7 7
Energy Arousal
Energy Arousal
6 6
5 5
4 4
3 3
Angry Happy Peaceful Sad Angry Happy Peaceful Sad
Music Emotion Music Emotion
Chinese Music Western Music
8 8
7 7
Preference
Preference
6 6
5 5
4 4
3 3
Angry Happy Peaceful Sad Angry Happy Peaceful Sad
Music Emotion Music Emotion
Chinese Music Western Music
8 8
7 7
6 6
Familiarity
Familiarity
5 5
4 4
3 3
2 2
Angry Happy Peaceful Sad Angry Happy Peaceful Sad
Music Emotion Music Emotion
FIGURE 5 | Plots of the three-way interaction effects between musical culture, musical emotion, and listener group for valence, tension arousal, energy arousal,
preference, and familiarity.
Frontiers in Psychology | www.frontiersin.org 11 September 2021 | Volume 12 | Article 732865Wang et al. Influence of Timbre on Emotion
for Chinese listeners than for Western musicians. For Western h 2p = 0.14], and Western music played by Chinese instruments
angry music, musicians’ ratings were significantly higher than [F(3, 156) = 6.50, p < 0.001, h 2p =0.13], but not for Chinese
those of nonmusicians. A rating of 5 indicated a neutral score, music played by Western instruments [F(3, 156) = 0.62,
so musicians’ ratings of Western angry music were more clearly p = 0.61], or by Western music played by Western instruments
differentiated than those of nonmusicians. Therefore, both the [F(3, 156) = 2.5, p = 0.06]. The ratings of Western listeners
musical culture of the melodies and musical training affect were higher than those of Chinese listeners for Chinese music
tension arousal ratings. played by Chinese instruments, which demonstrated that
For energy arousal ratings, a simple effect analysis indicated in-group advantage influenced tension arousal. The ratings
that the differences in mean ratings between listener groups of Western musicians were higher than those of Chinese
were significant for Chinese peaceful music [F(3, 156) = 2.7, nonmusicians for Western music played by Chinese
p = 0.047, h 2p = 0.02], and all angry music [Chinese: F(3, instruments, which meant that instrument culture might have
156) = 5.24, p = 0.002, h 2p = 0.09; Western: F(3, 156) = 2.37, more influence on tension arousal perception than
p = 0.047] and happy music [Chinese: F(3, 156) = 3.28, p = 0.023, musical culture.
h 2p = 0.06; Western: F(3, 156) = 2.82, p = 0.041, h 2p = 0.05], A simple effect analysis of preference indicated that there
but not for Chinese sad music [F(3, 156) = 1.32, p = 0.27] and were significant differences between listener groups for Chinese
the other Western music [peaceful: F(3, 156) = 0.92, p = 0.43; music played by Chinese instruments [F(3, 156) = 31.54, p < 0.001,
sad: F(3, 156) = 0.17, p = 0.92]. For Chinese angry music, Western h 2p = 0.38], Chinese music played by Western instruments
listeners’ mean ratings were significantly higher than for Chinese [F(3, 156) = 9.36, p < 0.001, h 2p = 0.15], and Western music
listeners. For Chinese and Western happy music, Western played by Chinese instruments [F(3, 156) = 2.99, p = 0.033,
listeners’ mean ratings were significantly higher than Chinese h 2p = 0.05], but not for Western music played by Western
nonmusicians. For Chinese peaceful music, Chinese musicians’ instruments [F(3, 156) = 0.41, p = 0.74]. The effect size indicated
mean ratings were higher than Western musicians. From the that the differences in listener group preferences were greatest
results, we observed that participants’ cultural backgrounds when they listened to Chinese music played by Chinese
had a greater impact on energy arousal ratings than their instruments, especially between Chinese musicians and
musical backgrounds. Western participants.
For ratings of preference, a simple effect analysis indicated
that the interaction effect between listener groups and musical
emotions was significant both for Chinese music [F(9, Correlation Analysis of Perceived Affect Ratings,
468) = 3.88, p < 0.001, h 2p = 0.07], and Western music [F(9, Preference, and Familiarity
468) = 4.22, p < 0.001, h 2p = 0.08]. The Chinese musicians’ The above analysis indicated that the four listener groups’
mean ratings were much higher than the other three groups perceptions were significantly different along several factors.
for all Chinese music. For Western angry music, musicians’ In order to explore the differences in the correlation between
mean ratings were higher than nonmusicians. For Western the three emotional dimensions among listener groups, and
happy music, musicians’ mean ratings were significantly higher the influence of preference and familiarity on emotional
than Western nonmusicians. perception, a Pearson correlation analysis was conducted
For ratings of familiarity, a simple effect analysis indicated separately for each listener group according to participants’
that the interaction effect between listener groups and musical mean ratings of valence, tension arousal, energy arousal,
emotions was significant both for Chinese music [F(9, preference, and familiarity for the 48 conditions, as shown
468) = 5.48, p < 0.001, h 2p = 0.10], and Western music [F(9, in Table 3. Valence and energy arousal were strongly positively
468) = 8.14, p < 0.001, h 2p = 0.14]. Chinese musicians’ mean correlated for all listeners. Tension arousal was moderately
ratings were significantly higher than the other three groups negatively correlated with energy arousal for Western
for Chinese music, which indicated that they were very nonmusicians and strongly negatively correlated for Western
familiar with all Chinese music. Chinese nonmusicians were musicians, but there was no correlation between them for
familiar with Chinese angry and happy music. Western Chinese listeners. Preference had more significant positive
listeners were not familiar with Chinese music at all. Western correlation with valence for nonmusicians than for musicians,
musicians were familiar with most Western music except which indicated that musicians distinguished between valence
Western angry music. Chinese listeners were also familiar and preference better than nonmusicians. For Chinese listeners,
with Western music, and this result was consistent with the familiarity was moderately positively correlated with valence
questionnaire results of the participants. Western nonmusicians and energy arousal, but very weakly positively correlated
were not familiar with most Western music except Western with tension arousal. For Western listeners, familiarity was
peaceful music. very weakly to weakly correlated with all other perceived
The three-way interaction effects of listener group, ratings. Chinese listeners were familiar with most of the
instrument culture, and musical culture were only significant stimuli; therefore, these results seemed to indicate that
for tension arousal and preference. For tension arousal ratings familiarity with the music might influence the perception
(Figure 6), a simple effect analysis indicated that there were of valence and energy arousal. There was a weak positive
significant differences between listener groups for Chinese correlation between familiarity and preference for
music played by Chinese instruments [F(3, 156) = 8.78, p < 0.001, Chinese nonmusicians.
Frontiers in Psychology | www.frontiersin.org 12 September 2021 | Volume 12 | Article 732865Wang et al. Influence of Timbre on Emotion
6 7
5.5 6.5
Tension Arousal 5 6
Preference
4.5 5.5
4 5
3.5 4.5
3 4
CI*CM CI*WM WI*CM WI*WM CI*CM CI*WM WI*CM WI*WM
Instrument Culture * Music Culture Instrument Culture * Music Culture
FIGURE 6 | The results of the three-way interaction effects between listener group, instrument culture, and musical culture on tension arousal and preference. CI,
Chinese instruments; CM, Chinese music; WI, Western instruments; and WM, Western music.
TABLE 3 | Pearson’s correlation coefficients of ratings of perceived valence, tension arousal, energy arousal, preference, and familiarity.
Western nonmusician Western musician
Valence Tension Energy Preference Valence Tension Energy Preference
Tension −0.24 −0.19
Energy 0.91*** −0.61*** 0.78*** −0.75***
Preference 0.54*** −0.49*** 0.23 −0.11 −0.47** −0.31*
Familiarity −0.27 0.32* −0.40** 0.18 −0.29* −0.08 −0.24 0.07
Chinese nonmusician Chinese musician
Tension −0.27 −0.49***
Energy 0.96*** −0.01 0.91*** −0.11
Preference 0.74*** −0.47** 0.68*** 0.44** −0.48** 0.36*
Familiarity 0.51*** 0.22 0.60*** 0.46** 0.51*** 0.08 0.58*** 0.26
df = 46. *p < 0.05; **p < 0.01; ***p < 0.001.
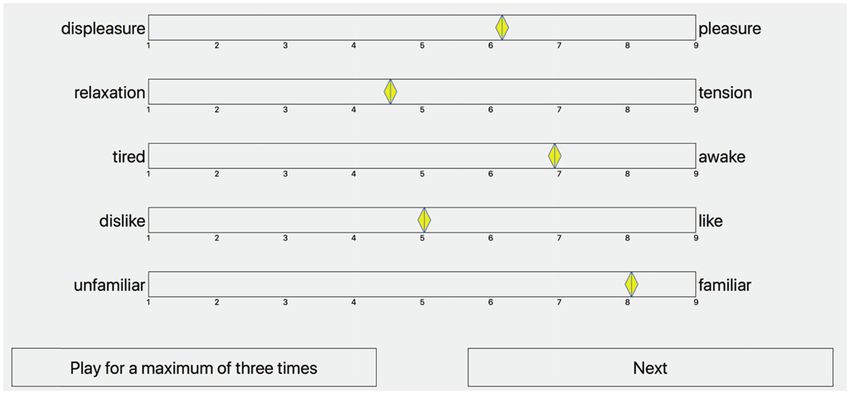
Hierarchical Cluster Analysis Between Six was trained on five subsets and the error in predicting the
Instruments remaining subset was assessed. The procedure of training
To explore the similarity of affect perception between instruments, and prediction was repeated for all permutations of subsets.
a hierarchical cluster analysis between six instruments was R2 and Q2 are generally two metrics that evaluate the
conducted based on the mean ratings across participants of performance of a PLSR model. R2 evaluates the explanatory
perceived valence, tension arousal, and energy arousal. Squared power of the model, and Q2 describes the predictive power
Euclidean distance was adopted as a proximity measure. (McAdams et al., 2017; Lembke et al., 2019). To assess the
According to the results (Figure 7), the erhu and violin were relative importance of independent variables in each PLSR,
very similar and somewhat similar to the pipa and dizi, but each independent variable was assessed by a variable importance
very different from the guitar and flute. The pipa and dizi in projection (VIP) score, and a VIP score greater than one
were very similar, and the guitar and flute were very similar. was generally considered a significant contribution (Chong
and Jun, 2005; Janes et al., 2008). The SIMPLS algorithm
Partial Least-Squares Regression (De Jong, 1993) was applied to the PLSR and implemented
The PLSR was performed to examine the relationship between in MATLAB.
acoustic features and perceived affect ratings. PLSR couples In our study, the PLSR independent variables were 18
multiple linear regression with principal component analysis, acoustic features (shown in Table 2) for each of the 48 stimuli.
and also allows collinearity among variables, with collinear Based on the ANOVA results, the cultural background of
variables being represented parsimoniously in principal participants had a great influence on emotional perception,
components (PCs; Geladi and Kowalski, 1986). so the six dependent variables tested were the mean ratings
A 6-fold cross-validation model was applied to the PLSR of Western and Chinese participants separately for valence,
model by partitioning the n cases into six subsets. The model tension arousal, and energy arousal. Two PC were considered
Frontiers in Psychology | www.frontiersin.org 13 September 2021 | Volume 12 | Article 732865Wang et al. Influence of Timbre on Emotion
Tension Arousal
The PLSR loadings and scores for tension arousal across two
PCs are displayed in Figure 9. The results of Western and
Chinese participants are different. For Western participants,
PC1 is highly related to spectral features that quantify how
noisy the sound is and describe the spectral energy distribution,
such as spectral flatness, spectral entropy, spectral centroid,
and spectral skewness. The more positive the PC1 coordinate,
the more high-frequency energy, the wider the spectral
distribution, and the more noise-like the musical stimuli are
score results indicate that all music stimuli played by the dizi
and most stimuli played by the pipa have positive scores on
PC1, whereas all stimuli played by the guitar and most stimuli
played by flute have a negative score on PC1. PC2 is influenced
by temporal features falling slightly oblique to the PC axis,
which includes effective duration, attack time, event density
SD, and amplitude modulation. The musical stimuli with positive
coordinates on PC2 were performed with a shorter note duration
FIGURE 7 | Hierarchical cluster analysis between six instruments based on and vibrato articulation.
mean ratings across participants of perceived valence, tension arousal, and
energy arousal.
For Chinese participants, PC1 is highly related to spectral
features describing the spectral energy distribution, such as
spectral skewness, spectral kurtosis, spectral brightness, and
in PLSR models of all three affect dimensions based on the spectral centroid. The more positive the PC1 coordinate, the
Q2 criterion computed by cross validation (Stone, 1974; Titin more high-frequency energy the musical stimuli possess. PC2
et al., 2018), which meant that the PC was significant and is influenced by temporal features falling slightly oblique to
selected when the predicted variance Q2 was larger than 0.05. the PC axis, which included effective duration, attack time,
The performances of each of the three affect dimensions are and frame energy of ERB.
displayed in Table 4.
Energy Arousal
Valence
Figure 10 visualizes the PLSR loadings and scores for mean
Figure 8 visualizes the PLSR loadings (vectors) and scores
energy arousal ratings across two PCs. The results of Western
(circles) for valence across two PCs. Different colored circles
and Chinese participants are almost the same. PC1 is highly
represent stimuli played by different musical instruments. Longer
related to two acoustic features: spectral flatness and spectral
vectors indicate that acoustic feature loadings contributed more
flux. The more positive the PC1 coordinate, the more spectrum
strongly, and the orientations indicate the PCs by which they
energy variation over time and noisiness characterize the music
were primarily influenced.
stimuli. The score results indicate that most of the musical
The PLSR result of Western participants is very similar
stimuli played by the pipa and dizi have positive PC1 scores,
to that of Chinese participants, although there are differences
whereas most of the stimuli played by guitar have negative
in the percentage of explained variance for two PCs. PC1 in
PC1 scores.
both groups is related to two factors: one is the spectrotemporal
PC2 is influenced by two factors: firstly temporal features,
feature described by spectral flux; the other one includes
described by attack time and effective duration; secondly spectral
temporal features, described by event density, effective duration,
features falling slightly oblique to the PC axis, such as spectral
and attack time. The musical stimuli with positive coordinates
skewness, spectral kurtosis, spectral brightness, and spectral centroid.
in PC1 have more spectrum energy variation over time and
The musical stimuli with negative coordinates on PC2, have more
are performed with shorter note durations with sharp attacks.
high-frequency energy, wider spectral distribution, and were
Most of the stimuli played by the pipa have positive
performed with a shorter note duration. PLSR scores indicate
scores in PC1.
that all music stimuli played by the dizi have negative PC2 scores,
PC2 appears to be influenced by a collinear set of spectral
while all stimuli played by guitar have positive PC2 scores.
features falling slightly oblique to the PC axis, such as spectral
skewness, spectral kurtosis, spectral brightness, and spectral
centroid. The PC2 coordinates are more negative, which means Important Acoustic Features of Different Affective
that the musical stimuli have greater high-frequency energy Dimensions
and wider spectral distribution. All stimuli played by the We identified the important acoustic features of different
guitar and most stimuli played by the flute and the pipa emotional dimensions with the VIP scores greater than
have positive scores in PC2, whereas all stimuli played by one from the PLSR models. The top five important acoustic
the dizi and most stimuli by the erhu and violin have features for three emotional dimensions are shown in
negative scores. Supplementary Table S4. For valence, there is no big difference
Frontiers in Psychology | www.frontiersin.org 14 September 2021 | Volume 12 | Article 732865You can also read