Sequential dependency for affective appraisal of food images
←
→
Page content transcription
If your browser does not render page correctly, please read the page content below
ARTICLE
                  https://doi.org/10.1057/s41599-021-00909-4                OPEN

                  Sequential dependency for affective appraisal of
                  food images
                  Erik Van der Burg 1,2 ✉, Alexander Toet 1, Zahra Abbasi 3, Anne-Marie Brouwer1, Jan B. F. Van Erp1,4,
                  Victor L. Kallen1, Daisuke Kaneko 5,6, Youjin (Eugene) Kim 7, Marise Kinnear8, Henriëtte L. de Kock 8,
                  Dyah Kusbiantari 9,10, Tzong-Ru Lee11, Yingxuan Liu1, Bohdan L. Luhovyy12,13, Emily MacEachern13,
                  Abadi Gebre Mezgebe 14, Rouja Nikolova15, Ganiyat Olatunde 16, Wilis Srisayekti10,
                  Muhammad Rizwan Tahir6, Shota Ushiama5 & Merve Aslıhan Yürek17
1234567890():,;

                  How we perceive the world is not solely determined by our experiences at a given moment in
                  time, but also by what we have experienced in our immediate past. Here, we investigated
                  whether such sequential effects influence the affective appraisal of food images. Participants
                  from 16 different countries (N = 1278) watched a randomly presented sequence of 60 dif-
                  ferent food images and reported their affective appraisal of each image in terms of valence
                  and arousal. For both measures, we conducted an inter-trial analysis, based on whether the
                  rating on the preceding trial(s) was low or high. The analyses showed that valence and
                  arousal ratings for a given food image are both assimilated towards the ratings on the
                  previous trial (i.e., a positive serial dependence). For a given trial, the arousal rating depends
                  on the arousal ratings up to three trials back. For valence, we observed a positive dependence
                  for the immediately preceding trial only, while a negative (repulsive) dependence was present
                  up to four trials back. These inter-trial effects were larger for males than for females, but
                  independent of the participants’ BMI, age, and cultural background. The results of this
                  exploratory study may be relevant for the design of websites of food delivery services and
                  restaurant menus.

                  1 TNO, Human Factors, Soesterberg, the Netherlands. 2 Brain and Cognition, University of Amsterdam, Amsterdam, the Netherlands. 3 University of Isfahan,

                  Isfahan, Iran. 4 Research Group Human Media Interaction, University of Twente, Enschede, the Netherlands. 5 Kikkoman Europe R&D Laboratory B.V,
                  Wageningen, the Netherlands. 6 TNO, Microbiology and Systems Biology, Zeist, the Netherlands. 7 Department of Nutritional Science and Food
                  Management, Ewha Womans University, Seoul, Republic of Korea. 8 Dept of Consumer & Food Sciences, University of Pretoria, Pretoria, South Africa. 9 Ivet
                  University, Semarang, Indonesia. 10 Faculty of Psychology, Padjadjaran University, Bandung, Indonesia. 11 National Chung Hsing University, Taichung, Taiwan
                  (R.O.C.). 12 Department of Applied Human Nutrition, Mount Saint Vincent University, Halifax, NS, Canada. 13 Department of Physiology and Biophysics,
                  Faculty of Medicine, Dalhousie University, Halifax, NS, Canada. 14 School of Nutrition, Food Science and Technology, College of Agriculture, Hawassa
                  University, Hassawa, Ethiopia. 15 Department of Occupational Medicine, Medical University, Sofia, Bulgaria. 16 University of Agriculture, Abeokuta, Nigeria.
                  17 Marmara University, Istanbul, Turkey. ✉email: erik.vanderburg@tno.nl

                  HUMANITIES AND SOCIAL SCIENCES COMMUNICATIONS | (2021)8:228 | https://doi.org/10.1057/s41599-021-00909-4                                                 1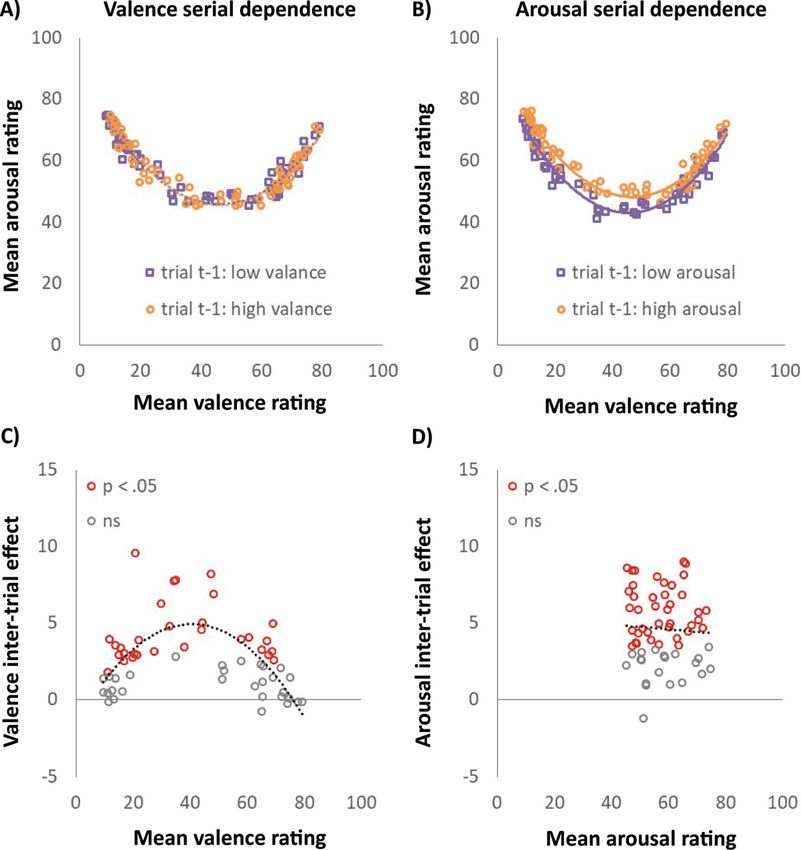
ARTICLE                                 HUMANITIES AND SOCIAL SCIENCES COMMUNICATIONS | https://doi.org/10.1057/s41599-021-00909-4

T
Introduction
        he kind of food we buy in a grocery store, or order in a           stimuli or judgements, like for face attractiveness ratings in an
        restaurant or a snack bar, is not only determined by what          online dating paradigm (Taubert et al., 2016), and even for
        we desire to eat, but also by what we perceive in our sur-         goalkeepers’ decisions about the direction of their dives in penalty
roundings. For instance, an attractive food image may capture              shoot-outs (Misirlisoy and Haggard, 2014). These sequential
one’s attention and evoke a positive emotion that results in the           effects can either be negative or positive. In case of a positive or
decision to buy the food that is displayed or to visit a restaurant        assimilative sequential effect, the percept of a current stimulus is
that serves it, while an aversive image may lead to the opposite           biased toward the previous stimulus. For instance, a face is per-
behaviour (Dalenberg et al., 2014). Images play an important role          ceived as more attractive after seeing an attractive face, and as less
in advertising food since they have a strong impact on customer            attractive after seeing an unattractive face (Kok et al., 2017;
attitudes and expectations (Jaeger and MacFie, 2001; Townsend              Taubert et al., 2016; Van der Burg et al., 2019; Xia et al., 2016). In
and Kahn, 2013). Food images are for instance effectively used for         case of a negative or repulsive effect, the percept is biased away
culinary tourism promotion and for destination marketing to                from the previous stimulus. For instance, the perceived orienta-
influence travel planning (Andersson et al., 2016; Liu et al., 2013).       tion of a Gabor patch is shifted away from its orientation on the
Images can trigger emotional processing, which in turn influences           previous trial (i.e., the tilt aftereffect: Gibson and Radner, 1937). It
consumers’ perceptions and attitudes towards a product or ser-             was recently postulated that a negative sequential dependency
vice (Lee et al., 2009; Poor et al., 2013). Emotions are a major           reflects a low-level perceptual process, whereas a positive
driver behind human consumption behaviour (Desmet and                      sequential effect reflects higher-order post-perceptual (e.g., deci-
Schifferstein, 2008; Gutjar et al., 2015). To date, there is a growing     sional) processes (Fritsche et al., 2017, but see Taubert et al.,
interest in the emotional response to food images (for a recent            2016). Regardless of sign, both serial effects may have functional
review, see e.g. Lagast et al., 2017). One of the main drivers is the      benefits. From a behavioural perspective, a negative serial
increasing popularity of the online-to-offline (O2O) food delivery          dependence makes it easier to detect changes in the world by
market (Wang et al., 2020; Xu and Huang, 2019), which has                  enhancing perceptual differences. A positive serial dependence
increased significantly since the outbreak of the COVID-19                  reduces perceptual differences, as if the brain integrates (or
pandemic. O2O food delivery services allow customers to order              averages) information over time. A potential behavioural
food items through mobile apps or websites and have them                   advantage of this process could be that the associated averaging
delivered to their workplace or home within a short timeframe.             process (termed an association field: Kiyonaga et al., 2017)
Food images play an essential role in this process. Compared to            reduces noise in the visual system (induced by eye-movements,
text, images more effectively attract attention, are processed more        blinks, light conditions, occlusion, etc.), resulting in a more stable
rapidly and automatically (Luna and Peracchio, 2003; Townsend              or coherent percept of the world around us.
and Kahn, 2013), and more effectively elicit emotions. Also,                  Whereas the vast majority of studies investigated serial
restaurants and food courts increasingly use digital menu boards           dependencies using clearly defined perceptual features within the
showing static or even dynamic food images to provide more                 visual, auditory and even tactile domain (such as motion, colour,
appealing descriptions of the dishes served (Beldona et al., 2014;         orientation, frequency, etc), very little research has been con-
Peters and Mennecke, 2011; Peters and Mennecke, 2013; Toet                 ducted to study serial dependencies for amodal stimuli, like
et al., 2019c). And last but not least, people increasingly share          emotions, which can be evoked through different sensory chan-
food images over the internet (‘digital grazing’ Spence et al.,            nels. An exception is a study by Liberman et al. (2014) who
2015), as reflected in the growing number of sites dedicated to             reported a positive serial dependence when participants judged
food images on platforms like Instagram, Flickr and Snapchat               the emotions of facial expressions. Although it is possible that
(Abbar et al., 2015; Mejova et al., 2016).                                 such serial dependencies for facial expressions reflect an emo-
   Although it is clear that perceiving a food image triggers an           tional aftereffect, it is also feasible that this reflects a pure visual
emotional response, and that this response influences consumer              inter-trial effect. Indeed, faces are typically processed by the
behaviour substantially, it remains unclear whether this response          fusiform face area (FFA, Kanwisher et al., 1997), a part of the
depends solely on the food image that is seen at a particular              human visual system that is specialized for facial recognition and
moment or whether previously seen food images affect this                  that is also sensitive to emotional facial expressions (Harry et al.,
response. Indeed, it is important to note that an emotional                2013). It therefore remains a question whether serial dependen-
response does not disappear instantaneously after the stimulus             cies can be observed for emotions, which are typically processed
disappears, but instead slowly decays over time (in the order of           in neural networks involving different parts of the human brain
seconds: Schönfelder et al., 2013). As a result, the emotional             like the Amygdala (Rasia-Filho et al., 2000).
response to a particular food image is most likely not a ‘pure’               According to the circumplex model of affect (Russell, 1980),
response to the stimulus itself, but rather a mixture or sum of            emotions can be described by their two main principal dimen-
(both positive and negative) emotional experiences over a limited          sions: valence (pleasantness; the degree of positive or negative
time. From the perception literature we know that our percept is           affective response to a stimulus) and arousal (the intensity of the
not solely determined by what we perceive at a given moment in             affective response to a stimulus; the degree of activation or
time, but also by the information we received and processed                deactivation). In this exploratory study we investigate whether
recently (in the order of seconds). For instance, if participants are      sequential effects also play a role in the affective appraisal of food
asked to rate the attractiveness of faces, then the rating for a given     images, since its known that such stimuli typically evoke emo-
face does not only depend on its attractiveness, but also on the           tional responses (Kaneko et al., 2018). Thereto, we re-analysed an
rating of the faces they recently saw (Kok et al., 2017; Van der           existing data set, containing both published (Kaneko et al., 2018)
Burg et al., 2019; Xia et al., 2016). Sequential dependencies in           and unpublished data from 16 different countries. Participants
visual perception have been predominantly reported when par-               watched a randomly presented sequence of 60 different food
ticipants were asked to judge low-level features such as colour            images and reported their affective appraisal of each image in
(Barbosa and Compte, 2020), orientation (Fischer and Whitney,              terms of valence and arousal. Through an inter-trial analysis we
2014), and motion (Alais et al., 2017). However, several studies           investigate whether the valence and arousal ratings on a given
also reported sequential effects associated with more complex              trial depend on the ratings on the trials immediately preceding

2                          HUMANITIES AND SOCIAL SCIENCES COMMUNICATIONS | (2021)8:228 | https://doi.org/10.1057/s41599-021-00909-4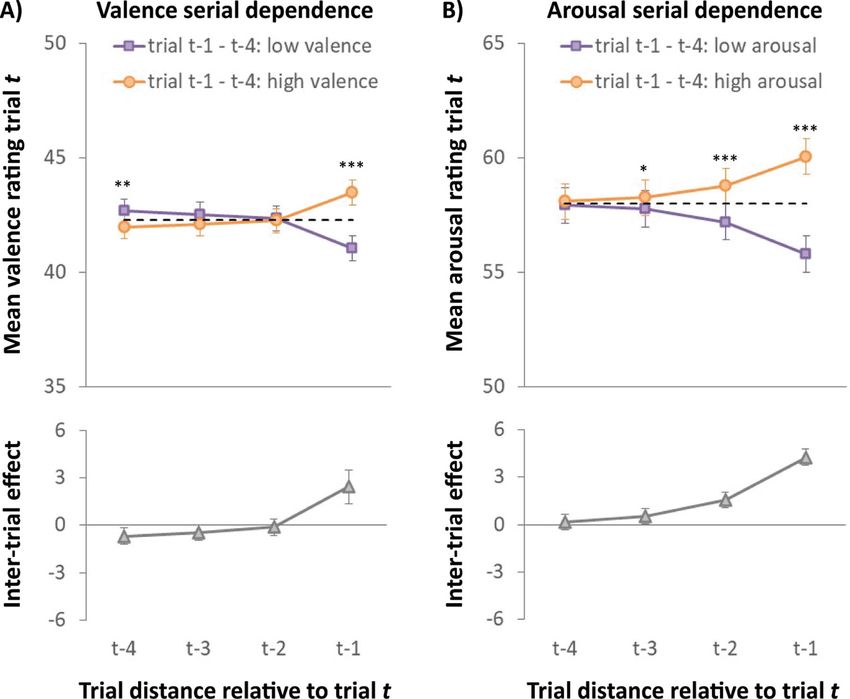
HUMANITIES AND SOCIAL SCIENCES COMMUNICATIONS | https://doi.org/10.1057/s41599-021-00909-4                                        ARTICLE

that trial (up to four trials back; for a similar approach see: Van          images (850 × 640 pixels): 50 images were selected from the
der Burg and Goodbourn, 2015; Van der Burg et al., 2019). We                 CROCUFID cross-cultural food image database (Toet et al.,
expect a positive serial dependence if (a) the food images evoke an          2019b) and 10 images were selected from the FoodCast research
emotional response, and (b) if that response remains present for a           image database (FRIDa, Foroni et al., 2013). Figure 1b shows
while such that the emotion for the subsequent food image is                 some representative images that were used in the present study.
merged with the previous emotion. There is ample evidence that               The full set of stimuli is described in more detail elsewhere
people’s nationality may affect their perception and experience of           (Kaneko et al., 2018; Toet et al., 2018) and is also available online
food (Ichijo and Ranta, 2016; O’Connor, 2009). For instance,                 (https://osf.io/cyqg7/download). The set of food images were
Kaneko et al. (2018) observed that Japanese participants sys-                selected such that their associated mean valence (as determined in
tematically reported lower mean arousal and used a smaller range             earlier studies, see Toet et al., 2018, 2019a) are distributed along
of the valence scale for food images than European participants.             the entire scale (ranging from very low valence for rotten,
Given that our sample contains participants from 16 different                moulded or contaminated food, via neutral for raw onions, boiled
countries (Bulgaria, Canada, China, Netherlands, Ethiopia, Ger-              eggs or potatoes, to very high valence for fresh fruit, chocolates
many, Indonesia, Iran, Japan, Korea, Nigeria, Pakistan, South                and pastries). The 10 additional food images from the validated
Africa, Taiwan, Turkey, and United Kingdom), we also examine                 FRIDa database were selected such that their associated valence
whether nationality moderates the serial dependence for affective            scores (as reported in their accompanying data file, see Foroni
appraisal of food images (in terms of valence and arousal). To the           et al., 2013) also cover a large part of the scale. These validated
best of our knowledge, no previous study examined whether serial             FRIDa images were included as anchor points for verification
dependencies in general (regardless of the stimuli) depend on the            purposes (see Toet et al., 2018). Based on previous studies, the
participants’ nationality, as most studies used rather small sample          associated mean valence ratings range between 2 and 90 on a
sizes (in the order of 10–20 participants) with participants from a          scale from 0 to 100 (Kaneko et al., 2018; Toet et al., 2018).
rather homogeneous group (e.g., Australian students in the study
by Van der Burg et al., 2019). Besides nationality, we also examine
                                                                             Measures. Valence and arousal were measured with the Emo-
whether the participants’ age, gender, and body mass index (BMI)
                                                                             jiGrid (see Fig. 1a; this tool was introduced in Toet et al., 2018).
moderate the serial dependence for valence and arousal, as these
                                                                             The EmojiGrid is a rectangular grid (similar to the Affect Grid:
are known to influence food-evoked emotions. For instance,
                                                                             Russell et al., 1989) that is labelled with emoji showing dif-
Burger et al. (2011) observed that BMI correlated positively with
                                                                             ferent facial expressions. The facial expressions of the emoji
the rated appeal of discretionary foods (desserts, energy dense
                                                                             along the horizontal (valence) axis vary from unpleasant (left)
foods), while Abdella et al. (2019) found that age, gender and
                                                                             via neutral to pleasant (right) (scale 0–100), while the intensity
BMI all affect food craving. Note that BMI is also related to
                                                                             of their expressions gradually increases along the vertical
nationality: people in more individualistic countries (e.g., United
                                                                             (arousal) axis (scale 0–100). The opening of the mouth and the
Kingdom) have higher BMI than people in collectivist countries
                                                                             shape of the eyes represent the arousal dimension, while the
(e.g., Japan; Masood et al., 2019).
                                                                             concavity of the mouth, the orientation and curvature of the
                                                                             eyebrows, and the vertical distribution of these features over
Methods                                                                      the area of the face express the degree of valence. Participants
Participants. In total, 1322 participants from 16 different coun-            report their affective state (valence and arousal) by placing a
tries [Bulgaria (BG), Canada (CA), China (CN), Netherlands (NL),             checkmark at the appropriate location on the grid. Previous
Ethiopia (ET), Germany (DE), Indonesia (ID), Iran (IR), Japan                validation studies confirmed that the facial expressions of the
(JP), Korea (KP), Nigeria (NG), Pakistan (PK), South Africa (ZA),            emoji and their arrangement over the valence-arousal space
Taiwan (TW), Turkey (TR) and United Kingdom (UK)] partici-                   agreed with the users’ intuition (Toet et al., 2018). In previous
pated in the experiment. The data from 44 participants (3.1%)                studies we found that users were intuitively able to use the
were discarded from further analyses, because of the following               EmojiGrid to report their food-evoked emotions (Kaneko et al.,
exclusion criteria: age (< 18 years, > 80 years, or not provided),           2018; Toet et al., 2018). The EmojiGrid has been extensively
body height (unrealistic: < 140 or > 210 cm, or not provided), or            validated with different age groups, nationalities, and ethni-
weight (unrealistic: < 35 kg, or not provided). Note that we                 cities for a range of different affective stimuli (Kaneko et al.,
excluded people based on their body height or weight as these two            2018; Toet et al., 2018, 2019a; Toet and Van Erp, 2019).
numbers are required to calculate the BMI. The demographic
information from the remaining 1278 participants (795 females;
                                                                             Procedure. Participants took part in an anonymous online
mean age: 29.8 years, ranging from 18 to 72 years; mean BMI: 23.6,
                                                                             survey. The survey commenced by presenting general infor-
ranging from 13.2 to 70.2) for each country is shown in Table 1.
                                                                             mation about the experiment and thanking participants for
Most participants were recruited through postings on social media
                                                                             their contribution. Also, the participants were asked to per-
and direct emailing. Groups from Germany and the United
                                                                             form the survey on a (laptop) computer only (smartphones
Kingdom were recruited via the Prolific database (https://
                                                                             and other handheld devices with small displays were not
prolific.ac), and participants from Japan via the Crowdworks
                                                                             allowed) and to activate the full-screen mode of their web
database (https://crowdworks.jp). Exclusion criteria were age
                                                                             browser to maximize the resolution and to avoid distractions
(either younger than 18 years or older than 80 years) and colour
                                                                             from other software that could be running in the background.
vison deficiencies. Participation was voluntary, and all participants
                                                                             Subsequently, participants were informed that they would see
were naïve as to the purpose of the experiment. The experimental
                                                                             60 different food images during the experiment, and they were
protocol was reviewed and approved by the TNO Ethics Com-
                                                                             asked to rate their first impression of each image. It was
mittee (Ethical Approval Ref: 2017-011), and was in accordance
                                                                             emphasized that there were no correct or incorrect answers,
with the Helsinki Declaration of 1975, as revised by the World
                                                                             and that it was important to respond seriously. Subsequently,
Medical Association (World Medical Association, 2013).
                                                                             participants electronically signed an informed consent by
                                                                             clicking “I agree to participate in this study”, affirming that
Stimuli. The experiment was setup and run using Gorilla (see                 they were at least 18 years old and voluntarily participated in
www.gorilla.sc). The stimulus set consisted of 60 different food             the study. The survey then continued with an assessment of

HUMANITIES AND SOCIAL SCIENCES COMMUNICATIONS | (2021)8:228 | https://doi.org/10.1057/s41599-021-00909-4                                        3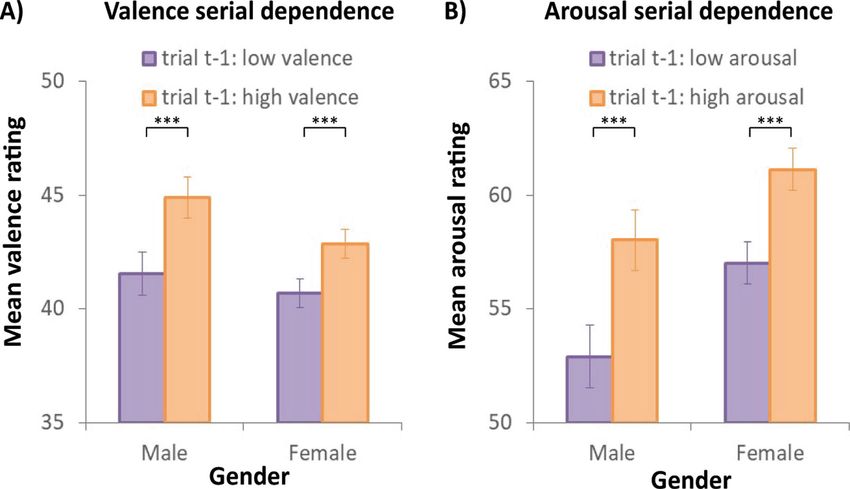
ARTICLE                                                HUMANITIES AND SOCIAL SCIENCES COMMUNICATIONS | https://doi.org/10.1057/s41599-021-00909-4

 Table 1 Demographic information for each country.

                                    n                       Females            Mean age               Age range               Mean BMI             BMI range
 Bulgaria                           70                      60                 38.8                   18–57                   24.9                 16.2–38.5
 Canada                             79                      57                 22.4                   19–46                   26.4                 17.6–70.2
 China                              50                      40                 23.5                   18–48                   21.3                 15.4–39.4
 Ethiopia                           64                      12                 34.1                   23–58                   22.7                 15.4–29.4
 Germany                            64                      31                 31.0                   18–58                   24.2                 16.2–38.1
 Indonesia                          104                     77                 34.5                   18–71                   24.1                 14.6–40.6
 Iran                               77                      43                 31.9                   12–59                   23.4                 14.5–30.2
 Japan                              102                     67                 37.4                   18–61                   21.3                 15.2–32.9
 Korea                              64                      54                 31.0                   20–47                   21.3                 16.8–32.9
 Netherlands                        58                      36                 26.8                   16–67                   23.3                 17.3–51.0
 Nigeria                            62                      32                 33.6                   22–55                   24.7                 14.0–33.2
 Pakistan                           49                      15                 29.8                   20–58                   25.1                 17.2–36.1
 South Africa                       167                     124                24.6                   18–73                   24.2                 16.8–42.3
 Taiwan                             148                     65                 19.9                   18–42                   21.4                 13.2–32.1
 Turkey                             60                      36                 33.8                   18–57                   23.9                 17.3–36.1
 UK                                 60                      46                 36.2                   18–64                   26.9                 15.8–59.7
 Total                              1278                    795                29.8                   18–73                   23.6                 13.2–70.2

 Only females and males participated (i.e., no gender-neutral participants).

Fig. 1 Rating tool and stimuli. A EmojiGrid affective self-report tool used to rate valence (horizontal axis) and arousal (vertical axis) for each image.
B Example images used in the present study.

the demographics (age, gender, height, and weight). Next, the                             Data analysis
participants were shown the EmojiGrid response tool together                              Valence serial dependence. We performed an inter-trial analysis to
with a brief explanation about its use: “Click on a point in the                          examine whether the valence rating on a given trial t depends on
grid that best matches your feelings towards the picture”. No                             the valence rating on the previous trial (t−1; for a similar
further reference was made to the dimensions of valence and                               approach, see e.g. Alais et al., 2017, 2015; Harvey et al., 2014; Van
arousal. Then they performed two practice trials to further                               der Burg et al., 2013, 2015, 2019). Thereto, for each participant
familiarize themselves with the use of this tool. Immediately                             individually, we first calculated the Median valence rating over all
after these practice trials, the actual experiment started. The                           the 60 food images (i.e., a neutral valence rating). Subsequently,
60 different food images were randomly presented over the                                 each image was either labelled ‘low valence’ or ‘high valence’, if
course of the experiment. On each trial, participants saw a                               the valence rating for that particular image was either < or ≥ than
food image and reported their affective appraisal using the                               the participant’s Median valence rating, respectively. Then, we
EmojiGrid. The entire experiment lasted about 10 min on                                   binned the data into two bins. One bin contained those trials in
average. The instructions were provided in English for all                                which the preceding food image was labelled low valence, and the
countries, except for China, Indonesia, Iran and Turkey. For                              other bin represented those trials in which the preceding trial was
these countries, the instructions were translated into Man-                               labelled high valence. We then calculated the mean valence rating
darin, Bahasa Indonesia, Farsi and Turkish, respectively.                                 for each bin. The difference between the mean high and low
Screenshots illustrating the procedure and the screen layout                              valence bins then represents the valence inter-trial effect for that
are available online (https://osf.io/cyqg7/download).                                     participant. Note that this analysis was not only conducted for

4                                       HUMANITIES AND SOCIAL SCIENCES COMMUNICATIONS | (2021)8:228 | https://doi.org/10.1057/s41599-021-00909-4
HUMANITIES AND SOCIAL SCIENCES COMMUNICATIONS | https://doi.org/10.1057/s41599-021-00909-4 ARTICLE
one trial back, but also for up to four trials back (i.e., trial t−2, t mean valence rating (on a 100-point scale) on a given trial t as a
−3, and t−4). These analyses were identical to the one described function of the valence rating for trial t−1 back to trial t−4. The
above with the exception that for each trial back, two new bins valence inter-trial effect (i.e., the difference between the high and
were created. For instance, for a sequential effect two trials back low valence ratings in the upper panel) is plotted as a function of
(t−2), one bin contained those trials in which the food image on the trial distance relative to the current trial t in the lower panel.
trial t−2 was labelled low valence, and the other bin representing The ANOVA on the mean valence inter-trial effect yielded a
those trials in which trial t−2 was labelled high valence. For each significant trial distance effect, F(3, 3831) = 34.855, p < 0.001,
of the four analyses (t−1, t−2, etc.), the first four trials of the indicating that the inter-trial effect varied as a function of trial
experiment were excluded from further analyses since we were distance relative to the current trial t (see lower panel in Fig. 2a).
interested in inter-trial effects up to four trials back. We con- The inter-trial effect for trial t−1 (2.4) was significantly different
ducted a repeated measures ANOVA on the mean valence inter- from zero, t(1277) = 9.277, p < 0.001, as the valence rating on a
trial effect with trial distance (1–4) as within-subjects variable. given trial t was greater when the valence rating on the previous
Here and elsewhere in the manuscript, α was set to 0.05 and, if trial was high than when it was low (i.e., a positive serial
applicable, p-values were Huynh–Feldt corrected for sphericity dependence). The inter-trial effect was not significantly different
violations. The trial distance effect was further investigated using from zero with regard to trial t−2 (−0.1, t(1277) = 0.457,
one sample two-tailed t-tests for each trial distance to examine p = 0.647) and trial t−3 (−0.4, t(1277) = 1.749, p = 0.081).
whether the inter-trial effect was significantly different from zero. Interestingly, a repulsive inter-trial effect was observed with
Unless otherwise stated, all statistical analysis were conducted respect to trial t−4 (−0.7), t(1277) = 2.824, p = 0.005, as the
using Just Another Statistical Package (JASP, Love et al., 2019). valence rating on trial t was significantly lower when the valence
rating four trials back was high than when it was low.
Arousal serial dependence. A similar inter-trial analysis was
conducted to investigate whether the mean arousal rating on a
given trial t depends on the arousal rating on the previous four Arousal serial dependencies. Subsequently, we investigated
trials. The statistical analysis was the same as the analysis for the whether the arousal rating on a given trial t depends on the
valence serial dependence. arousal rating up to four trials back (i.e., trial t−1, t−2, t−3, and t
−4). Figure 2b depicts the mean arousal rating (on a 100-point
Serial dependencies for individual images. We performed both a scale) on a given trial t as a function of the arousal rating for trial
valence and an arousal inter-trial analysis for each food image t−1 back to trial t−4. The arousal inter-trial effect (i.e., the dif-
used in the present experiment to examine whether all images ference between the high and low arousal ratings in the upper
were susceptible to the valence and arousal rating on the previous panel) is plotted as a function of the trial distance relative to the
trial, respectively. Here, and in the remaining analyses, we focus current trial t in the lower panel.
on the previous trial (t−1) only. Therefore, only the first trial was The ANOVA on the mean arousal inter-trial effect yielded a
discarded from further analyses. Provided that each image was significant trial distance effect, F(3, 3831) = 80.590, p < 0.001,
only shown once to each participant and, if it was not the first indicating that the inter-trial effect varied as a function of trial
image in the experiment, it could either follow a low rated image distance relative to the current trial t (see lower panel in Fig. 2b).
or a high rated image. Therefore, for each food image, we con- The inter-trial effects were significantly different from zero for
ducted an independent t-test with valence rating (low versus trial t−1 (4.3, t(1277) = 16.907, p < 0.001), t−2 (1.6,
high) as between-subjects variable. Similar analyses were con- t(1277) = 6.267, p < 0.001), and t−3 (0.5, t(1277) = 2.085,
ducted for each image on the mean arousal rating. Statistical p < 0.05). The sign of these sequential effects was positive,
analyses were performed using the SciPy module in Python suggesting that the arousal rating on trial t was significantly
(Virtanen et al., 2020). higher when the arousal ratings on trial t−1, t−2, or t−3 were
high than when the arousal ratings on these preceding trials were
The effect of gender, age, BMI and nationality. To examine low. The sequential effect was not significantly different from zero
whether demographic variables moderate the valence and arousal for trial t−4 (0.2, t(1277) = 0.605, p = 0.545).
serial dependencies, we conducted an ANCOVA on the valence
and arousal inter-trial effects with age and BMI as continuous
variables and gender and nationality as categorical variables. For Serial dependencies for individual images. Figure 3a and b
each participant, the BMI was calculated using Eq. (1) (Keys et al., illustrate the mean arousal rating as a function of the mean
1972): valence rating for each food image for both the valence as well as
the arousal inter-trial effect, respectively.
weight kg As shown in Fig. 3 (upper panels), the mean valence and
body mass index ¼ ð1Þ
height ðmÞ2 arousal ratings for the 60 food images used in the present study
were rather diverse and spread over the valence-arousal space,
Here, the BMI is computed as the ratio between the participants’ forming a U-shaped pattern (see also Kaneko et al., 2018; Toet
self-reported weight (kg) and squared height (m2). et al., 2018). A question is then whether the observed valence and
If a particular covariable turns out to have a significant effect arousal inter-trial effects hold for each image used, or whether the
on a sequential dependence, then we conduct an ANOVA on the sequential effects observed were driven by a subset of the images
mean sequential dependence rating with previous rating (low or used. For instance, the observed inter-trial effects could be driven
high) as within-subject variable and the covariable as between- predominantly by images whose rating was ~50.0 (i.e., a rather
subject variable. neutral rating) and to a lesser extent by images rated at either
ceiling or floor performance, as in the latter two cases there is
Results simply less room for an increment or decrement, respectively.
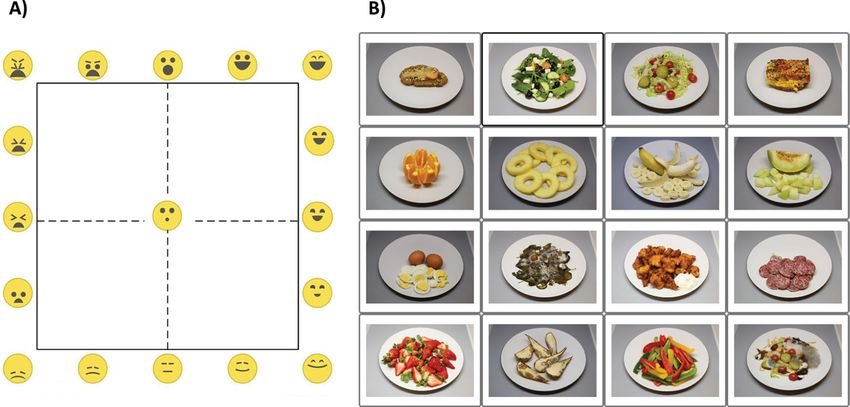
Valence serial dependencies. We first examined whether the Here, and in the remaining part of the manuscript, we only take
valence rating on a given trial t depends on the valence rating up into account the ratings on the previous trial. Figure 3c and d
to four trials back (i.e., either trial t−1, t−2, t−3 or t−4; see illustrate the valence and arousal inter-trial effects for each image,
Manassi et al., 2018, for a similar approach). Figure 2a depicts the as a function of the mean valence and mean arousal rating,
HUMANITIES AND SOCIAL SCIENCES COMMUNICATIONS | (2021)8:228 | https://doi.org/10.1057/s41599-021-00909-4 5ARTICLE HUMANITIES AND SOCIAL SCIENCES COMMUNICATIONS | https://doi.org/10.1057/s41599-021-00909-4 Fig. 2 Sequential effects for food image processing. A Upper panel: Mean valence rating (on a 100-point scale) on trial t as a function of the valence rating (low: purple squares, or high: orange circles) on trial t−1 back to trial t−4. The dotted line indicates the group mean valence rating. Lower panel: Valence inter-trial effect (i.e., the difference between the high and low valence rating in the upper panel) as a function of the trial distance relative to the current trial t. B Upper panel: Mean arousal rating on trial t as a function of the arousal rating (low: purple squares, or high: orange circles) on trial t−1 back to trial t−4. The dotted line indicates the group mean arousal rating. Lower panel: Arousal inter-trial effect (i.e., the difference between the high and low arousal rating in the upper panel) as a function of the trial distance relative to the current trial t. Error bars represent the ±2 standard error of the mean. Significance levels: *p < 0.05, **p < 0.01, and ***p < 0.001. respectively. Here, each circle represents a food image (like in to the valence rating, the mean arousal rating never approached Fig. 3a and b). floor performance, and the optimal quadratic fit was more like a Regarding valence, a positive serial dependence was observed linear fit, with the food images above the fit showing a significant for 55 (out of 60) food images (i.e., 91.7% of the images). The effect regardless the mean arousal rating. two-tailed independent t-tests yielded a significant inter-trial We observed a valence as well as an arousal sequential effect effect for 50.0% of all the images (see the red dots in Fig. 3c). To for the vast majority of food images. However, this assimilative correct for multiple comparisons, we applied false detection rate effect was not statistically significant for all images. An (FDR) correction on the p-values (Benjamini and Hochberg, explanation for why this was not the case is that each image 1995). After correction, there was a significant effect for 35.0% of was only presented once to each participant, making the inter- the images. In general, a positive serial dependence for valence trial effect rather noisy. In the case of valence, strongest inter-trial was observed for most food images used (although not all food effects were observed for those images which were rated as rather images showed a significant effect). However, as is clear from the neutral (i.e., valence preference was not clearly determined). In quadratic fit in Fig. 3c, the valence inter-trial effect was most the case of arousal, there was no clear subset that drove the inter- pronounced for the images whose mean valence rating was far trial effect. away from either floor (mean valence rating < 10.0) or ceiling (mean valence rating > 70.0) performance, and rather minimal The effect of gender, age, BMI and nationality. We conducted when the valence rating approached either ceiling or floor an ANCOVA on both the mean valence and arousal inter-trial performance. effects with age and BMI as continuous variables and gender and Regarding arousal, a positive serial dependence was observed nationality as categorical variables to examine whether these co- for 59 out of 60 food images (i.e., 98.3%). The t-tests yielded a variables moderate the observed effects. With regard to the significant inter-trial effect for 66.7% of the images (see the red arousal rating, the ANCOVA yielded a significant effect of gen- dots in Fig. 3d). Note that after FDR correction, a significant der, F(1, 1244) = 5.266, p = 0.022, indicating that gender mod- inter-trial effect was observed for 63.3% of the images. In contrast erated the arousal serial dependence. None of the other variables 6 HUMANITIES AND SOCIAL SCIENCES COMMUNICATIONS | (2021)8:228 | https://doi.org/10.1057/s41599-021-00909-4
HUMANITIES AND SOCIAL SCIENCES COMMUNICATIONS | https://doi.org/10.1057/s41599-021-00909-4                                                   ARTICLE

Fig. 3 Valence and arousal inter-trial effects for each image (left versus right panels, respectively). A and B Mean arousal rating as a function of the
mean valence rating for each of the 60 food images. In panel A, the orange circles signify those trials whereby the image was preceded by an image with a
high valence rating, whereas the purple squares signify the opposite. In panel B, the orange circles signify those trials in which the image was preceded by
an image with a high arousal rating, whereas the purple squares signify the opposite. C Valence inter-trial effect as a function of the mean valence rating for
each food image. Red circles indicate a significant difference (p < 0.05; two-tailed independent t-test), whereas grey circles signify non-significant
differences. D Arousal inter-trial effect as a function of the mean arousal rating for each food image. Note that the continuous lines in all panels represent
quadratic fits to the data points (see also Kaneko et al., 2018).

were significant (all F-values ≤ 1.413, p-values ≥ 0.133). With                   and gender (male or female) as between subject variable. The
regard to the valence rating, the ANCOVA yielded a trend                         ANOVA yielded a significant previous valence rating × gender
towards a significant gender effect, F(1, 1244) = 3.450, p = 0.063,               interaction, F(1, 1276) = 5.217, p = 0.023, as the valence serial
suggesting that gender moderated the valence serial dependence                   dependence was larger for males than for females (3.4 versus 2.2).
(note that without nationality as covariate, the effect of gender                Importantly, the inter-trial effect was significant for both males
was significant, F(1, 1274) = 4.712, p = 0.030). All other effects                and females, t(482) = 8.380, p < 0.001, and t(794) = 6.671,
were not significant (all F-values ≤ 2.580, p-values ≥ 0.108).                    p < 0.001, respectively. The main effect of gender was also
   Next, we examined how gender affected the serial dependen-                    significant, F(1, 1276) = 9.217, p = 0.002, as the valence rating
cies. Figure 4a illustrates the mean valence rating as a function of             was overall larger for males (43.3) than for females (41.8).
the valence rating on the previous trial for both males (n = 483)                   Figure 4B illustrates the mean arousal rating as a function of
and females (n = 795).                                                           the arousal rating on the previous trial for both males and
   We conducted an ANOVA on the mean valance rating with                         females. We conducted an ANOVA on the mean arousal rating
previous valence rating (low, or high) as within subject variable                with previous arousal rating (low, or high) as within subject

HUMANITIES AND SOCIAL SCIENCES COMMUNICATIONS | (2021)8:228 | https://doi.org/10.1057/s41599-021-00909-4                                                     7
ARTICLE                                   HUMANITIES AND SOCIAL SCIENCES COMMUNICATIONS | https://doi.org/10.1057/s41599-021-00909-4

Fig. 4 The effect of gender on the valence and arousal serial dependencies. A Mean valence rating as a function of the valence rating on the previous trial
for males and females. B Mean arousal rating as a function of the arousal rating on the previous trial for males and females. Error bars represent the
±2 standard error of the mean. Significance levels: *p < 0.05, **p < 0.01, and ***p < 0.001.

variable and gender (male or female) as between subject variable.              dependence, it is more likely that their effect reflects a visual
The ANOVA yielded a significant previous arousal rating                         phenomenon. Although, in the present study, participants were
 × gender interaction, F(1, 1276) = 3.945, p = 0.047, as the arousal           instructed to rate the food images by visual inspection, it is most
serial dependence was larger for males than for females (5.1                   likely that the observed serial dependence reflects an emotional
versus 4.1). Importantly, the inter-trial effect was significant for            process that is per definition amodal (LeDoux, 2007; McDonald,
both males and females, t(482) = 12.873, p < 0.001, and                        1998). In other words, if participants have an emotional response
t(794) = 12.947, p < 0.001, respectively. The main effect of gender            when they view a food image, then we propose that some residual
was also significant, F(1, 1276) = 23.135, p < 0.001, as the arousal            emotional activity remains present in the brain when viewing the
rating was overall larger for females (59.1) than for males (55.5).            subsequent food image, such that the evoked emotional response
                                                                               to new images is more a mixture of the previous emotion and the
Discussion and conclusion                                                      actual emotion triggered by the new image. This may also explain
In the present study, we investigated whether sequential effects               why we observed a positive serial dependence (as the emotions
play a role in the affective appraisal of food images. Here we                 are merged), and why we found effects up to three trials back in
showed for the first time that both the valence and arousal ratings             our current study using food images, and others even up to 5 or
for a food image are contingent upon the valence and arousal                   more trials back using faces (Van der Burg et al., 2019; Xia et al.,
rating of a different food image on the previous trial, respectively.          2016). These sequential dependencies over multiple trials may
More specifically, a positive sequential dependence was observed                reflect the temporal window over which visual information (in
with regard to the valence rating on the previous trial, indicating            the case of faces) or emotional information (in the case of food
that the valence rating for a given image was higher when the                  images) is merged. However, an alternative possibility is that the
previous food image was rated high on valence than when the                    inter-trial effect over multiple trials does not reflect the temporal
previous food image was rated low on valence. A similar positive               window over which multiple emotional experiences are merged,
sequential effect was observed for the arousal rating. For the                 but instead represents a carry-over effect from one trial to another
arousal rating, this assimilative effect was also observed up to               (i.e., trial t−2 affects trial t−1, and trial t−1 affects trial t,
three trials back, indicating that even the arousal rating of a food           explaining why indirectly trial t−2 affects trial t). An intriguing
image three trials back affects the rating on the current trial.               and another open question is then why such a merging effect or
Interestingly, for the valence rating, we observed a negative                  carry over effect should go up to three trials back for arousal
(repulsive) effect with regard to the valence rating four trials back,         ratings and only one trial back for valence ratings, as observed in
indicating that the valence rating on a given trial was higher when            the present study.
a food image four trials back was rated low on valence than when                  In the present study, participants were always instructed to rate
it was rated high on valence.                                                  the food images. Therefore, it remains unclear whether simply
   The present study is not the first study reporting a serial                  viewing a food image is sufficient to observe an assimilative serial
dependence using emotional stimuli. Liberman et al. (2014) found               dependence or whether an explicit emotional task is a prerequisite
a positive serial dependence when participants were instructed to              to observe the effect. Recently, Van der Burg et al. (2019) found
rate the emotion of a facial expression on successive trials.                  evidence for a positive serial dependence when participants were
Although the positive serial dependence in the Liberman et al.                 instructed to judge the attractiveness of a face from trial-to-trial.
study can, in principle, be assigned to an emotional serial                    However, this positive serial dependence disappeared when the

8                            HUMANITIES AND SOCIAL SCIENCES COMMUNICATIONS | (2021)8:228 | https://doi.org/10.1057/s41599-021-00909-4
HUMANITIES AND SOCIAL SCIENCES COMMUNICATIONS | https://doi.org/10.1057/s41599-021-00909-4 ARTICLE
task alternated between a gender judgement task and attractive- for food images are due to sex differences in the brain (Cahill,
ness task even though the same stimuli were used. Thus, when the 2006). For instance, it might be possible that short term
previous trial was associated with a different task, the serial memory consolidation for emotions is decreased in males
dependence for facial attractiveness was absent. This supports the compared to females, explaining why the most recent emo-
idea that positive serial dependencies (for at least facial attrac- tional experiences are more pronounced on the current trial for
tiveness) are task specific (but see Van der Burg et al., 2018). males than for females (see LaBar and Cabeza, 2006 for an
However, other studies reported both a positive serial dependence interesting review regarding memory for emotions).
(Fornaciai and Park, 2018) and a negative serial dependence (Van Summarizing, we reported here for the first time that the
der Burg et al., 2013) when no judgement was made on the affective appraisal of a food image depends on the food images
preceding trial (i.e., a passive trial), indicating that sequential that have been perceived in the immediate past. This effect
dependencies can, in principle, arise rather effortlessly and occurred for most food images. This finding may be relevant for
automatically. The present study does not afford any conclusions the design of websites of O2O food delivery services or restaurant
about whether simply viewing an image is sufficient to elicit an menus. In principle, one could design these sites such that they
assimilative serial dependence as the participants always per- influence a person’s preference by manipulating the order of the
formed the task. images. Whether the effect is large enough to be relevant is still an
To our knowledge, the present study is the first study inves- open question. Although an effect of 5 points on a 100-point scale
tigating whether nationality moderates serial dependencies. In may look small, it may be quite appreciable when the response
general, we observed an assimilative serial dependence with range is taken into account (see Fig. 3 for the minimum and
regard to the valence and arousal rating. Such positive after- maximum valence and arousal ratings).
effects are proposed to reflect post-perceptual processes, such as
decisional and response selection processes, and it is therefore Data availability
possible that such processes may be driven by the participants’ The dataset analysed in the current study is available in the OSF
country of residence as food perception in general depends largely repository: https://osf.io/heugb/download
on the participants’ culture, or nationality (Ichijo and Ranta,
2016; O’Connor, 2009). However, we did not find any evidence Received: 3 December 2020; Accepted: 27 September 2021;
that nationality moderates the positive serial dependence for
neither the valence nor arousal rating. That nationality did not
moderate the serial dependence for food evoked emotions sug-
gests that the inter-trial effect generalizes across different coun-
tries (or at least, for the 16 different countries we tested).
Interestingly, using the same EmojiGrid rating method, Kaneko References
Abbar S, Mejova Y, Weber I (2015) You tweet what you eat: studying food con-
et al. (2018) reported that the valence and arousal rating of food sumption through Twitter. In: Begole B, Kim J, Inkpen K, Woo W (Eds), 33rd
images differed significantly across different nationalities. Even Annual ACM Conference on Human Factors in Computing Systems. ACM,
though a part of our data set was identical to the data set in their New York, NY, pp. 3197–3206. https://doi.org/10.1145/2702123.2702153
study, we did not observe any evidence for a nationality effect Abdella HM, El Farssi HO, Broom DR et al. (2019) Eating behaviours and food
cravings; Influence of age, sex, BMI and FTO genotype. Nutrients 11(2):377.
with regard to the serial dependencies. In the present study we https://doi.org/10.3390/nu11020377
also did not find any evidence that age and BMI moderate the Alais D, Leung J, Van der Burg E (2017) Linear summation of repulsive and
valence and arousal serial dependencies. attractive serial dependencies: orientation and motion dependencies sum in
Whereas nationality, age and BMI did not moderate the motion perception. J Neurosci 37(16):4381–4390. https://doi.org/10.1523/
inter-trial effects, we find that gender had a significant effect on jneurosci.4601-15.2017
Alais D, Orchard-Mills E, Van der Burg E (2015) Auditory frequency perception
both serial dependencies. Overall, mean valence was rated adapts rapidly to the immediate past. Atten Percept Psychophys
higher by males than by females, while females gave higher 77(3):896–906. https://doi.org/10.3758/s13414-014-0812-2
mean arousal ratings than males. These results may reflect Andersson TD, Getz D, Vujicic S et al. (2016) Preferred travel experiences of
gender differences in cerebral responses to food images: while foodies: an application of photo elicitation. J Vacat Mark 22(1):55–67. https://
females show a greater activation than males in lateral pre- doi.org/10.1177/1356766715589621
Barbosa J, Compte A (2020) Build-up of serial dependence in color working
frontal midline cortical regions (including the insula, a region memory. Sci Rep 10(1):10959. https://doi.org/10.1038/s41598-020-67861-2
implicated in arousal-related feelings of hunger, visceral sen- Beldona S, Buchanan N, Miller BL (2014) Exploring the promise of e-tablet res-
sations and current need states) males in contrast show a taurant menus. Int J Contemp Hosp Manag 26(3):367–382. https://doi.org/
greater activation than females in the Amygdala (a primal 10.1108/IJCHM-01-2013-0039
limbic structure involved in determining the valence or Benjamini Y, Hochberg Y (1995) Controlling the false discovery rate: a practical
and powerful approach to multiple testing. J R Stat Soc Ser B Stat Methodol
attractiveness of food, Killgore and Yurgelun-Todd, 2010). 57(1):289–300. https://doi.org/10.1111/j.2517-6161.1995.tb02031.x
Furthermore, it is also known that females report higher Burger KS, Cornier MA, Ingebrigtsen J et al. (2011) Assessing food appeal and
arousal ratings than males for some types of food (e.g. fruits desire to eat: the effects of portion size & energy density. Int J Behav Nutr
and deserts, Padulo et al., 2017). While males and females both Phys Act 8(1):1–9. https://doi.org/10.1186/1479-5868-8-101
showed positive valence and arousal sequential dependencies, Cahill L (2006) Why sex matters for neuroscience. Nat Rev Neurosci 7(6):477–484.
https://doi.org/10.1038/nrn1909
the inter-trial effects were significantly larger for males than Dalenberg JR, Gutjar S, ter Horst GJ et al. (2014) Evoked emotions predict food
for females. This is an intriguing finding as this may suggest choice. PLoS ONE 9(12):e115388. https://doi.org/10.1371/journal.pone.0115388
that females apply a different strategy than males. For instance, Desmet PMA, Schifferstein HNJ (2008) Sources of positive and negative emo-
a larger inter-trial effect may indicate that males may be more tions in food experience. Appetite 50(2-3):290–301. https://doi.org/
inclined to repeat the previous response than females (i.e. 10.1016/j.appet.2007.08.003
Fischer J, Whitney D (2014) Serial dependence in visual perception. Nat Neurosci
response bias). However, the food images were presented in a 17(5):738–743. https://doi.org/10.1038/nn.3689
random order (such that positive and negative images were Fornaciai M, Park J (2018) Attractive serial dependence in the absence of an explicit
randomly shown), and we used an EmojiGrid, making it dif- task. Psychol Sci 29(3):437–446. https://doi.org/10.1177/0956797617737385
ficult for the participants to simply repeat the previous Foroni F, Pergola G, Argiris G et al. (2013) The FoodCast research image
response, like in a two-alternative forced-choice (2AFC) database (FRIDa). Front Hum Neurosci 7(51):1–19. https://doi.org/
10.3389/fnhum.2013.00051
paradigm. What is more likely, is that the serial dependencies
HUMANITIES AND SOCIAL SCIENCES COMMUNICATIONS | (2021)8:228 | https://doi.org/10.1057/s41599-021-00909-4 9ARTICLE HUMANITIES AND SOCIAL SCIENCES COMMUNICATIONS | https://doi.org/10.1057/s41599-021-00909-4
Fritsche M, Mostert P, de Lange FP (2017) Opposite effects of recent history on Padulo C, Carlucci L, Manippa V et al. (2017) Valence, familiarity and arousal of
perception and decision. Curr Biol 27(4):590–595. https://doi.org/10.1016/ different foods in relation to age, sex and weight. Food Qual Prefer
j.cub.2017.01.006 57:104–113. https://doi.org/10.1016/j.foodqual.2016.12.010
Gibson JJ, Radner M (1937) Adaptation, after-effect and contrast in the perception Peters A, Mennecke B (2011) The role of dynamic digital menu boards in con-
of tilted lines. I. Quantitative studies. J Exp Psychol 20(5):453–467. https:// sumer decision making. In: CHI ‘11 Extended abstracts on human factors in
doi.org/10.1037/h0059826 computing systems. pp. 1693–1698.
Gutjar S, de Graaf C, Kooijman V et al. (2015) The role of emotions in food choice Peters A, Mennecke B (2013) Digital menu boards as influencer for healthy eating.
and liking. Food Res Int 76(Part 2):216–223. https://doi.org/10.1016/ In: Kurosu M (Ed.) 15th International Conference on Human–Computer
j.foodres.2014.12.022 Interaction: Users and Contexts of Use, Part III. Springer Berlin Heidelberg,
Harry B, Williams M, Davis C et al. (2013) Emotional expressions evoke a dif- pp. 428–437 https://doi.org/10.1007/978-3-642-39265-8_48
ferential response in the fusiform face area. Front Hum Neurosci 7(692):1–6. Poor M, Duhachek A, Krishnan HS (2013) How images of other consumers
https://doi.org/10.3389/fnhum.2013.00692 influence subsequent taste perceptions. J Mark 77(6):124–139. https://doi.org/
Harvey C, Van der Burg E, Alais D (2014) Rapid temporal recalibration occurs 10.1509/jm.12.0021
crossmodally without stimulus specificity but is absent unimodally. Brain Res Rasia-Filho AA, Londero RG, Achaval M (2000) Functional activities of the
1585:120–130. https://doi.org/10.1016/j.brainres.2014.08.028 amygdala: an overview. J Psychiatry Neurosci 25(1):14–23
Ichijo A, Ranta R (2016) Food, national identity and nationalism: from everyday to Russell JA (1980) A circumplex model of affect. J Personal Soc Psychol
global politics. Palgrave McMillan. 39(6):1161–1178. https://doi.org/10.1037/h0077714
Jaeger SR, MacFie HJH (2001) The effect of advertising format and means-end Russell JA, Weiss A, Mendelson GA (1989) Affect grid: a single-item scale of
information on consumer expectations for apples. Food Qual Preference pleasure and arousal. J Personal Soc Psychol 57(3):493–502. https://doi.org/
12(3):189–205. https://doi.org/10.1016/S0950-3293(00)00044-6 10.1037/0022-3514.57.3.493
Kaneko D, Toet A, Ushiama S et al. (2018) EmojiGrid: a 2D pictorial scale for Schönfelder S, Kanske P, Heissler J et al. (2013) Time course of emotion-related
cross-cultural emotion assessment of negatively and positively valenced food. responding during distraction and reappraisal. Soc Cogn Affect Neurosci
Food Res Int 115:541–551. https://doi.org/10.1016/j.foodres.2018.09.049 9(9):1310–1319. https://doi.org/10.1093/scan/nst116
Kanwisher N, McDermott J, Chun MM (1997) The fusiform face area: a module in Spence C, Okajima K, Cheok AD et al. (2015) Eating with our eyes: from visual
human extrastriate cortex specialized for face perception. J Neurosci hunger to digital satiation. Brain Cogn 110(1):53–63. https://doi.org/10.1016/
17(11):4302–4311. https://doi.org/10.1523/jneurosci.17-11-04302.1997 j.bandc.2015.08.006
Keys A, Fidanza F, Karvonen MJ et al. (1972) Indices of relative weight and obesity. Taubert J, Van der Burg E, Alais D (2016) Love at second sight: sequential
J Chronic Dis 25(6):329–343. https://doi.org/10.1016/0021-9681(72)90027-6 dependence of facial attractiveness in an on-line dating paradigm. Sci Rep
Killgore WDS, Yurgelun-Todd DA (2010) Sex differences in cerebral responses to 6(1):22740. https://doi.org/10.1038/srep22740
images of high versus low-calorie food. NeuroReport 21(5):354–358. https:// Toet A, Eijsman S, Liu Y et al. (2019a) The relation between valence and arousal in
doi.org/10.1097/WNR.0b013e32833774f7 subjective odor experience. Chemosens Percept 13:141–151. https://doi.org/
Kiyonaga A, Scimeca JM, Bliss DP et al. (2017) Serial dependence across percep- 10.1007/s12078-019-09275-7
tion, attention, and memory. Trends Cogn Sci 21(7):493–497. https://doi.org/ Toet A, Kaneko D, de Kruijf I et al. (2019b) CROCUFID: A cross-cultural food
10.1016/j.tics.2017.04.011 image database for research on food elicited affective responses. Front Psy-
Kok R, Taubert J, Van der Burg E et al. (2017) Face familiarity promotes stable chol 10(58). https://doi.org/10.3389/fpsyg.2019.00058
identity recognition: exploring face perception using serial dependence. R Soc Toet A, Kaneko D, Ushiama S et al. (2018) EmojiGrid: a 2D pictorial scale for the
Open Sci 4(3):160685. https://doi.org/10.1098/rsos.160685 assessment of food elicited emotions. Front Psychol 9(2396). https://doi.org/
LaBar KS, Cabeza R (2006) Cognitive neuroscience of emotional memory. Nat Rev 10.3389/fpsyg.2018.02396
Neurosci 7(1):54–64. https://doi.org/10.1038/nrn1825 Toet A, Van Erp JBF (2019) The EmojiGrid as a tool to assess experienced and
Lagast S, Gellynck X, Schouteten JJ et al. (2017) Consumers’ emotions elicited by perceived emotions. Psych 1(1):469–481. https://doi.org/10.3390/psych1010036
food: a systematic review of explicit and implicit methods. Trends Food Sci Toet A, van Schaik CS, Kaneko D et al. (2019c) Do food cinemagraphs evoke
Technol 69:172–189. https://doi.org/10.1016/j.tifs.2017.09.006 stronger appetitive responses than stills? Int J Food Des 4(1):63–83. https://
LeDoux J (2007) The amygdala. Curr Biol 17(20):R868–R874. https://doi.org/ doi.org/10.1386/ijfd.4.1.63_1
10.1016/j.cub.2007.08.005 Townsend C, Kahn BE (2013) The “Visual Preference Heuristic”: the influence of
Lee L, Amir O, Ariely D (2009) In search of homo economicus: cognitive noise and visual versus verbal depiction on assortment processing, perceived variety,
the role of emotion in preference consistency. J Consum Res 36(2):173–187. and choice overload. J Consum Res 40(5):993–1015. https://doi.org/10.1086/
https://doi.org/10.1086/597160 673521
Liberman A, Fischer J, Whitney D (2014) Serial dependence in the perception of Van der Burg E, Alais D, Cass J (2013) Rapid recalibration to asynchronous
faces. Curr Biol 24(21):2569–2574. https://doi.org/10.1016/j.cub.2014.09.025 audiovisual stimuli. J Neurosci 33(37):14633–14637
Liu I, Norman WC, Pennington-Gray L (2013) A flash of culinary tourism: Van der Burg E, Alais D, Cass J (2015) Audiovisual temporal recalibration occurs
understanding the influences of online food photography on people’s travel independently at two different time scales. Sci Rep 5(1):1–7. https://doi.org/
planning process on Flickr. Tour Cult Commun 13(1):5–18. https://doi.org/ 10.1038/srep14526. Article number: 14526
10.3727/109830413X13769180530567 Van der Burg E, Alais D, Cass J (2018) Rapid recalibration to audiovisual asynchrony
Love J, Selker R, Marsman M et al. (2019) JASP: graphical statistical software for follows the physical—not the perceived—temporal order. Atten Percept Psy-
common statistical designs. J Stat Softw 88(2):1–17. https://doi.org/10.18637/ chophys 80(8):2060–2068. https://doi.org/10.3758/s13414-018-1540-9
jss.v088.i02 Van der Burg E, Goodbourn PT (2015) Rapid, generalized adaptation to asyn-
Luna D, Peracchio LA (2003) Visual and linguistic processing of ads by bilingual chronous audiovisual speech. Proc R Soc B: Biol Sci 282(1804):e20143083
consumers. Persuasive imagery: A Consumer response perspective. Lawrence https://doi.org/10.1098/rspb.2014.3083
Erlbaum Associates Publishers, Mahwah, NJ, pp. 153–175. Van der Burg E, Rhodes G, Alais D (2019) Positive sequential dependency for face
Manassi M, Liberman A, Kosovicheva A et al. (2018) Serial dependence in position attractiveness perception. J Vis 19(12):1–16. https://doi.org/10.1167/19.12.6.
occurs at the time of perception. Psychon Bull Rev 25(6):2245–2253. https:// Article number: 6
doi.org/10.3758/s13423-018-1454-5 Virtanen P, Gommers R, Oliphant TE et al. (2020) SciPy 1.0: fundamental algo-
Masood M, Aggarwal A, Reidpath DD (2019) Effect of national culture on BMI: a rithms for scientific computing in Python. Nat Methods 17(3):261–272.
multilevel analysis of 53 countries. BMC Public Health 19(1):1–11. https:// https://doi.org/10.1038/s41592-019-0686-2
doi.org/10.1186/s12889-019-7536-0. Article number: 1212 Wang O, Somogyi S, Charlebois S (2020) Food choice in the e-commerce era: a
McDonald AJ (1998) Cortical pathways to the mammalian amygdala. Prog Neu- comparison between business-to-consumer (B2C), online-to-offline (O2O)
robiol 55(3):257–332. https://doi.org/10.1016/S0301-0082(98)00003-3 and new retail. Br Food J 122(4):1215–1237. https://doi.org/10.1108/BFJ-09-
Mejova Y, Abbar S, Haddadi H (2016) Fetishizing food in digital age: #foodporn 2019-0682
around the world. In: Gummadi KP, Strohmaier M (Eds) 10th International World Medical Association (2013) World Medical Association declaration of Hel-
AAAI Conference on Web and Social Media (ICWSM-16). The AAAI Press, sinki: ethical principles for medical research involving human subjects. J Am
Palo Alto, California, pp. 250–258 Med Assoc 310(20):2191–2194. https://doi.org/10.1001/jama.2013.281053
Misirlisoy E, Haggard P (2014) Asymmetric predictability and cognitive compe- Xia Y, Yamanashi Leib A, Whitney D (2016) Serial dependence in the perception of
tition in football penalty shootouts. Curr Biol 24(16):1918–1922. https:// attractiveness. J Vis 16(15):1–8. https://doi.org/10.1167/16.15.28. Article
doi.org/10.1016/j.cub.2014.07.013 number: 28
O’Connor K (2009) Cuisine, nationality and the making of a national meal: the Xu X, Huang Y (2019) Restaurant information cues, Diners’ expectations, and
English breakfast. In: Carvalho S, Gemenne F (eds) Nations and their his- need for cognition: experimental studies of online-to-offline mobile food
tories: constructions and representations. Palgrave Macmillan, London, UK, ordering. J Retail Consum Serv 51:231–241. https://doi.org/10.1016/
pp. 157–171 j.jretconser.2019.06.010
10 HUMANITIES AND SOCIAL SCIENCES COMMUNICATIONS | (2021)8:228 | https://doi.org/10.1057/s41599-021-00909-4You can also read