A data generator for covid-19 patients' care requirements inside - UPV
←
→
Page content transcription
If your browser does not render page correctly, please read the page content below
Working Papers on Operations Management.

         WPOM                                                                               Vol. 12, Nº1 (76-115)
                                                                                                 ISSN: 1989-9068

                                                                                http://dx.doi.org/10.4995/wpom.15332
       Working Papers on
          Operations
         Management

         A data generator for covid-19 patients’ care requirements inside
                                       hospitals
         Juan A. Marin-Garciaa          , Angel Ruizb       , Julien Maheut c     and Jose P. Garcia-Sabaterd
a
 ROGLE. Dpto. de Organización de Empresas. Universitat Politècnica de València (Spain) jamarin@omp.upv.es ,
b
Département d’opérations et systèmes de décision , FSA ULaval(Canada). Angel.Ruiz@osd.ulaval.ca, c ROGLE.
Dpto. de Organización de Empresas. Universitat Politècnica de València (Spain) juma2@upvnet.upv.es and d
ROGLE. Dpto. de Organización de Empresas. Universitat Politècnica de València (Spain) jpgarcia@omp.upv.es.

Recibido: 2021-03-27 Aceptado: 2021-05-24

    To cite this article: Marin-Garcia, J.A.; Ruiz, A.; Maheu, J.; Garcia-Sabater, J.P. (2021). A data generator for covid-
    19 patients’ care requirements inside hospitals. WPOM-Working Papers on Operations Management, 12 (1), 76-
    115. doi: https://doi.org/10.4995/wpom.15332

           Abstract
           A Spanish version of the article is provided (see section before references). This paper
           presents the generation of a plausible data set related to the needs of COVID-19 patients
           with severe or critical symptoms. Possible illness’ stages were proposed within the context
           of medical knowledge as of January 2021. The parameters chosen in this data set were
           customized to fit the population data of the Valencia region (Spain) with approximately 2.5
           million inhabitants. They were based on the evolution of the pandemic between September
           2020 and March 2021, a period that included two complete waves of the pandemic.
           Contrary to expectation and despite the European and national transparency laws (BOE-A-
           2013-12887, 2013; European Parliament and Council of the European Union, 2019), the
           actual COVID-19 pandemic-related data, at least in Spain, took considerable time to be
           updated and made available (usually a week or more). Moreover, some relevant data
           necessary to develop and validate hospital bed management models were not publicly
           accessible. This was either because these data were not collected, because public agencies
           failed to make them public (despite having them indexed in their databases), the data were
           processed within indicators and not shown as raw data, or they simply published the data
           in a format that was difficult to process (e.g., PDF image documents versus CSV tables).
           Despite the potential of hospital information systems, there were still data that were not
           adequately captured within these systems.
           Moreover, the data collected in a hospital depends on the strategies and practices specific
           to that hospital or health system. This limits the generalization of "real" data, and it
           encourages working with "realistic" or plausible data that are clean of interactions with
           local variables or decisions (Gunal, 2012; Marin-Garcia et al., 2020). Besides, one can

                                                                                                                        76
A data generator for covid-19 patients’ care requirements inside hospitals
Marin-Garcia, J.A.; Ruiz, A.; Maheu, J. and Garcia-Sabater, J.P.
parameterize the model and define the data structure that would be necessary to run the
model without delaying till the real data become available. Conversely, plausible data sets
can be generated from publicly available information and, later, when real data become
available, the accuracy of the model can be evaluated (Garcia-Sabater and Maheut, 2021).
This work opens lines of future research, both theoretical and practical. From a theoretical
point of view, it would be interesting to develop machine learning tools that, by analyzing
specific data samples in real hospitals, can identify the parameters necessary for the
automatic prototyping of generators adapted to each hospital. Regarding the lines of
research applied, it is evident that the formalism proposed for the generation of sound
patients is not limited to patients affected by SARS-CoV-2 infection. The generation of
heterogeneous patients can represent the needs of a specific population and serve as a
basis for studying complex health service delivery systems.
Keywords: data paper; simulated data set; covid-19; hospital; bed management;
healthcare; operations management
Introduction
From the beginning of the health crisis associated with COVID-19, each healthcare system had to deal
with fluctuating healthcare requirements, facing pandemic waves of varying amplitude and duration,
conditioned in part by the application of healthcare restrictions and protocols. From the beginning of the
crisis, many scientists worked on designing solutions to mitigate the effects of COVID-19. These ranged
from the development of vaccines to tools for forecasting infections and the impact of political mitigation
measures using advanced artificial intelligence techniques. However, the management of hospitals and
their resources did not seem to receive as much attention (Epstein & Dexter, 2020). Each country, each
region, and even each hospital came to manage its critical resources (beds and healthcare personnel)
locally, without the existence of coordination mechanisms and tools to anticipate and mitigate the
consequences of the waves, which were usually produced by the aggregation of local infection clusters.
Hospital bed management is a concrete application of a generic problem of capacity management
(Claudio et al., 2021; Garcia-Sabater et al., 2020; Lagarda-Leyva & Ruiz, 2019; Marin-Garcia et al.,
2019; Nino et al., 2021; Xia & Sun, 2013). For this purpose, it is possible to use operations management
tools, and more specifically design, planning, and control or process-improvement tools. In this sense,
discrete event-based simulation is a tool to support hospital management decision making (Gunal, 2012;
Marin-Garcia, Garcia-Sabater, et al., 2020). With a process simulator, it is possible to facilitate adequate
planning of healthcare resources and to anticipate, or at least to mitigate, situations in which some health
centers cannot attend patients due to saturation or system collapse while other centers have idle resources
(Romeo Casabona & Urruela Mora, 2020). It can also be used to empirically determine occupancy
thresholds before diverting patients between hospitals and thus avoid transferring patients in more
advanced disease stages and, therefore, requiring a much more complicated, risky, and costly transfer.
WPOM, Vol 12 Nº1 (76-115) 77A data generator for covid-19 patients’ care requirements inside hospitals
Marin-Garcia, J.A.; Ruiz, A.; Maheu, J. and Garcia-Sabater, J.P.
Note this approach to the bed management problem does not attempt to predict whether a particular person
will recover, progress to a more serious condition, or die, nor does it predict the exact number of days a
particular patient will be in each stage. The objective is to model the care required and the associated
processes within the hospital for COVID-19 patients in order to predict with sufficient reliability the overall
daily occupancy of hospital beds, the use of Non-Invasive Mechanical Ventilation (NIMV) equipment, the
occupancy of beds in Intensive Care Units (ICU), the need for medical staff, and the need for patient referral
within the chosen study area. In this sense, the prediction consists of estimating probabilities for different
occupancy rates on certain days in the future or whether, given a current occupancy and taking into account
the rate of COVID-19 admissions into the hospital, when there will no longer be free beds available in
hospitalization or ICU requiring patient referrals or enabling more capacity in the COVID-19 patient circuit.
One of the problems to be solved is the modeling of statistical distributions, both of the time required for
care and of the different stages COVID-19 patients may go through, which requires a significant volume
of data (Gunal, 2012). Contrary to expectations and in spite of the European and national transparency laws
(BOE-A-2013-12887, 2013; Parlamento Europeo y del Consejo de la Unión Europea, 2019), actual data
related to the COVID-19 pandemic, at least in Spain, took a long time to be updated and made available
(usually a week or ten days). In addition, some data relevant for working with hospital bed management
models were not publicly accessible. This occurred for various reasons including that these data were not
collected, public agencies did not offer the data (despite having them indexed in their internal databases),
public agencies offered the data processed into indicators and did not show the raw data, or they simply
published the data in a format that was difficult to reuse (e.g., PDF image documents versus CSV tables).
On the other hand, despite the fact that hospital information systems were quite powerful, there were still
data that were not adequately collected within these systems. These were data that were not recorded in
the process of admission or during the treatment of patients or, if they were recorded, they were recorded
in fields or in a non-standardized format. This forced manual extraction and filtering of the information,
which potentially generated errors and prevented easy access to the data.
Another problem, although not the least, lay in the existing interdependence between the data collected in
a hospital and the strategies and practices of that hospital or health system. Thus, when we looked at the
data, what we saw in effect was the result of a series of policies applied. Some of these policies were
explicit while others were implicit and, in many cases, unobservable. This effect limited the
generalizability of the "real" data and, in many cases, it was much more interesting to work with
"realistic" or plausible data that were free of interactions with local variables or decisions.
For these reasons and for the simulation of internal processes of the treatment of COVID-19 patients in
hospitals, it may be appropriate to do so with realistic rather than real data (Gunal, 2012). It would be
shortsighted to delay the creation of a model while waiting for the actual data (Garcia-Sabater & Maheut,
2021). One can parameterize the model and define the data structure that would be necessary to run the
model with real data. Conversely, plausible data sets can be generated from publicly available
information and, later, when real data become available, the accuracy of the model can be evaluated
(Garcia-Sabater & Maheut, 2021).
In order to address this situation, we proposed an algorithm for the generation of plausible data related to
the health care needs of symptomatic COVID-19 patients (those displaying severe or critical symptoms).
WPOM, Vol 12 Nº1 (76-115) 78A data generator for covid-19 patients’ care requirements inside hospitals
Marin-Garcia, J.A.; Ruiz, A.; Maheu, J. and Garcia-Sabater, J.P.
We used this algorithm to generate a data set to serve as a test bed for simulation models to be generated
in the future. In this way, we could test the effect of different decisions related to hospital bed
management (e.g., triage or patient discharge levels, referrals, capacity increase, etc.) on the trajectories
and outcomes of the patients generated. In addition, this data set facilitated checking whether, for the
generation of discrete event simulation models for hospital bed management, the data tables generated
were sufficient or whether additional variables not yet considered in the proposed data sets were
necessary.
The data set generated in this paper facilitates rapid generation of new research, reproducibility of
research, and validation of results (Marin-Garcia, 2015; Roa-Martínez et al., 2017). Thanks to the reuse of
data or the creation of new data sets by means of the script we provide it is possible to compare the
goodness of fit of different models or to draw new conclusions by re-analyzing the same data set using
alternative techniques or approaches.
Method
Data generation was conducted using RStudio (RStudio Team, 2020) and various R packages (Comtois,
2021; R Core Team, 2020; Revelle, 2021; Ruckdeschel et al., 2006; Schauberger & Walker, 2020;
Venables & Ripley, 2002; Wickham, 2007, 2011; Wu et al., 2020): MASS, summarytools, stats, psych,
plyr, dplyr, distr, ExtDist, openxlsx, and reshape2.
Ethical Statement
No private personal data were handled nor was there a need for human participants. Consequently, ethical
review and approval were not required for the study in accordance with local legislation and institutional
requirements.
Objective
The fundamental objective of the proposed method was to create a data set that represents the clinical needs
of COVID-19 patients admitted to hospitals in a geographic area over a time period consisting of two
complete pandemic waves. It considers stages possible based on medical knowledge available as of January
2021. If new treatment stages are incorporated in the future or if it is considered appropriate to eliminate any
of those included in the proposed model, the method can be modified to adjust it to the new reality.
The parameters chosen in this data paper were customized to fit the population values of the Valencia
region (Spain), which had approximately 2.5 million inhabitants, representing the evolution of the
pandemic between September 2020 and March 2021. In any case, the time horizon covered, the intensity
of the number of hospital admissions in the period, and the incidence curve (sharper or flatter) are fully
customizable to fit any other scenario.
WPOM, Vol 12 Nº1 (76-115) 79A data generator for covid-19 patients’ care requirements inside hospitals
Marin-Garcia, J.A.; Ruiz, A.; Maheu, J. and Garcia-Sabater, J.P.
Preliminary Assumptions for Data Generation
This work focused on the requirement paths of patients. Specifically, the sequence of symptom evolution
that caused a patient to require certain care needs. Therefore, the trajectories (scheduling, coordination,
interaction, and resource allocation of all the necessary care steps within a health center) were not addressed
(Alexander, 2007; Corbin & Strauss, 1988; Pinaire et al., 2017; Unroe et al., 2010), as the trajectories were
conditioned not only by the needs of the patients but also by the availability of resources.
The data generation algorithm modeled the clinical resource needs of the patient, not the resources
actually allocated to the patient after applying a particular triage policy in a hospital. To generate the
patient data, we relied on information provided by internists, intensivists, medical area directors, and
publicly available information as of the end of December 2020 as summarized below:
1. There was no treatment that could change the course of the stages that a patient went through
(Plaza, 2021). That is, there was only one specific treatment for COVID-19, providing oxygen,
which was supplied to patients who needed it. Oxygen can be supplied in three degrees of
intensity including oxygenation (mask in a normal hospital bed), non-invasive forced ventilation
(NIMV), and invasive forced ventilation (IMV) (Daniel et al., 2021; European center for disease
prevention and control, 2020; Fowler et al., 2020; Manninen, 2020; Marin-Garcia, Garcia-
Sabater, et al., 2020; Winck & Scala, 2021)
2. Exposure to the virus did not always guarantee infection. However, once infected (exposed to a
sufficient dose to develop the disease), each person developed a trajectory that was
predetermined (although unknown) at the moment of infection. The trajectory of the patients was
a set of stages, in a predefined order, with variable duration times in each of them (the time may
be zero for some) (Fowler et al., 2020; Wong et al., 2020).
3. The disease had a progressive and variable speed process (although in most cases it was slow,
the evolution from one state to another usually taking several days). No patient needed to be
admitted to the ICU without first needing to be admitted to a hospital for observation (Belciug et
al., 2020; Olivieri et al., 2021; Stang et al., 2020), and should also not have been discharged
post-ICU without undergoing a period of observation in inpatient beds (Castelnuovo et al., 2020;
ECDP, 2020).
4. Each row in the model’s output file represented one patient. For the distribution of gender, age, and
comorbidity, the values of the other cells of the patient row were not taken into account (in future
versions the model can be improved by representing the relationship between the variables).
If any of these assumptions are found to be incorrect in any given context, parameters or constraints can
be added in the future to more adequately represent a particular situation.
Patient Care Requirements
Figure 1 shows schematically the evolution of patient symptoms and the type of care required at each
point (Daniel et al., 2021; Fowler et al., 2020; Winck & Scala, 2021). Of those infected with SARS-CoV-
2, a small percentage will develop severe or critical COVID-19 symptoms. Ideally, these individuals will
require specific medical observation, usually with admission to a hospital for care and follow-up. The
standard provision of all hospital beds in the Spanish public health system allowed for oxygen therapy
without forced ventilation if necessary. A portion of the patients will improve after a few days and will be
able to complete their recovery at home when their symptoms are moderate or mild (R1). However,
WPOM, Vol 12 Nº1 (76-115) 80A data generator for covid-19 patients’ care requirements inside hospitals
Marin-Garcia, J.A.; Ruiz, A.; Maheu, J. and Garcia-Sabater, J.P.
others will worsen and require NIMV (Brochard, 2003; Popat & Jones, 2012; Ruza, 2008; Wiersema,
2007) which could be applied in normal rooms that have undergone a small low-cost adaptation. These
adaptations would relieve the pressure on ICU beds as the patients do not yet require the special
conditions of an ICU. After a period of treatment with forced ventilation, a portion of the patients will
improve and will be able to return to a normal hospital bed where they will continue their recovery before
being discharged to home care (R2). The remainder will have more severe symptoms and will require
IMV (Brochard, 2003; Buckley & Gillham, 2007; Popat & Jones, 2012; Ruza, 2008), which can only be
administered in the ICU or assimilated beds (e.g., pediatric ICU, operating rooms, emergency ICUs).
Patients who recover after the ICU stay will move to a hospital bed (post-ICU) to complete recovery
before being discharged home (R3). The remainder will die (R4).
Figure 1. Patient requirements process flow
no
Mild or No special
Symptoms? Recovered? yes
moderate needs
Infected Recovered
R0
R1, R2, Severe or Yes
R3, R4 critical Discharge
R1, R2,
R3, R4
Hospital Invasive
Mechanical
observation & Recovered? no mechanical
ventilation
Oxigen ventilation
R2, R3,
R4
R3, R4 R4
Recovered? no Recovered? no
Exitus
R2
yes R3
yes
Table 1 shows the breakdown of the flow diagram in Figure 1 into the different care requirement paths
considered in this work. The generator focuses on patients requiring hospitalization classed as severe and
critical (Fowler et al., 2020), i.e., paths R1, R2, R3, and R4. In each requirement path there may be
different "patient families" if the duration of resource use is different according to some set of identifiable
variables. If not, there will simply be a dispersion in the requirement path data that cannot be
explained/grouped by families. In this paper we considered patient families grouped by age ranges.
Table 1. Patien care requirements paths
Estates Requirement path Observation & Mechanical Invasive Observation Recovered
non forced ventilation mechanical
ventilation ventilation
Mild or moderate R0 0 0 0 0 1
Severe-critical R1 1 0 0 0 1
R2 1 1 0 1 1
R3 1 1 1 1 1
R4 1 1 1 0 0
WPOM, Vol 12 Nº1 (76-115) 81A data generator for covid-19 patients’ care requirements inside hospitals
Marin-Garcia, J.A.; Ruiz, A.; Maheu, J. and Garcia-Sabater, J.P.
Procedure
We used official figures from the Spanish National Center of Epidemiology (CNE) (CNE -Centro Nacional
de Epidemiología, 2020) for total cases, hospitalized patients, ICU patients, and deaths by day, province, age
group, and gender between January 1, 2020 and March 24, 2021. This process was imperfect, e.g., the data
set with cases took time to be updated, there were possible minor inconsistencies between regional
protocols, and the CNE data only gave totals for groups over time forcing the use of different sources to
make assumptions about the time between steps in requirement paths. Finally, the CNE data did not include
complete information about comorbidity, so we made assumptions based on other sources.
The process of data generation is carried out in four steps (Figure 2).
Figure 2. Four steps for data generation
4
1 3
2 Day of severe Or
Sociodemographic Sequence of
Comorbidity critical symptoms
variables symptoms
appearance
Step 1
In Step 1, the sociodemographic variables are created. Our simulation was only based on severe or
critically ill patients requiring hospitalization. The gender and age distributions of these patients may
differ from those of the general population in Valencia province (Generalitat Valenciana. Conselleria de
Sanitat Universal i Salut Pública, 2019; Generalitat Valenciana, 2018). The number of hospitalized men
was 1.2 times the number of hospitalized women (men, 54.5%; women, 45.4%) (CNE -Centro Nacional
de Epidemiología, 2020). For age, we worked with the age ranges used by the CNE, specifically, 0.4% of
cases under 10 years of age, 0.6% between 10 and 19 years, 2.4% between 20 and 29 years, 4.6%
between 30 and 39 years, 10.4% between 40 and 49 years, 15.3% between 50 and 59 years, 18.0%
between 60 and 69 years, 20.2% between 70 and 79 years, and the remainder 80 years and above. (CNE -
Centro Nacional de Epidemiología - https://cnecovid.isciii.es/).
Step 2
In Step 2, comorbidity is randomly distributed among the generated sample to respect an incidence similar
to that of the COVID-19 patient sample. (CNE -Centro Nacional de Epidemiología, 2020). Data for Spain
were available only up to Report 32 dated May 21, 2020, after which these data were not reported. Nor were
we able to locate information on the simultaneous prevalence of comorbidities or the relationships of these
with gender and age in the general population (Posso et al., 2020). For this reason, they were randomly
distributed to maintain a proportion of cases where the prevalence was 28.5% of heart conditions such as
heart failure, coronary artery disease, or cardiomyopathies; 11.6% of chronic obstructive pulmonary disease;
17.7% of type 2 diabetes mellitus; 12.9% of hypertension; 2.6% of chronic kidney disease; and 3.3% of
cancer. The CNE did not provide data on other risk factors (e.g., 16.9% of obesity (BMI > 30 kg/m2), 23.0%
of smoking), so they were extracted from other sources (Ministerio De Sanidad, Servicios Sociales e
Igualdad, 2017). In this study we did not include pregnancy as a risk factor (no comorbidity). In the future
WPOM, Vol 12 Nº1 (76-115) 82A data generator for covid-19 patients’ care requirements inside hospitals
Marin-Garcia, J.A.; Ruiz, A.; Maheu, J. and Garcia-Sabater, J.P.
this variable can be included by assigning cases only to women in the fertile age range. In future research,
we can also improve the generation of cases by taking into account the incidence of comorbidity according
to sociodemographic variables and the simultaneous presence of several comorbidities (Zheng et al., 2020).
In addition, the values can be adapted to other populations by incorporating information from other sources
such as https://www.cdc.gov/coronavirus/2019-ncov/need-extra-precautions/evidence-table.html.
Step 3
In Step 3, each patient is assigned a trajectory according to the risks derived from their demographic and
comorbidity variables. Despite having formally requested them from various organizations, it was not
possible to obtain public data allowing us to establish the percentage of patients in each trajectory by age
range. Therefore, we estimated these percentages from the only readily available data source (CNE -
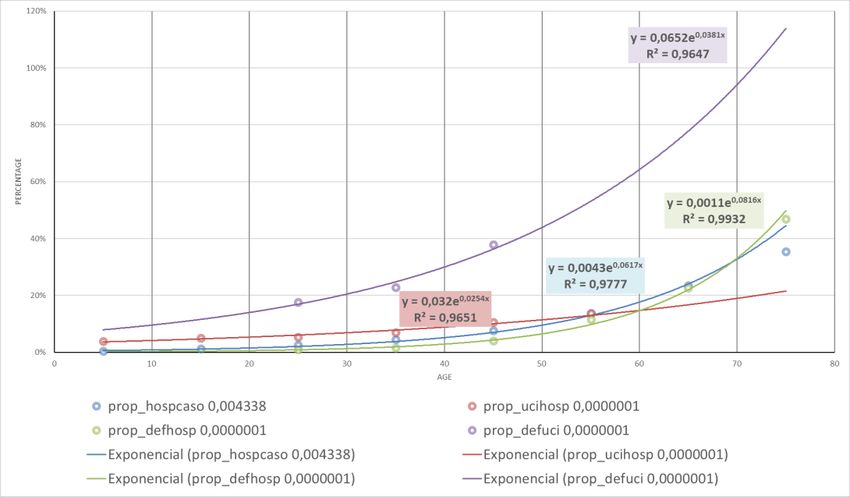
Centro Nacional de Epidemiología - https://cnecovid.isciii.es/ ). We used data from across Spain (Figure
4 and Table 2). We did not use data exclusively from Valencia province (Figure 3) because there were
few cases of patients under 30 years of age thus rendering the parameter estimates unreliable. The CNE
data did not adequately represent the trajectories of people over 60 years of age. It may misleadingly
appear that the incidence of Severe Acute Respiratory Syndrome (SARS) decreases after this age.
However, the reality was the opposite, this incidence grew exponentially, but the application of medical
care protocols meant most elderly patients did not receive ICU treatment even if they were in need of
IVM. The reason was the probability of surviving such an aggressive intervention was low (practically
zero in the most elderly patients).
Figure 3. Evolution of variables in Valencia province
WPOM, Vol 12 Nº1 (76-115) 83A data generator for covid-19 patients’ care requirements inside hospitals
Marin-Garcia, J.A.; Ruiz, A.; Maheu, J. and Garcia-Sabater, J.P.
Figure 4 Evolution of variables in Spain
Table 2 Estimated ICU patients based in Spanish figures
B C D E F G H I J K L
Age Infected Hopitaliced ICU Exitus Hosp per ICU per Exit per Exit per ICU Estimated ICU Estimated
Range infected Hospitalized Hospitalized per Exitus per ICU
Hospitalized
5 202429 1351 66 6 0,006674 0,048853 0,004441 0,090909 0,04272363 0,08527159
15 324036 1624 102 11 0,005012 0,062808 0,006773 0,107843 0,05233955 0,11731251
25 357745 4759 228 48 0,013303 0,047909 0,010086 0,210526 0,06411974 0,16139284
35 378003 9498 640 116 0,025127 0,067383 0,012213 0,18125 0,07855133 0,22203641
45 468477 18976 1682 422 0,040506 0,088638 0,022239 0,250892 0,09623107 0,30546689
55 413136 29652 3776 1549 0,071773 0,127344 0,052239 0,410222 0,11789003 0,42024648
65 263693 35876 5944 4108 0,136052 0,165682 0,114506 0,691117 0,14442384 0,57815464
75 168258 39438 5280 9141 0,23439 Not available 0,231782 Not 0,17692966 0,79539702
available
85 172818 58510 1038 28635 0,338564 Not available 0,489404 Not 0,21675166 0,90(1)
available
(1) Value imputed manually since the estimate shows a value outside the possible range =0,0386* =0,0727*
EXP(0,0203* EXP(0,0319*
AgeRange) AgeRange)
In order to establish the parameters of the percentage of people on the R3 and R4 paths, the curve of
points corresponding to the proportion of ICU patients per number hospitalized and the percentage who
died (exitus) per number of ICU patients were fitted with an exponential (Figure 4 and Table 2). These
calculated values (Columns K and L in Table 2) were subtracted from the flow of hospitalized patients to
calculate the weight of each of the paths representing the evolution of symptoms.
WPOM, Vol 12 Nº1 (76-115) 84A data generator for covid-19 patients’ care requirements inside hospitals
Marin-Garcia, J.A.; Ruiz, A.; Maheu, J. and Garcia-Sabater, J.P.
Taking into account the previous assumption number three, path R4 will have a prevalence equal to the
proportion of deceased persons in relation to the total number of hospitalized persons. These patients will
have required mechanical ventilation (whether or not it was administered).
The set of patients on paths R2 and R3 is comprised of those who required mechanical ventilation. This
figure could be estimated from the persons who required admission to the ICU (in Spain there were few
hospitals that offered NIMV in the first 10 to 12 months of the epidemic). However, Table 2 clearly
shows the trend in ICU admissions stagnated and decreased from the age range of 65 years onwards,
while the number of patients who died (exitus) grew exponentially. This trend indicated, after a certain
age, ICU treatment was not offered to all patients requiring mechanical ventilation. The reason, taking
into account the data in the column "estimated exitus per ICU", perhaps was to apply a policy that
considered the chances of surviving an aggressive IMV intervention were limited beyond a certain age.
We made the adjustments shown in Table 3 as an attempt to estimate the number of patients dying outside
the ICU who would have required admission. To do this, we estimated the number of patients dying in the
ICU by multiplying the estimated value of "exitus per ICU" by the value of patients admitted to ICU
(Column N). In Column O, we calculated the difference between exitus and the Column N value. In
Column P we estimated the number of patients who must have actually needed mechanical ventilation
(either invasive or non-invasive). The set of patients on paths R2 and R3 together will equal the value in
Column P minus the patients who die (which will be path R4). This value was converted to a proportion
of hospitalized patients in each age range (in Column R).
In order to differentiate how many of these patients were on path R2 and how many were on path R3,
several hospitals were consulted. However, we were unable to obtain an estimate of these values (only
ICU admissions, i.e., those requiring IMV, were available). Therefore, we assumed 50.0% of the patients
requiring IMV were patients on path R2 and the other 50.0% were patients on path R3. This assignment
was effectively arbitrary and should be informed in the future by real data (or directly eliminate path R2
by assigning 0.0% of cases when there are no NIMV-adapted facilities suitable for the care treatment of
this path).
The percentage of patients on path R1 is calculated by subtracting the rest of the paths from 100.0%.
Table 3. Estimating proportion parameters for patients in each path by age
M N O P Q R S T U v
Age Estimated exitus on Exitus R2_R3 Prop R2_R3 %R1 %R2 %R3 %R4
Estimated
range ICU outside ICU per
number of
hospitalized
patients that
require
Mechanical
ventilation
5 6 66 60 0,04441 0,951 0,022 0,022 0,004
15 12 102 91 0,05603 0,937 0,028 0,028 0,007
25 37 228 180 0,03782 0,952 0,019 0,019 0,010
35 143 640 524 0,05517 0,933 0,028 0,028 0,012
45 514 1682 1260 0,06640 0,911 0,033 0,033 0,022
WPOM, Vol 12 Nº1 (76-115) 85A data generator for covid-19 patients’ care requirements inside hospitals
Marin-Garcia, J.A.; Ruiz, A.; Maheu, J. and Garcia-Sabater, J.P.
55 1587 3776 2227 0,07510 0,873 0,038 0,038 0,052
65 3437 671 6615 2507 0,06988 0,816 0,035 0,035 0,115
75 4200 4941 10221 1080 0,02738 0,741 0,014 0,014 0,232
85 935 27700 28738 103 0,00176 0,509 0,001 0,001 0,489
=REDONDEAR.MAS =Exitus- =ICU+Exitus =Estimated =R2_R3/ =100%- 50%*Prop 50%*Prop =Exit per
(Estimated Exitus Estimated outside ICU required Hospitalized Sum(%R2; R2_R3 per R2_R3 per hospitalized
per ICU*ICU;0) exitus on Mechanical %R3; %R4) hospitalized hospitalized
ICU ventilation -
Exitus
The values in Columns S, T, U and V in Table 3 add up to 100%. They can be used for a simple
requirement path allocation model, where only the probabilities derived from the patient age range are
taken into account. In this case, patients are simply allocated randomly, according to the probabilities of
the row corresponding to the age range and path.
Advanced model including comorbidity, pregnancy, and gender
It was also possible to develop a model that allowed us to make a path assignment that included, in
addition to age, other risk factors such as gender, pregnancy, and comorbidities. In this case, we needed to
work with odds ratios to generate an individualized risk coefficient for each subject represented by a row
in the data set and that this coefficient represented all risk factors.
The odds ratio (OR) (Table 4) is the quotient of the division between the number of times something
happens compared to when it does not happen when a variable is present, and the same division when the
variable is not present (Dominguez-Lara, 2018; Marin-Garcia, Bonavia, et al., 2020). If the OR equals 1 it
means that there is no relationship between the event and the variable because the probability of the event
occurring is the same when the variable is present and when it is not.
Table 4. Odds ratio calculation
Case (it happens) No case (it does not happen)
Variable Present a b
Variable Absent c d
OR=(a/b) / (c/d)
As a reference category, we consider the following: female, age range 5 years, no pregnancy, and no
presence of comorbidities. Any other combination of variables in the row results in an OR with respect to
the reference category that will be calculated as the multiplication of the ORs of the variables that differ
from the definition of the reference category (Hair et al., 2009). Figure 5 displays a schematic of this
process. Thus, for example, if one row of our data set represents a 55-year-old male, diabetic, and a
smoker, the aggregate OR equals the multiplication of ORmen*OR55years*ORDiabetes*ORSmoking.
WPOM, Vol 12 Nº1 (76-115) 86A data generator for covid-19 patients’ care requirements inside hospitals
Marin-Garcia, J.A.; Ruiz, A.; Maheu, J. and Garcia-Sabater, J.P.
Figure 5. Odds aggregation
i from 1 to num rows ; j form 1 to num of risk factors
ORi=EXP (b1.x1+....+bn.xn)= EXP(b1.x1).... EXP(bn.xn)
when xj is 0 (reference category for risk factor j) -->EXP(0)=1
The OR can be transformed into a probability by means of the formula probability = OR/(OR+1) (Hair et
al., 2009).
We extracted OR data related to COVID-19 severity from various sources (Posso et al., 2020; Verity et
al., 2020; Zheng et al., 2020). Figure 6 shows the results of the work of Posso et al. (2020). With the CNE
data from the second and third waves in Valencia province, the ORs due to being male compared to being
female, assuming it was constant for all age ranges, were 1.85 (10.2% ICU hospitalization for men vs.
5.6% for women). In future research, each RO can be analyzed separately for different age ranges,
assuming data are available.
Figure 6. Adjusted Odds Ratios by comorbidity (Posso et al , 2020)
As we were unable to locate any work that estimated ORs by age range, we calculated them from the data
provided by CNE for Spain (from September 1, 2020 to March 24, 2021). Columns a) and b) of Table 5
came from Column P of Table 3, Column D of Table 3, and Column D of Table 2. The ORs (by age) are
the quotient between a/b of each range and a/b of the reference category (5 years).
Table 5. Odds ratio by age range (reference category = 5 years)
a) Estimated number of
patients that require b) Num hospitalized
Age range a/b OR by age
Mechanical ventilation patients R1 (no case)
(case)
5 (reference category) 66 1285 0,05136187 1
15 102 1522 0,06701708 1,30480229
25 228 4531 0,05032002 0,9797155
35 640 8858 0,07225107 1,40670649
45 1682 17294 0,09725917 1,89360647
55 3776 25876 0,14592673 2,84114916
65 6615 29261 0,22606883 4,40149159
75 10221 29217 0,34983058 6,81109535
85 28738 29772 0,96526938 18,7935023
Reference category (age range >5 absent) c/d=66/1285= 0,05136187
WPOM, Vol 12 Nº1 (76-115) 87A data generator for covid-19 patients’ care requirements inside hospitals
Marin-Garcia, J.A.; Ruiz, A.; Maheu, J. and Garcia-Sabater, J.P.
The following two path assignment options are proposed for the advanced model:
Advanced Model Option A
In Option A, the paths are assigned taking into account the percentile which represents the value of the
aggregate OR of each row with respect to the total sample generated. Higher ORs imply a higher
probability of generating worse symptoms. We achieve this by assigning Path 1 when the percentile is
less than or equal to the proportion of patients in R1. We assign Path 2 if the percentile is greater than the
proportion of patients in R1 and less than or equal to the sum of the proportions of R1 and R2. We assign
Path 3 if the percentile is greater than the sum of proportions of R1 and R2, but less than or equal to the
sum of proportions R1, R2 and R3. We assign Path 4 in all other cases.
The proportions of patients in each path (R1, R2, R3, or R4) are calculated as an average weighted by the
number of patients in each age range from the values in columns S, T, U, and V of Table 3.
Note the ORs in Table 5 were not adjusted for the presence of comorbidities, which tend to become more
frequent with advancing age. Therefore, it is possible the data generated with this model may be
implausible, showing a disproportionate presence of elderly cases in the R4 path. To address this
problem, we propose option B.
Advanced Model Option B
In Option B, we start from the same ORs as in Option A. However, the percentile representing the OR of
each row is calculated only by comparison with other cases within the same age range (not the entire
generated sample). The assignment of paths will also be made within each age range based on that
percentile and the case proportions of Columns S, T, U, and V of Table 3.
Step 4
In Step 4, each patient is assigned the date of the onset of severe and critical symptoms (thus, the patient
needs to be admitted a hospital for observation or to another care unit). For this purpose, a distribution of
the number of new severe cases per day is used as a starting point. This distribution can be generated
from actual data. For example, in the supplementary material documents attached
(https://zenodo.org/record/4699554), the number of cases generating severe symptoms in our data set
tracked the daily proportion of real patients who required hospital admission in Valencia province (Spain)
between September 1, 2020 and March 24, 2021.
However, other starting data sets can be used. These can be real data from other geographical areas and/or
time windows. Alternately, they can be simulated data from different scenarios where a sequence of one
or more waves with different intensities (peak of patients with severe symptoms on a given day) and
amplitude (number of days from the start of the wave until it is considered to be eradicated) is modeled.
For the rows coinciding with each age range category and for each requirement path, the number of days
the patient will have symptoms requiring observation and oxygen (DaysObs), the number of days
requiring NIMV (DaysNIMV), the number of days requiring IMV (DaysIMV), and the number of days
under observation after having undergone NIMV or IMV (DaysPstIMV) are generated. For this purpose,
Poisson distributions with a lambda parameter equal to the expected average number of days with
WPOM, Vol 12 Nº1 (76-115) 88A data generator for covid-19 patients’ care requirements inside hospitals
Marin-Garcia, J.A.; Ruiz, A.; Maheu, J. and Garcia-Sabater, J.P.
symptoms for that age range and path (Petermann-Rocha et al., 2020) are used. Taking into account the
duration of symptoms requiring a given treatment was shorter for people who died than for those who
recovered, the patients in each path were parameterized differently. This added complexity due to the lack
of real data broken down by path (Casas-Rojo et al., 2020; Guan et al., 2020; Huang et al., 2020; Rubio-
Rivas et al., 2020; Wang et al., 2020; Xu et al., 2020). We used as parameters the mean values collected
by a large Spanish hospital broken down by age range and final outcome (recovered or exitus). It was not
yet possible to have disaggregated and different data for all the paths (so some parameters were repeated).
This may cause the simulated data to have a slight deviation with respect to the evolution of the disease in
real patients.
A Poisson distribution was assumed as we knew only one parameter (mean). In the case of having more
information to estimate scale and shape, future research could investigate the viability of a Weibull
distribution instead. (Celeux et al., 2006; Epstein & Dexter, 2020; Mun, 2008).
It was assumed the duration in days of each symptom was a memoryless process. Thus, each duration was
independent of the duration of the other disease states.
Guidelines for Data Reuse
Each data set represents the demographics, comorbidities, dates of admission, and dates of transition to
other states (columns) for a number of patients (rows).
The generated data can be used to test whether a model or a simulator performs with at least synthetic
data. We assumed that if a model does not work with synthetic data, then it will not work with real data.
The converse is not necessarily true, i.e., a model may work with synthetic data, but fail with real data.
The algorithm generates families of data sets (replications) that share the same generation parameters, but
with changes to the randomization seed in each replication. The parameters set to run the algorithm are as
follows:
The number of replications to be generated (N).
The number of patients to be generated (rows of the data set).
Age range. Column vector with the age value representing each age range, usually the mean
value of the range.
Percentage of patients desired in each age range. Column vector with the same number of
elements as age ranges considered. The sum of its values should equal 100.0%.
Incidence of comorbidity. Percentage of patients who will have each of the considered risk
factors present.
OR of death by COVID-19 corresponding to the presence of each risk factor with respect to the
reference category (female, age range 5 years, not pregnant, and without comorbidities).
Distribution of patients by requirement paths. One column vector for each path considered. Each
vector has as many elements as age ranges considered. The sum of the elements of the same row
should be 100.0%.
WPOM, Vol 12 Nº1 (76-115) 89A data generator for covid-19 patients’ care requirements inside hospitals
Marin-Garcia, J.A.; Ruiz, A.; Maheu, J. and Garcia-Sabater, J.P.
Percentage of cases per day with respect to the total number of cases generated. Column vector
with as many elements as days contained in the time window to be generated. Real numbers of
cases per day can be entered (the generator converts them into percentages), or the percentages
can be entered directly. You can set a constant input each day or the data can be adjusted to the
desired input curve (varying peaks, amplitude, and waves).
The average duration values for each symptom, for each age range, and for each path. A column
vector for each combination of paths and care requirements. In the example shown, with 4 paths
(R1 to R4) and 4 requirements (Observation, NIMV, IMV, Observation post mechanical
ventilation), 16 vectors are needed. Each vector has as many elements as age ranges considered.
Paths where certain symptoms do not occur will have a duration of zero in all elements of their
vector. If values disaggregated by age and/or path are not available, the same average duration
value can be input for all elements.
One data set (or partial data set) can be used to calibrate a model. Subsequently, the calibrated model can
be validated using the other part of the data set (or other data sets from the same or different families). In
this way, the model can be checked for proper fit to a new and unused data set to refine or calibrate the
model. If real data become available later, the performance of the model in a real environment can be
evaluated.
For example, a family can be generated with N = 30 data sets, each with 1500 rows. You can build a
model using the first 1000 rows of this data set and then test with the remaining 500 rows. Alternately,
you can build a model with the complete data set and test it with the 29 family data sets or with data sets
from other families.
You can create as many data set families as you want so there are variations in requirement duration times
(e.g., testing scenarios where they are totally random, they follow a statistical distribution, or they are a
function of comorbidities or other data set parameters).
The data generated were based on patient needs paths. Depending on available resources or other health
policies, patients may or may not receive the resource they need and this has clear consequences on the
outcome. For example, if an 85-year-old patient has acute respiratory distress syndrome (ARDS), they
would need mechanical ventilation to survive, and that is what our data generator will identify.
Additionally, this patient may be dispensed with this indicated treatment, or it may be decided that it is
not worthwhile and they will be transferred to palliative care. For this reason, the data generated by our
algorithm does not necessarily match the real data of patients admitted to ICU (not all patients who need
mechanical ventilation actually receive it).
Data Set Description
The ZIP archive provided as supplementary material (Figure 7) contains the R code in a notebook (RMD
file extension) and its HTML version. In addition, the archive includes the XLSX files for two
replications generated with the same parameters. Each replication consists of three data sets, one for the
data generated with the basic model, another with the advanced model Option A, and the third with the
WPOM, Vol 12 Nº1 (76-115) 90A data generator for covid-19 patients’ care requirements inside hospitals
Marin-Garcia, J.A.; Ruiz, A.; Maheu, J. and Garcia-Sabater, J.P.
advanced model Option B. Thus, in each replication three data sets were generated (data set1bas, data
set2advA and data set3advB). The data sets of each replication share parameters and randomization seeds,
but assign the paths differently. Model 1 does not take into account comorbidity parameters or gender and
assigns the path only according to age range so the number of cases resembles the proportion of patients
in each path stipulated by the parameters. Model 2 is based on the combined risk of comorbidity, gender,
and age and assigns paths based on those alone (ignoring the parameter specification of how many
patients of each age range are desired in each path). Model 3 assigns paths taking into account the ORs of
all risk factors (comorbidity, gender, and age range), but sorts by age before allocating paths based on
risk. In this way, Model 3 also respects the specifications of the distribution parameter of patients per path
according to age range.
The most appropriate model depends on the richness and reliability of the data entered as parameters. If
there is little information available on the incidence and/or the OR of the risk factors, but the incidence by
age range is plotted, then Model 1 would likely produce the results closest to reality. If incidence
information by age range is unavailable, but risk factor ORs are reliable, then Model 2 would likely be the
most appropriate version. When complete data are available, Model 3 is likely a better representation of
reality.
Each replication (rep) is labeled by the number preceding the file extension. Each generation model is
labeled with a number following the word "Data set" (1 for basic, 2 for Option A and 3 for Option B).
The algorithm version is labeled with the number following the "V". The most current version is version 3.
Figure 7. Files included in supplementary material
The notebook file is structured in three sections including declaration of the required libraries, definition
of the parameters (Figure 8), and the data generation algorithm based on the parameters (Figure 9).
WPOM, Vol 12 Nº1 (76-115) 91A data generator for covid-19 patients’ care requirements inside hospitals
Marin-Garcia, J.A.; Ruiz, A.; Maheu, J. and Garcia-Sabater, J.P.
Figure 8. Code Example for Parameter Specification
WPOM, Vol 12 Nº1 (76-115) 92A data generator for covid-19 patients’ care requirements inside hospitals
Marin-Garcia, J.A.; Ruiz, A.; Maheu, J. and Garcia-Sabater, J.P.
Figure 9. Code Example for Data Set Generation Algorithm
Figure 10 shows the column headings and the first rows of the first of the generated data sets (replication
1, basic model). The description of each of the column variables is presented in Table 6. Each data set
was generated with the rows sorted by date of occurrence of severe symptoms.
Figure 10. First rows of file covid-19simulated-1617990046-Dataset1-v3-1.xlsx
For the purpose of simplicity, we assume all patients cross all requirements (observation, NIMV, IMV,
observation post Mechanical Ventilation and discharge) but the duration of unnecessary requirements is
effectively zero, i.e., the day showing one requirement equals the day for the next requirement. In this
way, when we make calculations using date columns, all the rows have a day in each column. Even if a
WPOM, Vol 12 Nº1 (76-115) 93A data generator for covid-19 patients’ care requirements inside hospitals
Marin-Garcia, J.A.; Ruiz, A.; Maheu, J. and Garcia-Sabater, J.P.
patient does not present IMV needs or post-IMV needs (in those cases the date of discharge is the same as
the day of IMV needs or of post-IMV needs making the length of stay in those processes equal to zero).
The same is true for exitus patients where the post-IMV needs day is the same as the discharge day.
Table 6. Data description
Description Values
Column name
Sequential number that uniquely identifies each row of the data set 1 to number
Id of rows
Age range. Representative value of the age category to which the patient represented Integer from
belongs in each row. Each age category contains 10 years (minus the last one) and the age 5 to 85.
range value represents the average value of the category (minus the last one, which is set distanciados
AgeRange to 85). de 10 en 10
Gender of the patient in row 0=men
Gender 1=women
Hypertension 0=absent
HTA 1=present
Type 2 diabetes mellitus 0=absent
Diabetes 1=present
chronic obstructive pulmonary disease 0=absent
COPD 1=present
heart conditions, such as heart failure, coronary artery disease, or cardiomyopathies 0=absent
Cardio 1=present
chronic kidney disease 0=absent
Kidney 1=present
cancer 0=absent
Cancer 1=present
obesity (BMI> 30 kg/m2 0=absent
Obesity 1=present
pregnancy 0=absent
Pregnacy 1=present
smoking 0=absent
Smoking 1=present
Comorbidity index. Multiplication of the Odds Ratio of risk factors (age range, genre, Real number
ComorbidityIndex comorbidity and pregnancy) >0
Path requirement of the patient in row Integer 1 to 4
Path
NIMV required by patient in row (depends on path value) 0=no
NIMVneeds 1=yes
IMV required by patient in row (depends on path value) 0=no
IMVneeds 1=yes
Observation bed after NIMV or IMV required by patient in row (depends on path value) 0=no
Postneeds 1=yes
Outcome of patient in row (depends on path value) 0=exitus
RecoveredExitus 1=recovered
Calendar day when severe symptoms appear and admission in hospital was needed Date (YYYY-
SevereSymDate MM-DD)
Calendar day when critical symptoms appear and non invasive mechanical ventilation was Date (YYYY-
NIMVneedDate needed. Calculated based on days of symptoms and date of other stages in the process MM-DD)
Calendar day when needs for invasive mechanical ventilation appear. Calculated based on Date (YYYY-
IMVneedsDate days of symptoms and date of other stages in the process MM-DD)
Calendar day when patient does not need invasive mechanical ventilation and only need Date (YYYY-
observation in hospital bed. Calculated based on days of symptoms and date of other MM-DD)
PostImvNeedsDate stages in the process
Calendar day for discharge (recovered or exitus). Calculated based on days of symptoms Date (YYYY-
DateOfDischarge and date of other stages in the process MM-DD)
Number of days with severe symptoms in observation Integer >0
DaysObs
Number of days with critical symptoms that require NIMV Integer >0
DaysNIMV
Number of days with critical symptoms that require IMV Integer >0
DaysIMV
Number of days with severe symptoms in observation after MV Integer >0
DaysPostIMV
sum of all time with severe or critical symptoms (that is, the difference between Integer >0
DaysInHospital admission date and discharge date)
WPOM, Vol 12 Nº1 (76-115) 94A data generator for covid-19 patients’ care requirements inside hospitals
Marin-Garcia, J.A.; Ruiz, A.; Maheu, J. and Garcia-Sabater, J.P.
Future Lines of Research Using this Data Set
This paper opens up potential future lines of research, both theoretical and practical. From a theoretical
point of view, it would be interesting to develop machine learning tools that, by analyzing specific data
samples from real hospitals, would be able to identify the necessary parameters for the automatic
prototyping of generators adapted to each hospital. Regarding applied lines of research, clearly the
proposed formalism for the generation of plausible patients is not limited to patients affected by SARS-
CoV-2 infection. The generation of heterogeneous patients can serve to represent the needs of a specific
population and serve as a basis for studying the behavior of complex health care delivery systems.
These data sets can be useful for earlier stages of data modeling and for testing the feasibility of discrete
event models when actual data are not yet available (e.g., awaiting ethics committee acceptances, pending
collection and processing by health facilities).
Actual data provided by hospitals are often incomplete or inconsistent. Therefore, they are not necessarily
useful for optimization validation or simulation models. The framework presented can serve as a starting
point for researchers to extend or replicate the model.
As the COVID-19 information and trace systems evolve, the plausibility of these data sets could be
validated and possible predictors for paths not yet considered could be analyzed.
For those in hospital management positions, one advantage of this research is they do not have to start
from scratch. It is foreseeable that the emergence of COVID-19 variants, the effect of vaccination
campaigns, and new respiratory-assisted technologies will change the percentages of patients travelling
along each path. These changes can be easily modeled by adjusting the parameters to quickly produce a
data set that represents the new situation. In addition, our approach allows managers to identify what
information to collect, store, and process in their information systems to better support COVID-19 bed
management decisions.
Our data sets can also be used to estimate patient needs and differentiate them from data reflecting
hospital bed management policies. In this way, they can be used to analyze scenarios and assess the
effects of certain alternative policies, or to analyze the sensitivity of bed management decisions to
deviations from baseline parameters.
Additionally, during the parameterization phase of the generator process, it has to be supplied with data
that may not be available and are perhaps appropriate for future research, e.g., the effect of comorbidities
adjusted for gender and age, or the incidence of simultaneous comorbidities.
It would also be interesting to verify to what extent and under what circumstances each of the data
generation models provides more plausible results.
Similarly, the model could be extended by incorporating more trajectories or more stages of the process
(e.g., from mild or asymptomatic infections and home care requirements).
Another line of future research might be concerned with identifying parameter values to feed into the
models. For example, studying the incidence of comorbidities in certain populations or the incidence of
several comorbidities simultaneously in the same person. Another interesting improvement would be the
estimation of ORs with respect to the reference category, of needing NIMV, IMV, or death adjusted for
WPOM, Vol 12 Nº1 (76-115) 95A data generator for covid-19 patients’ care requirements inside hospitals
Marin-Garcia, J.A.; Ruiz, A.; Maheu, J. and Garcia-Sabater, J.P.
gender, age, and other comorbidities. It is likely the ORs are dependent on each other. That is, the risk of
suffering certain comorbidities is associated with age or gender. The data available to date are not usually
adjusted for other potentially confounding variables.
On the other hand, this data set can be used to check the effect of various hospital management decisions
that contribute to improving the experience of the patient or healthcare staff. For example, better
estimates of bed occupancy can help improve decision efficiency in ancillary services such as laundry,
warehouses, kitchens; improve the warehouse management or purchases of sanitary supplies or protective
equipment; or improve the efficiency of allocating health workers shifts.
Finally, this generator could be adapted to other diseases besides COVID-19 which lead to a high
consumption of health care resources, where their trajectories are well studied and their parameters can be
easily obtained.
Access to the data set
The data sets, called “COVID19simulated-#######-Dataset#-v3-#.xlsx” in file
MarinEtAl(2021)COVID19simulated-DOI10.4995wpom.15332.zip, are deposited in
https://zenodo.org/record/4699554
Other useful information related to covid-19
https://www.mscbs.gob.es/profesionales/saludPublica/ccayes/alertasActual/nCov/situacionActual.ht
m . The disadvantage of this page is that it only provides recent data. It does not offer historical
downloads that could be used to analyze trends
Situación de COVID-19 en España
Actualización nº331: enfermedad por SARS-CoV-2 (COVID-19) 12.03.2021
Informe de indicadores principales de seguimiento de COVID-19 (actualización semanal) 11.03.2021
http://coronavirus.san.gva.es/es/estadisticas
https://dadesobertes.gva.es/va/dataset?tags=COVID-19
https://cnecovid.isciii.es/covid19/#documentaci%C3%B3n-y-datos
casos_hosp_uci_def_sexo_edad_provres.csv
Note many of these information sources provide data in formats of low usability.
Author contributions
All authors listed have made a substantial, direct and intellectual contribution to the work and approved it
for publication.
WPOM, Vol 12 Nº1 (76-115) 96You can also read