A deep learning approach to identify unhealthy advertisements in street view images
←
→
Page content transcription
If your browser does not render page correctly, please read the page content below
www.nature.com/scientificreports
OPEN A deep learning approach
to identify unhealthy
advertisements in street view
images
Gregory Palmer1,4,5, Mark Green1,5*, Emma Boyland2, Yales Stefano Rios Vasconcelos3,
Rahul Savani3 & Alex Singleton1
While outdoor advertisements are common features within towns and cities, they may reinforce social
inequalities in health. Vulnerable populations in deprived areas may have greater exposure to fast
food, gambling and alcohol advertisements, which may encourage their consumption. Understanding
who is exposed and evaluating potential policy restrictions requires a substantial manual data
collection effort. To address this problem we develop a deep learning workflow to automatically
extract and classify unhealthy advertisements from street-level images. We introduce the Liverpool
360◦ Street View (LIV360SV) dataset for evaluating our workflow. The dataset contains 25,349, 360
degree, street-level images collected via cycling with a GoPro Fusion camera, recorded Jan 14th–18th
2020. 10,106 advertisements were identified and classified as food (1335), alcohol (217), gambling
(149) and other (8405). We find evidence of social inequalities with a larger proportion of food
advertisements located within deprived areas and those frequented by students. Our project presents
a novel implementation for the incidental classification of street view images for identifying unhealthy
advertisements, providing a means through which to identify areas that can benefit from tougher
advertisement restriction policies for tackling social inequalities.
The literature on advertising has previously shown that certain social demographics experience greater exposure
to unhealthy products via a variety of advertisement platforms1–5. There is increasing recognition of the role of
unhealthy product consumption in the global non-communicable disease b urden6. In recent years, some public
authorities have responded by introducing restrictions to limit exposure towards advertisements that encour-
age risky behaviour (e.g. Transport for London have banned all fast food advertisements on their networks).
Understanding the populations and areas exposed to unhealthy advertisements, monitoring if regulations are
being adhered to, and identifying areas to implement restrictions remain open problems. Collecting advertise-
ment data within urban environments requires a substantial manual effort5,7–9. As a result there are very few (if
any) existing secondary datasets geolocating advertisements. The rapid and dynamic nature of advertisements
constantly changing also limits the use of surveying landscapes (which are time and cost intensive).
The emergence of deep learning10 for improved image classification raises the possibility of automating this
task. Current state-of-the-art seamless segmentation networks11 can be trained to identify billboards using the
Mapillary Vistas Dataset for semantic understanding of street s cenes12. However, this dataset does not account
for different content categories. Furthermore, we consider that the manual annotation of advertisements within
street-level imagery is both time consuming and can lead to a dataset with a limited shelf-life. Advertisement
campaigns, company logos and product ranges are ever e volving13, rendering manual efforts obsolete. To miti-
gate this problem we present a workflow for extracting and classifying advertisements using an approach that is
flexible and allows repeated data sweeps.
The aim of our study is to develop a deep learning workflow to automatically extract and classify unhealthy
advertisements from street view images. Our contributions can be summarized as follows:
1
Geographic Data Science Lab, Department of Geography and Planning, University of Liverpool, Liverpool,
UK. 2Department of Psychology, University of Liverpool, Liverpool, UK. 3Department of Computer Science,
University of Liverpool, Liverpool, UK. 4L3S Research Center, Leibniz University Hannover, Hannover,
Germany. 5These authors contributed equally: Gregory Palmer and Mark Green. *email: mark.green@
liverpool.ac.uk
Scientific Reports | (2021) 11:4884 | https://doi.org/10.1038/s41598-021-84572-4 1
Vol.:(0123456789)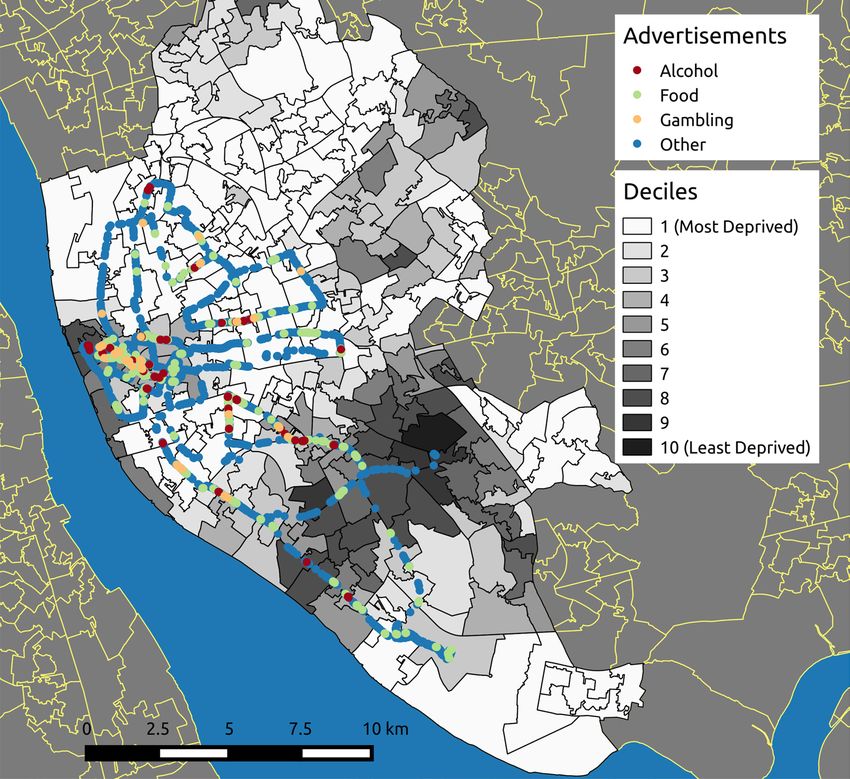
www.nature.com/scientificreports/
1. We outline a novel and open workflow for extracting and classifying advertisements from street-level images.
2. We introduce the open Liverpool 360◦ Street View (LIV360SV) dataset, consisting of 25,349 geo-tagged
street-level images for Liverpool, UK. Data will be updated longitudinally and the method can be deployed
in varying contexts/environments.
3. We compare the clustering of extracted advertisements by socio-demographics to study the extent of social
inequalities in unhealthy advertisement exposure.
Background
The impact of unhealthy advertisements. The Commercial Determinants of Health (CDoH), defined
here as the processes where private organisations prioritise profit over public health, are powerful drivers of
trends in non-communicable diseases and health inequalities14,15. Organisations may encourage the consump-
tion of unhealthy products through marketing and advertisements campaigns across multiple platforms. There
is a growing concern among public health officials regarding the number of advertisements for risky products
e.g., alcohol, gambling, unhealthy food and beverages16,17. Numerous studies conducted around the world indi-
cate that exposure to unhealthy energy–dense, nutrition-poor food and beverage advertisements can promote
unhealthy eating habits18–24. The marketing of products that are high in fat, sugar and salt to children is par-
ticularly concerning, as it increases the potential for diet–related diseases later in life21. Exposing adolescents to
alcohol advertisements has been found to encourage early usage, and can lead to an increase in consumption25,
while gambling advertisements can trigger an impulse to increase activities, in particular in individuals who
want to either quit or gamble less frequently26.
Differences in exposure to advertising. When advertisements are prevalent within deprived areas, or
areas with high levels of obesity, their role may counter public health efforts to tackle health inequalities. Evi-
dence suggests a socio-economic difference in exposure to outdoor food advertising. For instance, in New-
castle upon Tyne, England larger spaces were found to be devoted to food advertisements within less affluent
areas5. Differences in exposure meanwhile have been linked to a big data revolution, which has seen many firms
possessing unprecedented amounts of information about consumers to enable advertisement campaigns to be
aimed at individual demographics within the population4,27. This practice has been shown to impact brand
perceptions of the exposed demographic. Harris et al.28 find that upon experiencing greater exposure towards
advertisements promoting energy dense and nutrient poor foods, Black and Latino adolescents develop a more
positive attitude towards the promoted brand. Pasch et al.29 show that the number of outdoor alcohol adver-
tisements found within 1500 feet of 63 Chicago schools is significantly higher for schools with 20% or more
Hispanic students—6.5 times higher than for Schools with less than 20% Hispanic students. Alcohol marketing
campaigns have also been shown to be more prevalent around areas frequented by University students. Kuo
et al.30 find that alcohol advertisements are prevalent in the alcohol outlets around college campuses in the USA.
Students are also a demographic more likely to be exposed to gambling advertisements. Clemens et al.31 find
that high exposure towards gambling advertisements is positively related to all assessed gambling outcomes. In
addition, strong associations have been found for adolescents and students engaging in risky behaviour such
as drinking and gambling when exposed to related advertisements32,33. Problem gambling in particular has the
potential to be amplified by drinking and eating disorders. Lopez et al.33 investigate the extent to which gambling
commercials are promoting risky behaviour of drinking alcohol and eating low nutritional value food, looking
at the narratives depicted within the advertisements. The authors find that British and Spanish football betting
advertisements attempt to align the consumption of alcohol with sports culture and friendship within the emo-
tionally charged context of watching sporting events. Indeed, even far reaching sporting bodies, e.g., the English
Premier League, have been shown to have marketing portfolios that include unhealthy products17.
Restricting exposure to unhealthy advertisements meanwhile has been found to have a positive effect on
behaviour24. Lwin et al.34, for example, study the impact of food advertising restrictions enforced in Singapore.
The authors find that children’s cognition towards fast-food shifts in a desirable direction upon a stricter policy
being adopted, with household stocks of unhealthy food items also decreasing. However, while there is evidence
that vulnerable populations are more exposed to unhealthy advertisements and restricting them is an effective
strategy, much of these data come from lab-based studies.
To our knowledge, there are very few to no known data available on the location of outdoor advertisements.
While advertisements range in type (e.g. online, print, vehicles), outdoor advertisements are prominent features
of environments that individuals may experience and interact with in their everyday experiences. The lack of
available data represents a significant gap in our ability to be able to understand differential patterns of exposure,
as well as effectively evaluative the impact of future regulative interventions. We need effective and efficient data
systems that map advertisement locations. Traditional data collection strategies employ primary surveys to
locate advertisements, however such methods are time and cost intensive making them static snapshots that fail
to capture the dynamic and evolving aspects of advertisement strategies.
Deep learning. Utilising incidental data sources, coupled with maturing image classification techniques,
offers one way forward to improve and automate the data collection process efficiently. Deep Learning is
one technique that has shown a lot of promise for developing solutions to challenging virtual and real world
problems35,36. These successes can be attributed to breakthroughs that enable deep neural networks to learn solu-
tions to problems that humans solve using intuition10. Deep neural networks are trained to extract compact
features from complex high dimensional input data. They accomplish this by combining layers of hierarchical
features into ever more complex concepts. Our workflow uses Convolutional Neural Networks (ConvNets),
which can extract features from inputs in the form of arrays and tensors37. A ConvNet trained to classify images
Scientific Reports | (2021) 11:4884 | https://doi.org/10.1038/s41598-021-84572-4 2
Vol:.(1234567890)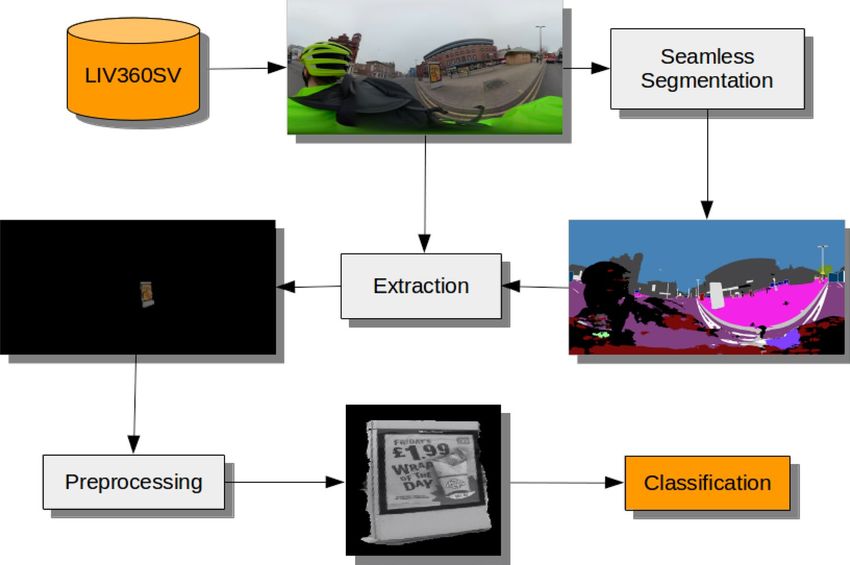
www.nature.com/scientificreports/
consists of layers of neurons, with the first layer extracting edges, which are combined into corners and contours
by the next layers, before subsequently being combined to form the object parts that enable a classification.
Through stacking multiple non-linear layers the network can be trained using stochastic gradient descent to
implement complex functions, that are sensitive towards minute details within inputs, while simultaneously
being able to ignore less relevant features37. Through building an effective classifier that can be updated with new
information (important when advertisements are constantly changing), deep learning offers a deployable tool
that automatically classify images more efficiently than manual coding by researchers.
Data
Mapillary Vistas dataset. Street level images (also known as street view images) are panoramic images
recorded at set intervals. Services such as Google Street View, Bing Maps and Mapillary use these data to provide
a virtual representation of map locations. In 2017 Mapillary introduced the Vistas dataset12 to aid the develop-
ment of state-of-the-art methods for road scene understanding. The dataset consists of 25,000 densely-anno-
tated, internationally crowd sourced, street level-images with 66 object categories, including billboards. Approxi-
mately 90% of the images are from road/sidewalk views in urban areas, with the remaining being rural areas and
off-road. Individual objects within each images are delineated using polygons. Since its release the Mapillary
Vistas has frequently been used for benchmarking panoptic street scene segmentation m ethods11,38.
The Liverpool 360 street view dataset. While there exists an abundance of street-level imagery on plat-
forms such as Google Street View, the recently imposed costs for using Google’s API, as well as cases of Google
updating terms and conditions to hinder researchers, highlights the need for alternative open sourced solutions.
Existing open and crowd sourced street-level images predominately lack the quality of the interactive panora-
mas found on services such as Google Street View. Images are frequently recorded using dashboard cameras,
and as a result have a restricted field of vision. Motivated by these factors we record an open street-level dataset
for Liverpool, using a GoPro Fusion 360◦ camera attached to a member of the team (Mark Green) who cycled
along major roads. We follow Mapillary’s recommendations for recording street-level images (https://help.mapil
lary.com/hc/en-us/articles/360026122412-GoPro-Fusion-360). The camera records front and back images at 0.5
second interval, which we later stitch together using GoPro Fusion Studio. To date our dataset consists of 25,349
street-level images each with GPS location recorded. We illustrate the current coverage of the LIV360SV dataset
in Fig. 1. We focused on sampling three areas of Liverpool with varying contexts over three different days: (1)
City Centre (Jan 14th 2020)—areas characterised by shops and services; (2) North Liverpool (Jan 15th 2020)—
areas contain high levels of deprivation; (3) South Liverpool (Jan 18th 2020)—areas include a mixture of afflu-
ent populations and diverse ethnic groups (See https://www.mapillary.com/app/org/gdsl_uol?lat=53.39&lng=-
2.9&z=11.72&tab=uploads).
Advertisement data. The Mapillary Vistas includes a billboards category that we utilise here. In practice,
the seamless segmentation network’s billboard category extracts billboards, company logos (e.g., the McDon-
ald’s arches) and store front signs. We therefore consider each of these items to be advertisements within the
context of this study, capturing the potential range of unhealthy imagery individuals may be exposed to and
influenced by. Furthermore, the dataset does not distinguish different types of content (e.g. advertisement type).
Further annotations would therefore be necessary to train panoptic scene segmentation networks to differentiate
between advertisement types. Manually annotating segmentation masks is a time consuming task. Instead, we
propose to classify advertisements extracted from street level images using a model trained to classify adver-
tisement images. To train the classifier we manually label advertisements extracted from a neighbouring city,
Manchester, UK, which we also download from Mapillary. While these data typically originate from dashboard
cameras, and are therefore likely to miss advertisements within an environment, the extracted advertisements
are adequate to train a classifier to distinguish content categories. Manchester was selected since it is geographi-
cally close to Liverpool, as well having a similar historical context (i.e. Northern industrial city with high levels
of deprivation spatially concentrated) that may see similar types of advertisements.
Spatial data. To examine the extent of geographical clustering in the socio-demographic types of areas that
advertisements are located, we use two area level datasets.
First, neighbourhood deprivation is measured using the English Indices of Deprivation 2 01940. The index
measures neighbourhood deprivation based on seven domains including income, employment, education, health,
crime, access to housing and services, and environmental features. Data are measured for Lower Super Output
Areas (LSOAs) which are administrative zones with an average population size of ≈ 1500 people. We use decile
of deprivation rank for analyses.
Second, socio-demographic area type is measured using 2011 Output Area Classification (OAC)41. OAC is a
neighbourhood classification built using data from demographic (e.g. age, sex, ethnicity) and social (e.g. occupa-
tion, education) measures to classify ‘area types’. OAC comprises 8 Supergroups and 26 Groups which we describe
in Table 1. We focus our evaluation at the Supergroup and Group levels. Output Areas are administrative zones
with a minimum of 100 people.
Method
Figure 2 illustrates our workflow, and we discuss each individual component in detail below. For implementation
details and dataset download instructions visit: https://github.com/gjp1203/LIV360SV.
Scientific Reports | (2021) 11:4884 | https://doi.org/10.1038/s41598-021-84572-4 3
Vol.:(0123456789)www.nature.com/scientificreports/
Figure 1. Map depicting the coverage of the LIV360SV dataset color coded by lower-layer super output areas
(LSOAs). This map was created using QGIS 2.8.6-Wien39.
Seamless scene segmentation. For extracting advertisements from street level images we use the seam-
less scene segmentation network introduced by Porzi et al.11. The network offers advantages of both seman-
tic segmentation—determining the semantic category that a pixel belongs to—and instance-specific seman-
tic segmentation—the individual object that a pixel belongs to, enabling differentiation between neighbouring
entities of the same type. The authors achieve state-of-the-art results on three street-view datasets, including
Cityscapes42, the Indian Driving Dataset43 and Mapillary Vistas12. We use the implementation provided by
Porzi et al.11—which has been pre-trained on the Mapillary Vistas dataset—to assign semantic categories to our
images. Subsequently areas that have been categorised by the network as type ’billboard’ are extracted from the
images. We find that the pre-trained network achieves a mean intersection over union (mIoU) score of 0.397 for
the category billboard on the Mappilary Vistas validation set. However, larger mIoU scores are achieved when
setting a threshold for the minimum number of billboard pixels for considering an image, reaching similar val-
ues to the 0.458 achieved in Porzi et al.11 across categories (see supplementary material). In addition we evaluate
the network’s error with regards to falsely detected and missed ads. The ground truth labelling of the Mapillary
Vistas validation set contains 4,562 billboards of 2,000 pixels and above—our selection criteria for extracting
advertisements, as for smaller advertisements it is often challenging to assign a category label. In comparison the
semantic scene segmentation network extracted 4,305 billboards, as well as 143 items that were falsely classified
as billboards, consisting of street signs, blank surfaces, traffic lights, and interestingly clock faces.
Extraction. Upon using the seamless scene segmentation network to identify regions within a street level
image that have been categorised as type billboard, we first use OpenCV’s44 ’connected components with stats
method’ to identify individual advertisements within a street level image (as each street level image may contain
multiple advertisements). We draw a convex hull around each disjoined group of billboard pixels (i.e., each indi-
vidual advertisement identified within the image) and fill the polygon to obtain a binary mask. Polygons con-
taining fewer than 2,000 pixels are discarded, as the majority of advertisements of this size are difficult to assign a
label to. If an image contains multiple advertisements we obtain a binary mask for each advertisement with their
respective locations. Within these individual masks, ones indicate areas within the convex hull drawn around
Scientific Reports | (2021) 11:4884 | https://doi.org/10.1038/s41598-021-84572-4 4
Vol:.(1234567890)www.nature.com/scientificreports/
Super-group Group
1a—farming communities
1—rural residents 1b—rural tenants
1c—ageing rural dwellers
2a—students around campus
2b—inner-city students
2—cosmopolitans
2c—comfortable cosmopolitans
2d—aspiring and affluent
3a—ethnic family life
3b—endeavouring ethnic mix
3—ethnicity central
3c—ethnic dynamics
3d—aspirational techies
4a—rented family living
4—multicultural metropolitans 4b—challenged asian terraces
4c—asian traits
5a—urban professionals and families
5—urbanites
5b—ageing urban living
6a—suburban achievers
6—suburbanites
6b—semi-detached suburbia
7a—challenged diversity
7b—constrained flat dwellers
7—constrained city dwellers
7c—white communities
7d—ageing city dwellers
8a—industrious communities
8b—challenged terraced workers
8—hard-pressed living
8c—hard-pressed ageing workers
8d—migration and churn
Table 1. Area classification for output area (OAC) cluster names41.
Figure 2. An illustration of our advertisement classification workflow. (The final image was converted to
monochrome for the Figure—colour images are used in modelling).
Scientific Reports | (2021) 11:4884 | https://doi.org/10.1038/s41598-021-84572-4 5
Vol.:(0123456789)www.nature.com/scientificreports/
the individual pixels identified as type billboard, while zeros mask the remaining entities within the images. The
masks subsequently allow us to extract the individual advertisements one at a time.
Preprocessing. We divide pre-processing into two steps. First we perform a number of operations to crop
and spatially transform the images to a frontal view. We subsequently outline an approach towards dealing with
over-representation, resulting from the same advertisement being extracted multiple times from temporally
sequential images.
Obtaining a frontal view With the remaining content having been masked out during the extraction step we
subsequently crop the images. However, we observe that distinct billboards depicting the same advertisement
will often be recorded from a different point of view, for instance due to differences in the location of each bill-
board and road layouts. Therefore, as the final step of our workflow is to pass the extracted items to a classifier,
we take an addition step of training a Spatial Transformation Network (STN)45 to transform the extracted items
to a frontal view, thereby increasing the likelihood of training and testing images having a similar depiction.
Addressing the duplication of distinct advertisements Recording street level images at 0.5 second intervals
brings the risk of recording distinct advertisements multiple times. As a result natural obstacles within the
environment (e.g., traffic) can lead to some advertisements enjoying a greater representation compared to oth-
ers. Implementing spatial constraints meanwhile—such as only evaluating images taken every n meters—can
result in less visible advertisements being missed. To address this issue we propose a method towards identifying
the duplication of distinct advertisements. Our approach involves measuring the similarity of advertisements
extracted from spatially proximate street level images within a specified Euclidean distance d. We use Scale-
Invariant Feature Transform (SIFT)46 to detect matching features within pairs of advertisements. We subsequently
construct a graph G where the nodes represent the extracted advertisements. Edges are added between nodes
where the number of matching features exceeds a threshold τ . We treat each disconnected sub-graph g ∈ G as
a distinct advertisement. Where |g| > 1 we discard all but the advertisement located closest to the centroid of g.
Considerations are required regarding the setting of the distance limit d and matching features threshold τ .
While calibrating our method we found evidence that low values for τ and larger values for d result in two distinct
advertisements being assigned to the same sub-graph g. However, using large values for τ reduces the number
of true positives. Based on the experiments outlined in the supplementary material we conduct our evaluation
below using τ = 60 and d = 10m. While some duplication remains with this setting, it allows us to automatically
identify the largest instances of duplication, resolving the imbalance within the data used for our evaluation.
Classification. We classify extracted advertisements using Keras’ InceptionV347 implementation with
weights pretrained on imagenet. We train the network for five 100 step epochs, using a learning rate of 1e−4
and a batch size of 32 images per step. The inputs images are of size 224 × 224 pixels. We also apply a common
dataset augmentation technique of adding random rotations (with a 30 degrees limit) when sampling images.
We accelerate the training process using a GeForce GTX 1080 GPU.
Results
We take a two-step approach towards evaluating our proposed workflow. First we analyse the clustering of adver-
tisements extracted using the seamless scene segmentation network component. For precision we conduct this
analysis upon assigning ground truth labels to the extracted advertisements. Our second step is to evaluate the
extent to which an InceptionV3 network can be trained to classify the extracted advertisements.
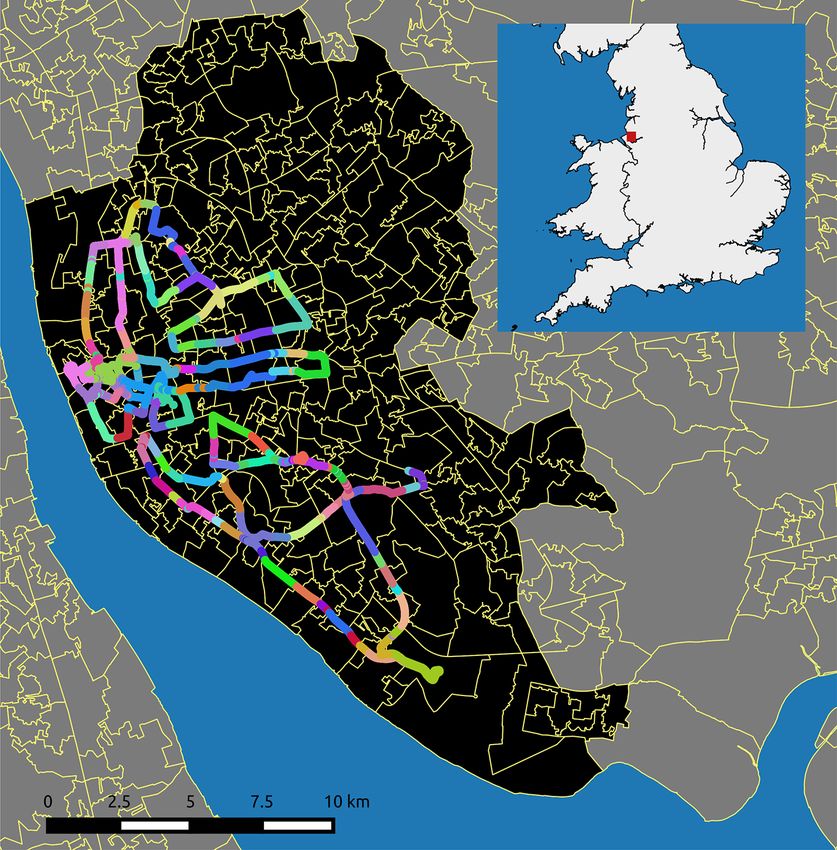
Examining inequalities in advertisement locations. We identified 10,106 advertisements, classified
as food (1335), alcohol (217), gambling (149) and other (8405). Upon removing near duplicate advertisements
using the method outlined in “Preprocessing” section we are left with food (873), alcohol (102), gambling (79)
and other (6247) advertisements. In Fig. 3 we illustrate the distribution of advertisements belonging to each
category across the LSOAs for Liverpool. The LSOAs are each assigned a color shading based on the decile that
they belong to, with white and black representing the most and least deprived respectively. Advertisements are
represented by circles.
We turn to bar-plots in Fig. 4 to illustrate exposure towards unhealthy advertisements per decile of depriva-
tion. However, in Fig. 4a we observe an imbalance in the number of street-level image samples per decile within
the LIV360SV dataset. We therefore focus on the proportion of advertisements found within each decile. In
Fig. 4b we observe that, the less deprived LSOAs have proportionally fewer advertisements compared to the
more deprived areas. Larger proportions of food advertisements are found within deciles 1 to 6. For gambling
meanwhile the largest proportion of advertisements are found within decile 6. We tested whether the differences
we observed across deprivation decile were meaningful (Table 2). While we found statistically significant differ-
ences across deciles for alcohol, food and other advertisements supporting our observation that they were more
common in deprived areas, we found no association for gambling.
Figure 5 compares the proportions of advertisements by OAC area type. For alcohol we observe that a
large proportion of advertisements belong to OAC 8c—Hard Pressed Aging Workers (14.29%, see Fig. 5b).
However, this category only contains 14 images (Fig. 5a). Among the better represented categories the largest
proportions of advertisements can be found within 2a—Students Around Campus (0.59%), 2b—Inner City
Students (0.70%), 3a—Ethnic Family Life (0.83%) and 4b—Challenged Asian Terraces (4.11%). For gambling
large proportions of advertisements are also located within 2a (0.35%) and 2b (0.64%). We also observe larger
proportional representation under Super-Group 7—Constrained City Dwellers, in particular 7a—Challenged
Diversity (0.36%) and 7c—White Communities (0.33%). The largest proportions of food advertisements can be
found within super-groups 2—Cosmopolitans, 4—Multicultural Metropolitans and 8—Hard-Pressed Living.
Scientific Reports | (2021) 11:4884 | https://doi.org/10.1038/s41598-021-84572-4 6
Vol:.(1234567890)www.nature.com/scientificreports/
Figure 3. Liverpool advertisement locations by Lower Super Output Areas (LSOAs). A color gradient indicates
the level of deprivation, with white and black being the most and least deprived respectively. This map was
created using QGIS 2.8.6-Wien39.
Figure 4. (a) Illustrates the number of street-level images per deprivation decile according to the 2019 English
indices of deprivation. (b,c) Contain the percentage of images with unhealthy advertisements and those of type
‘other’ respectively.
Specifically, 2a—Students Around Campus (3.67%), 2b—Inner-City Students (5.11%), 2c—Comfortable Cosmo-
politan (3.12%), 4b—Challenged Asian Terraces (16.44%), 4c—Asian Traits (16.67%), 8b—Challenged Terraced
Workers (4.85%) and 8c—Hard-Pressed Ageing Workers (7.14%). However, 4b (73), 4c (6) and 8c (14) contain
less images compared to the other categories. These differences observed across OAC groups were statistically
significant for all advertisement categories (Table 2).
Towards automated classifications. The above examination of inequalities in advertisement locations
was conducted with manually labelled samples. However, to conduct our evaluation at scale (e.g., for the entire
UK) manually labelling samples would represent an obvious time consuming bottleneck in our framework.
Therefore, we now evaluate if advertisements extracted from street-level imagery can be categorised automati-
cally using a state-of-the-art image classifier. As outline in “Classification” section we train an Inception-V3
Scientific Reports | (2021) 11:4884 | https://doi.org/10.1038/s41598-021-84572-4 7
Vol.:(0123456789)www.nature.com/scientificreports/
Figure 5. (a) Illustrates the number of street-level images per OAC category. (b,c) contain the percentage of
images per OAC that contain either unhealthy advertisements and those of type ‘other’ respectively.
Advert Deprivation OAC
Alcohol 70.99*** 120.62***
Food 686.16*** 301.97***
Gambling 11.16 25.14***
Other 628.95*** 976.67***
Table 2. Chi-squared tests for patterns in advert location by deprivation decile and output area classification
(OAC) group. p values are denoted as *< 0.05, **< 0.01, ***< 0.001.
Category Precision Recall F1
Food 0.76 0.619 0.68
Other 0.662 0.787 0.718
Table 3. Precision, recall and F1 scores for the automated classification component of our framework.
network using a training dataset that consists of manually labelled advertisements extracted from Mapillary
street view images for the city of Manchester. We obtain these advertisements using the seamless segmentation
network from Porzei et al.11, essentially repeating the process that we conducted for Liverpool. Via this process
we obtained 3,096 food, 197 alcohol, 141 gambling and 34,198 other images. We note however that due the
majority of these images having been extracted from dash-cam footage, the quality was lower compared to those
extracted from our LIV360SV data-set.
Our hypothesis is that the advertisements found within a neighboring cities are similar, giving us a source
training dataset that is closely aligned with our target dataset, i.e., the advertisements extracted from LIV360SV.
However, the Manchester dataset also has a shortage of images for the categories alcohol and gambling. We
therefore focus our evaluation on the categories food and other, leaving the alcohol and gambling categories for
future work. Considerations regarding how these imbalances could be addressed are provided in future studies
within the discussion section below. We use oversampling to address the imbalance between the categories food
and other.
Upon training the InceptionV3 network using the Manchester dataset we obtain weighted precision, recall
and F1 scores of 0.8518, 0.7157 and 0.7608 respectively. We use the weighted version of Keras’ precision recall F1
score support function to address the imbalance in the number of samples for food and other images extracted
from LIV360SV. In Table 3 we provide category wise mean precision, recall and F1 scores after randomly assign-
ing samples from other to five subsets of size equal to food. We observe high precision for food, with fewer
advertisements from category other being classified as food. However, food images are often classified as category
other, explaining the lower recall score. We hypothesize that these scores can be further improved when training
a classifier with a large-scale high-quality variation of our current training-set, for instance through extracting
images from additional cities within the region. For a qualitative evaluation of the input features determining
the classifications we refer the reader to Section 4 within the supplementary material.
Discussion
Our study demonstrates a novel workflow that can be used to efficiently identify the location of unhealthy adver-
tisements from street-view imagery. To date we have extracted 10,106 advertisements for Liverpool, UK, catego-
rised as food (1335), alcohol (217), gambling (149) and other (8405). There was distinct geographical clustering
of advertisements particularly with greater amounts of unhealthy advertisements in deprived areas and student
Scientific Reports | (2021) 11:4884 | https://doi.org/10.1038/s41598-021-84572-4 8
Vol:.(1234567890)www.nature.com/scientificreports/
populations. Our approach addresses the dearth of data available on the location of unhealthy advertisements,
offering an efficient and deployable tool for surveying other towns and cities.
The prevalence of food, gambling and alcohol advertisements within areas classified as inner-city students and
campus provides further evidence that the student population is experiencing greater exposure to advertisements
for unhealthy p roducts32,33. Regulating these areas and protecting younger student populations might be a key
policy goal particularly as this period of the life course is important at establishing behaviours that may continue
into later life. The clustering of unhealthy food advertisements in deprived areas may exacerbate inequalities in
obesity and related health conditions. This would suggest that any policy to regulate the location of unhealthy
food advertisements would be progressive and potentially help to narrow inequalities.
Having identified the prevalence of unhealthy advertisements within areas frequented by students opens up
interesting avenues for future research. For example, given advertisers’ attempts to normalize the consumption
of unhealthy items while gambling with f riends33, an evaluation could be conducted to determine whether these
behaviours are more likely to be enacted in areas with greater exposure. In addition, insights could be gained
through differentiating between advertisement formats and studying the extent to which each type contributes
towards triggering an impulse to gamble, e.g., billboard, shop window, and store signs.
A further avenue for future research is to evaluate how exposures to unhealthy advertising vary in relation
to policy interventions and strategies. For example, evaluating the extent to which the current rules restricting
the promotion of high fat, sugar and salt (HFSS) products within 100 meters from schools is deterring adver-
tisers (https://www.asa.org.uk/advice-online/food-hfss-media-placement.html). In addition, we consider that
individuals are often exposed to advertisements via dynamic entities. Bus stops for instance use monitors that
can switch between advertisements. Developing our approach to account for these issues will be useful for future
research. Further, insights could be gained through differentiating between advertisement formats and studying
the extent to which each type contributes towards triggering behaviours to identify where regulations should
focus their efforts.
A key strength to our study is the efficient data collection of advertisement locations. We make methodological
advancements in measuring the location of unhealthy advertisements through utilising a novel deep learning
approach, with no known prior research applying similar methods or developing efficient alternatives. To our
knowledge, there is no open dataset that charts the location of advertisements in the UK. Having access to open
data on advertisement locations is key for making effective policy decisions. Through automating the classifi-
cation of street-view imagery, our approach can be efficiently combined with incidental data sources to locate
advertisements over time with little additional time or resource costs. Expanding our data collection efforts to
additional cities will help improve data coverage. This could be supplemented through crowd sourcing images
through recruiting and allowing individuals to take photos and geo-tag advertisements using an app. Increas-
ing the number and balance of advertisement types could improve our model performance especially for those
advertisements with low counts (alcohol and gambling).
There are several limitations with regards to both the data and methods used in this paper. First, LIV360SV
contains a number of unhealthy advertisements that are worthy of their own category. For instance, electronic
cigarettes and vaping devices have become the most common tobacco products used by youth, with brands using
similar marketing and advertising strategies as previously used for traditional tobacco p roducts48. Classifying new
categories would require retraining our classifier using additional data. Similarly, when applying our approach to
a different location representative training data must be obtained for local brands and product ranges. Although
our ‘other’ category may not be specific, it captures the total potential exposure for unhealthy advertisements
given that advertisements may change weekly in their content.
We note that the data collection process requires a systematic approach. Figure 4 displays that our dataset
is skewed towards more deprived areas with regards to the number of samples. This reflects both the historical
concentration of deprivation in Liverpool, as well the lack of a systematic routing approach to data collection.
Cycling routes should be designed to ensure representative routes (e.g. using local demographic data alongside
GIS network routing methods). Collecting data across different contexts and cities will also help to improve the
generalisability of our dataset. Our initial data collection wave was in January where anecdotally during data
collection, many advertisements were observed as relating to gyms or physical exercise. Commercial firms may
release advertisements at different parts of the year based on seasonal trends (e.g. Easter and chocolate), events
(e.g. gambling around sporting events) or product development. We plan to record seasonal data to enable a
longitudinal study of advertisements within Liverpool.
While deep learning enables new possibilities with regards to evaluating our environments, we note that any
conclusions drawn from evaluations underpinned by this technology should be cautious. As can be seen within
our data-set, misclassifications exist with regards to false-positives/negatives, incorrect classification in mixed
imagery (e.g. advertisements containing both fast food meals and alcohol) or advertisements missed from the
workflow. We argue that our work shows the potential of these technologies in generating valuable data on expo-
sures of unhealthy advertisements where such data does not exist. Future methodological work should seek to
refine these approaches to improve their utility for informing public health initiatives.
We consider how exposure to advertisements relates to static populations (e.g. deprivation), however popula-
tions move around cities meaning that residential neighbourhoods are not always the best measure for experi-
ences. Extending our analyses to assess how exposure to unhealthy advertisements varies by population flows (e.g.
commuting patterns along major roads, differences in day- and night-time populations). Advertisements may
be targeted at these flows to maximise their potential audiences. Understanding these inequalities in dynamic
exposures may identify particular spaces that are important for elucidating exposures (e.g. work, school), which
could be targeted by interventions.
Finally, steps are necessary to improve the accuracy of the workflow’s classifier component (“Towards auto-
mated classifications” section). Our evaluation shows that our approach requires more representative training
Scientific Reports | (2021) 11:4884 | https://doi.org/10.1038/s41598-021-84572-4 9
Vol.:(0123456789)www.nature.com/scientificreports/
images for food, and as mentioned, we only managed to collect a limited number of advertisements of type
gambling and alcohol. We note that an alternative approach to this problem would be to collect additional data
from an image search engine, and to turn to domain alignment techniques, such as the generate to adapt approach
proposed by Sankaranarayanan et al.49, where a source dataset is aligning with a target domain using Generative
Adversarial Networks (GANs)50.
GANs are also increasingly being used as a technique for dataset a ugmentation51. This technique has relevant
applications towards improving the classification of advertisements. We note that advertisements extracted from
street level imagery are often partially obscured by other real world entities (cars, trees, pedestrians). We propose
to embed selected advertisements within street-level imagery through GANs to create additional training data
(albeit ‘fake data’) for model training. To date we can show that advertisements can be successfully integrated
into street-level images. We place the advertisement using a STN to transform the image to a target shape. Finally
we train GANs to realistically embed the images. We hypothesize that augmenting our collected street view data
with these secondary GANs created data will enable the training of an effective model.
Conclusion
Our study presents a novel open deep learning workflow for extracting and classifying unhealthy advertise-
ments within street-level imagery. Tackling inequalities in exposures to unhealthy advertisements might offer
feasible regulatory opportunities for public authorities, especially when coupled with efficient and effective data
collection methods to support decision making. There are very few to no existing secondary datasets providing
this information to public authorities or researchers, and our project can solves this barrier to effective decision
making. Our deployable tool can be used to efficiently collect data for understanding exposure to unhealthy
advertisements, as well as identifying areas with high exposures that can benefit from restriction policies.
Received: 25 June 2020; Accepted: 5 February 2021
References
1. Batada, A., Seitz, M. D., Wootan, M. G. & Story, M. Nine out of 10 food advertisements shown during saturday morning children’s
television programming are for foods high in fat, sodium, or added sugars, or low in nutrients. J. Am. Diet. Assoc. 108, 673–678
(2008).
2. Isselmann DiSantis, K. et al. Sensitizing black adult and youth consumers to targeted food marketing tactics in their environments.
Int. J. Environ. Res. Public Health 14, 1316 (2017).
3. Powell, L. M., Wada, R. & Kumanyika, S. K. Racial/ethnic and income disparities in child and adolescent exposure to food and
beverage television ads across the us media markets. Health Place 29, 124–131 (2014).
4. Tatlow-Golden, M. et al. A safe glimpse within the black box? Ethical and legal principles when assessing digital marketing of food
and drink to children. Public Health Panor. 3, 613–621 (2017).
5. Adams, J., Ganiti, E. & White, M. Socio-economic differences in outdoor food advertising in a city in Northern England. Public
Health Nutrition 14, 945–950 (2011).
6. Moodie, R. et al. Profits and pandemics: Prevention of harmful effects of tobacco, alcohol, and ultra-processed food and drink
industries. Lancet 381, 670–679 (2013).
7. Liu, W. et al. Space-time analysis of unhealthy food advertising: New Zealand children’s exposure and health policy options. Health
Prom. Int. (2019).
8. Kelly, B., Cretikos, M., Rogers, K. & King, L. The commercial food landscape: Outdoor food advertising around primary schools
in Australia. Aust. N. Z. J. Public Health 32, 522–528 (2008).
9. Hillier, A. et al. Clustering of unhealthy outdoor advertisements around child-serving institutions: A comparison of three cities.
Health Place 15, 935–945 (2009).
10. Goodfellow, I., Bengio, Y. & Courville, A. Deep Learning (MIT Press, Cambridge, 2016).
11. Porzi, L., Bulo, S. R., Colovic, A. & Kontschieder, P. Seamless scene segmentation. In The IEEE Conference on Computer Vision and
Pattern Recognition (CVPR) (2019).
12. Neuhold, G., Ollmann, T., Rota Bulò, S. & Kontschieder, P. The mapillary vistas dataset for semantic understanding of street scenes.
In International Conference on Computer Vision (ICCV) (2017).
13. Gilbody, S., Wilson, P. & Watt, I. Direct-to-consumer advertising of psychotropics: An emerging and evolving form of pharma-
ceutical company influence. Br. J. Psychiat. 185, 1–2 (2004).
14. Kickbusch, I., Allen, L. & Franz, C. The commercial determinants of health. Lancet Glob. Health 4, e895–e896 (2016).
15. West, R. & Marteau, T. Commentary on casswell (2013): The commercial determinants of health. Addiction (Abingdon, England)
108, 686–687 (2013).
16. Cassidy, R. & Ovenden, N. Frequency, duration and medium of advertisements for gambling and other risky products in com-
mercial and public service broadcasts of english premier league football. (2017).
17. Ireland, R. et al. Commercial determinants of health: Advertising of alcohol and unhealthy foods during sporting events. Bull.
World Health Organ. 97, 290 (2019).
18. Smits, T., Vandebosch, H., Neyens, E. & Boyland, E. The persuasiveness of child-targeted endorsement strategies: A systematic
review. Ann. Int. Commun. Assoc. 39, 311–337 (2015).
19. Lesser, L. I., Zimmerman, F. J. & Cohen, D. A. Outdoor advertising, obesity, and soda consumption: A cross-sectional study. BMC
Public Health 13, 20 (2013).
20. Calvert, S., Dempsey, R. C. & Povey, R. A qualitative study investigating food choices and perceived psychosocial influences on
eating behaviours in secondary school students. Br. Food J. (2020).
21. Sadeghirad, B., Duhaney, T., Motaghipisheh, S., Campbell, N. & Johnston, B. Influence of unhealthy food and beverage marketing
on children’s dietary intake and preference: A systematic review and meta-analysis of randomized trials. Obes. Rev. 17, 945–959
(2016).
22. Hershko, S. et al. Advertising influences food choices of university students with adhd. J. Attent. Disord.1087054719886353 (2019).
23. Martinez-Lacoba, R., Pardo-Garcia, I., Amo-Saus, E. & Escribano-Sotos, F. Socioeconomic, demographic and lifestyle-related
factors associated with unhealthy diet: A cross-sectional study of university students. BMC Public Health 18, 1241 (2018).
24. Walton, M., Pearce, J. & Day, P. Examining the interaction between food outlets and outdoor food advertisements with primary
school food environments. Health Place 15, 841–848 (2009).
Scientific Reports | (2021) 11:4884 | https://doi.org/10.1038/s41598-021-84572-4 10
Vol:.(1234567890)www.nature.com/scientificreports/
25. Anderson, P., De Bruijn, A., Angus, K., Gordon, R. & Hastings, G. Impact of alcohol advertising and media exposure on adolescent
alcohol use: A systematic review of longitudinal studies. Alcohol Alcohol. 44, 229–243 (2009).
26. Binde, P. Exploring the impact of gambling advertising: An interview study of problem gamblers. Int. J. Mental Health Addic. 7,
541 (2009).
27. Johnson, J. P. Targeted advertising and advertising avoidance. Rand J. Econ. 44, 128–144 (2013).
28. Harris, J. et al. A qualitative assessment of US black and latino adolescents’ attitudes about targeted marketing of unhealthy food
and beverages. J. Child. Med. 13, 295–316 (2019).
29. Pasch, K. E., Komro, K. A., Perry, C. L., Hearst, M. O. & Farbakhsh, K. Does outdoor alcohol advertising around elementary schools
vary by the ethnicity of students in the school?. Ethn. Health 14, 225–236 (2009).
30. Kuo, M., Wechsler, H., Greenberg, P. & Lee, H. The marketing of alcohol to college students: The role of low prices and special
promotions. Am. J. Prev. Med. 25, 204–211 (2003).
31. Clemens, F., Hanewinkel, R. & Morgenstern, M. Exposure to gambling advertisements and gambling behavior in young people.
J. Gambl. Stud. 33, 1–13 (2017).
32. Jones, S. C. & Magee, C. A. Exposure to alcohol advertising and alcohol consumption among Australian adolescents. Alcohol
Alcohol. 46, 630–637 (2011).
33. Lopez-Gonzalez, H., Estévez, A., Jiménez-Murcia, S. & Griffiths, M. D. Alcohol drinking and low nutritional value food eating
behavior of sports bettors in gambling advertisements. Int. J. Mental Health Addic. 16, 81–89 (2018).
34. Lwin, M. O. et al. A macro-level assessment of introducing children food advertising restrictions on children’s unhealthy food
cognitions and behaviors. Int. J. Advert. 1–22, (2020).
35. Silver, D. et al. Mastering the game of Go without human knowledge. Nature 550, 354 (2017).
36. Mnih, V. et al. Playing atari with deep reinforcement learning. arXiv:1312.5602 (2013).
37. LeCun, Y., Bengio, Y. & Hinton, G. Deep learning. Nature 521, 436 (2015).
38. Kirillov, A., Girshick, R., He, K. & Dollar, P. Panoptic feature pyramid networks. In The IEEE Conference on Computer Vision and
Pattern Recognition (CVPR) (2019).
39. QGIS.org. Qgis geographic information system. Open Source Geospatial Foundation Project. http://qgis.org (2020).
40. Ministry of Housing. Communities and Local Government. Engl. Indices Deprivation2019 (2019).
41. Gale, C. G., Singleton, A. D., Bates, A. G. & Longley, P. A. Creating the 2011 area classification for output areas (2011 oac). J. Spat.
Inf. Sci. 2016, 1–27 (2016).
42. Cordts, M. et al. The cityscapes dataset for semantic urban scene understanding. In Proc. of the IEEE Conference on Computer
Vision and Pattern Recognition (CVPR) (2016).
43. Varma, G., Subramanian, A., Namboodiri, A., Chandraker, M. & Jawahar, C. Idd: A dataset for exploring problems of autono-
mous navigation in unconstrained environments. In 2019 IEEE Winter Conference on Applications of Computer Vision (WACV),
1743–1751 (IEEE, 2019).
44. Itseez. Open source computer vision library. https://github.com/itseez/opencv (2015).
45. Jaderberg, M. et al. Spatial transformer networks. Adv. Neural Inf. Process. Syst.2017–2025 (2015).
46. Lowe, D. G. Object recognition from local scale-invariant features. In Proceedings of the Seventh IEEE International Conference on
Computer Vision, vol. 2, 1150–1157 (IEEE, 1999).
47. Szegedy, C., Ioffe, S., Vanhoucke, V. & Alemi, A. Inception-v4, inception-resnet and the impact of residual connections on learning.
arXiv:1602.07261 (2016).
48. Walley, S. C., Wilson, K. M., Winickoff, J. P. & Groner, J. A public health crisis: Electronic cigarettes, vape, and juul. Pediatrics 143,
e20182741 (2019).
49. Sankaranarayanan, S., Balaji, Y., Castillo, C. D. & Chellappa, R. Generate to adapt: Aligning domains using generative adversarial
networks. In Proceedings of the IEEE Conference on Computer Vision and Pattern Recognition 8503–8512 (2018).
50. Goodfellow, I. et al. Generative adversarial nets. In Proceedings of of NIPS 2672–2680 (2014).
51. Sixt, L., Wild, B. & Landgraf, T. Rendergan: Generating realistic labeled data. Front. Robot. AI 5, 66 (2018).
Acknowledgements
This work was supported by the Economic and Social Research Council [Grant Number ES/L011840/1].
Author contributions
G.P., M.G., and A.S. designed the research, analyzed the results and wrote the paper. E.B. made key contributions
with respect to the literature review. R.S. made conceptual suggestions and also contributed towards the writing
of the paper. Y.V. made contributions towards the acquisition and preparation of data. All authors reviewed the
manuscript.
Competing Interests
The authors declare no competing interests.
Additional information
Supplementary Information The online version contains supplementary material available at https://doi.
org/10.1038/s41598-021-84572-4.
Correspondence and requests for materials should be addressed to M.G.
Reprints and permissions information is available at www.nature.com/reprints.
Publisher’s note Springer Nature remains neutral with regard to jurisdictional claims in published maps and
institutional affiliations.
Scientific Reports | (2021) 11:4884 | https://doi.org/10.1038/s41598-021-84572-4 11
Vol.:(0123456789)www.nature.com/scientificreports/
Open Access This article is licensed under a Creative Commons Attribution 4.0 International
License, which permits use, sharing, adaptation, distribution and reproduction in any medium or
format, as long as you give appropriate credit to the original author(s) and the source, provide a link to the
Creative Commons licence, and indicate if changes were made. The images or other third party material in this
article are included in the article’s Creative Commons licence, unless indicated otherwise in a credit line to the
material. If material is not included in the article’s Creative Commons licence and your intended use is not
permitted by statutory regulation or exceeds the permitted use, you will need to obtain permission directly from
the copyright holder. To view a copy of this licence, visit http://creativecommons.org/licenses/by/4.0/.
© The Author(s) 2021
Scientific Reports | (2021) 11:4884 | https://doi.org/10.1038/s41598-021-84572-4 12
Vol:.(1234567890)You can also read