A high-fidelity simulation of the C5G7 benchmark by using the parallel ENTER code
←
→
Page content transcription
If your browser does not render page correctly, please read the page content below

EPJ Web of Conferences 247, 06023 (2021)                                                               https://doi.org/10.1051/epjconf/202124706023
PHYSOR2020

               A high-fidelity simulation of the C5G7 benchmark by using the parallel
                                             ENTER code

                                                    Zhenglin Ruan1, Haibing Guo1*
                 1
                     Institute of Nuclear Physics and Chemistry, China Academy of Engineering Physics
                                             Mianyang, Sichuan 621900, China

                                         ruanzhenglin@gmail.com, guohaib@foxmail.com

                                                                   ABSTRACT

                 In simulation of advanced nuclear reactors, requirements like high precision, high efficiency
                 and convenient to multi-physics coupling are putting forward. The deterministic transport
                 method has the advantage of high efficiency, capable of obtaining detailed flux distribution
                 and efficient in multi-physics coupling, but its accuracy is limited by the homogenized
                 reaction cross-section data and core modelling exactness. The traditional two-steps
                 homogenization strategy may introduce substantial deviation during the assembly calculation.
                 It is possible to conduct a whole core deterministic transport simulation pin-by-pin to
                 achieve higher accuracy, which eliminates the assembly homogenization process. The C5G7
                 benchmarks were proposed to test the ability of a modern deterministic transport code in
                 analyzing whole core reactor problems without spatial homogenization. Different
                 deterministic code that developed by different methods were applied to the benchmark
                 simulation and some of them solved the benchmark accurately. However, there still exist
                 some drawbacks in the given calculation processes which carried out by some other
                 deterministic transport codes and we could find that the fuel pin cell in the assembly were
                 not exactly geometrically modelled owing to the limit of the code. Consequently, the
                 calculation precision could be improved by utilizing a high-fidelity geometry modelling. In
                 this paper, the C5G7 benchmarks with different control rod position and different
                 configuration were calculated by the finite element SN neutron transport code ENTER [1],
                 and the results were presented after massively parallel computation on TIANHE-II superco
                 mputer. By introducing a large scale high-fidelity unstructured meshes, high fidelity
                 distributions of power and neutron flux were gained and compared with the results from
                 other codes, excellent consistency were observed. To sum up, the ENTER code can meet
                 those new requirements in simulation of advanced nuclear reactors and more works and
                 researches will be implemented for a further improvement.

         KEYWORDS: Discrete ordinate, Finite element method, ENTER, Whole core transport, C5G7,
         Massively parallel computation

                                                            1. INTRODUCTION

         With the development of nuclear energy in recent years, a series of advanced nuclear reactors have been
         built around the world. Gaining more attention on the safety, new demands like high accuracy power
         distribution and neutron flux distribution are needed to design an advanced reactor system. These
         demands put new requirements on the tools used to solve the neutron transport equation. In order to get

  © The Authors, published by EDP Sciences. This is an open access article distributed under the terms of the Creative Commons Attribution License 4.0
  (http://creativecommons.org/licenses/by/4.0/).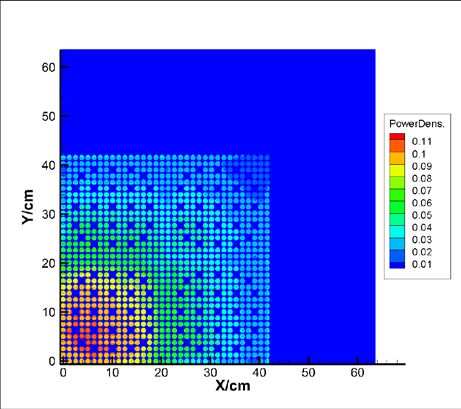
EPJ Web of Conferences 247, 06023 (2021)                                              https://doi.org/10.1051/epjconf/202124706023
PHYSOR2020

         high accuracy results, many new neutron transport codes have been developed to replace the previous
         codes mainly based on the diffusion theory. We usually calculate a large scale 3-D core by using the
         traditional two step method which may introduce errors during the calculation and finally influence the
         accuracy of power and flux distributions. So how to eliminate the errors and get a high-fidelity result have
         been an essential research point and gained much interest from researchers. Owing to the fast
         development of computer technology, high fidelity calculation method can be used to solve neutron
         transport equation and simulate a large scale problem.

         Besides, the C5G7 MOX benchmark [2] has been proposed by the Nuclear Energy Agency in 2005. The
         benchmark aims at testing the ability of modern deterministic transport codes to analysis a whole reactor
         core without spatial homogenization. Several different deterministic transport codes have been tested and
         the calculation results have been also given in the benchmark. But according to the benchmark book,
         some codes of them remain some imperfect calculation details which can be improved. Most of the
         disadvantage is in the mesh generation step. The TORT code [3], PARTISN code [4] and THREEDANT
         code [5] have done a geometric approximation in generating the pin cell meshes. They set the cylindrical
         fuel rod into a straight edge polygon. And then the benchmark was calculated. More discussion about the
         meshes will be present in Section. 2.

         In this paper, the C5G7 MOX benchmark was analyzed by the ENTER code with high fidelity meshes. In
         Section. 2, the ENTER code and meshes generating method are introduced briefly. In Section. 3 and 4, the
         calculation results are presented and compared with other codes. In Section. 5, all the works are
         summarized.

                                             2. METHODS AND MESHES

         2.1.   General Introduction to the ENTER Code

         The ENTER code was based on the finite element method and SN neutron transport method. The finite
         element method had been widely used in the neutron transport analysis. We applied the Galerkin Least
         Square (GLS) finite element method in ENTER. With the advantage of obtaining quantity distribution
         field and efficient in multi-physics coupling simulation, the ENTER code could handle the complex
         problems with large scale geometry construction. And the finite element transport code can massively
         parallel compute by introduce the parallel adaptive unstructured meshes applications infrastructure
         JAUMIN [6] to accomplish the domain decomposition and communicate between processes.

         As portrayed, the ENTER code can run on the TIANHE-II with more than parallel 1200 processes in this
         research. Owing to the memory limitation, the order of discrete ordinates was set as S4 and the
         convergence criteria were set to 1 × 10 for the flux and 1 × 10 for the eigenvalue. The power was
         calculated by setting normalized total power as the number of total fuel pins which was 1056 pins in the
         core.

         2.2.   Discussion of the Meshes Used in the Simulation

         Absolutely, the meshes considerably influenced the calculation accuracy. It should be noted that the codes
         were usually developed with an uncomplicated geometry processing form previous researches. Some of
         them, such as the TORT code [3], PARTISN code [4], ARES code [7] and THREEDANT code [5],
         replaced the curve boundaries with polylines. This kind of treatments were not accuracy enough. The
         ENTER code can solve the problem with complex geometry by domain decomposition.

                                                              2
EPJ Web of Conferences 247, 06023 (2021)                                             https://doi.org/10.1051/epjconf/202124706023
PHYSOR2020

         A CAD program was chosen to generate the initial reactor core model and then convert the geometry into
         an unstructured meshes combination. As shown in Figure 1. and Figure 2., the core area was meshed with
         quadrilateral unstructured grids and the outer reflector area was meshed from fine grids to coarse grids.
         We can see the mesh edges were suitable to match the initial geometric boundary. The axial direction was
         set with rough meshes, which were 6 meshes, 6 meshes,6 meshes and 8 meshes from the button to the top
         of the reactor, to increase the calculation speed because we concentrated more on the radial neutron flux
         distribution. Total number of the unstructured meshes was 1642290 and it would be increased 2 × 2 ×
         2 = 8 times to 13138320 meshes by the code when calculating to guarantee the accuracy. The coordinate
         origin of the coordinate system used in this paper was located in the center of the bottom face of the most
         inner fuel pin.

                                    Figure 1.   Mesh Composition in Core Area (X-Y, Z=0)

                               Figure 2.   Mesh Composition of the Whole Reactor (X-Y, Z=0)

                                                             3
EPJ Web of Conferences 247, 06023 (2021)                                               https://doi.org/10.1051/epjconf/202124706023
PHYSOR2020

                                           3. BENCHMARKE DISCRIBUTION

         The C5G7 MOX benchmark described a model of a 1/8 PWR reactor core with vacuum boundary
         conditions outer the reactor. And two UO2 assemblies and two MOX assemblies with 3 different level of
         enrichment (4.3%, 7.0%, 8.7%) were set staggered. Each assembly was consist of 17 × 17 rods and the
         size of it was 21.42cm × 21.42cm × 42.84cm . The whole size of the model was 64.24cm ×
         64.24cm × 64.24cm. This benchmark covered three cases characterized by control position: (1)
         UNRODDED – control rods stayed in reflector above fuel assemblies and the fission chamber should also
         be modeled in the upper reflector, (2) RODDED A – the control rod was inserted one-third of the inner
         UO2 fuel assemblies, and (3) RODDED B – the control rod was inserted two-thirds of the inner UO2 fuel
         assemblies and one-third of the two MOX assemblies.

         In the benchmark, the fuel assemblies were split into three axial slices equally. Slice 1, 2, 3 were the lower,
         middle and upper slice.

         As it was shown in the benchmark, seven group macroscopic cross-section of all material, which included
         the fuel rods, guide tubes, fission chamber and control rods, was provided. All the macroscopic
         cross-sections were converted into the ENTER coed format.

                                              4. CALCULATION RESULT

         The ENTER code was used to simulate the whole reactor transport and the pin power distribution, flux
         distribution and  eigenvalue are calculated. And the pin power distribution and flux distribution were
         gained from the transport calculation by applying ENTER code. Table I. presented the maximum pin
         power in slices 1, 2, 3, under the case of UNRODED, RODDED A and RODDED B. All the results were
         compared with the reference results in the benchmark book [2].

                                           Table I: Results of Maximum Pin Power

                                                               Simulation Simulation                   Simulation
                              Simulation
                                           Reference Relative Results and Results and                  Results and
                                Results
               CASE                           (By     Error    Error (%)   Error (%)                    Error (%)
                                  (By
                                           MCNP [8])   (%)          (By        (By                          (By
                               ENTER)
                                                              TORT-PSU) THREEDANT)                     PARTISN)
                                                                  2.485      2.506                        2.486
           UNRODDED             2.4824       2.481     0.06
                                                                  (0.14)    (1.10)                        (0.21)
           UNRODDED                                               1.113      1.121                        1.112
                                1.1290       1.108     1.90
            in slice 1                                            (0.46)    (1.15)                        (0.36)
           UNRODDED                                               0.884      0.891                        0.884
                                0.9011       0.882     2.17
            in slice 2                                            (0.18)    (1.02)                        (0.22)
           UNRODDED                                               0.488      0.494                        0.490
                                0.5067       0.491     3.20
            in slice 3                                           (-0.66)    (0.64)                       (-0.14)
                                                                  2.256      2.275                        2.253
            RODDED A            2.2418       2.253    -0.50
                                                                  (0.10)    (0.95)                       (-0.03)
            RODDED A                                              1.200      1.211                        1.202
                                1.2136       1.197     1.39
             in slice 1                                           (0.28)    (1.15)                        (0.39)

                                                               4
EPJ Web of Conferences 247, 06023 (2021)                                           https://doi.org/10.1051/epjconf/202124706023
PHYSOR2020

            RODDED A                                                 0.830           0.840             0.831
                                0.8409      0.832        1.07
             in slice 2                                             (-0.14)          (1.07)            (0.00)
            RODDED A                                                 0.305           0.306             0.300
                                0.3104      0.304        2.11
             in slice 3                                              (0.43)          (0.61)           (-1.27)
                                                                     1.836           1.847             1.822
            RODDED B            1.8248      1.835        2.34        (0.08)          (0.68)           (-0.67)
            RODDED B                                                 1.197           1.214             1.204
             in slice 1         1.2281      1.200        2.30       (-0.22)          (1.19)            (0.32)
            RODDED B                                                 0.554           0.556             0.545
             in slice 1         0.5614      0.554        1.34        (0.02)          (0.36)           (-1.58)
            RODDED B                                                 0.216           0.215             0.208
             in slice 1         0.2203      0.217        1.52       (-0.42)         (-0.63)           (-3.94)

         The relative percent errors of the maximum pin power in Table I. were range from 0.06% to 3.20%. The
         magnitudes of maximum pin power from ENTER code were notably bigger than the reference results and
         the results of TORT, THREEDANT and PARTISN. It might be caused by the defect of the least squares
         finite element method when solving integral assembly matrix. More work would be done to improve the
         code and more results would be calculated and discussed.

         The power of each assembly was present in Table II. And all the relative percent errors of assembly power
         were lower than 1.69%. These comparisons proved that the ENTER code did have the ability in
         calculating a large scale transport problem with less approximation. To gain a better result, higher
         quadrature order and finer mesh would be used in next work.

                                           Table II: Results of Assembly Power

                                                                  Simulation Simulation             Simulation
                              Simulation
                                           Reference Relative    Results and Results and            Results and
                                Results
              Assembly                       (By      Error       Error (%)   Error (%)              Error (%)
                                 (By
                                            MCNP)      (%)             (By        (By                   (By
                               ENTER)
                                                                 TORT-PSU) THREEDANT)               PARTISN)
            UNRODDED                                                 491.7      494.7                  491.8
                                 499.48     491.2       1.69
             Inner UO2                                               (0.10)     (0.70)                (0.13)
            UNRODDED                                                 212.5      211.0                  212.4
                                 209.20     212.7       -1.65
               MOX                                                  (-0.10)    (-0.81)                (-0.13)
            UNRODDED                                                 139.3      139.4                  139.3
                                 138.12     139.4       -0.92
             Outer UO2                                              (-0.05)     (0.00)                (-0.05)
            RODDED A                                                 461.7      464.6                  461.1
                                 465.75     461.2       0.99
             Inner UO2                                               (0.12)     (0.72)                (-0.01)
            RODDED A                                                 221.5      220.0                  221.6
                                 218.91     221.7       -1.26
               MOX                                                  (-0.11)    (-0.77)                (-0.04)
            RODDED A                                                 151.3      151.5                  151.6
                                 152.43     151.4       0.68
             Outer UO2                                              (-0.06)     (0.06)                (0.16)
            RODDED B                                                 395.4      397.5                  393.6
             Inner UO2           401.16     395.4       1.46         (0.00)     (0.53)                (-0.47)
            RODDED B                                                 237.9      235.0                  236.8
               MOX               233.43     236.6       -1.34        (0.54)    (-0.68)                (0.08)
            RODDED B             187.98     187.3        0.36        189.0      188.5                  188.8

                                                            5
EPJ Web of Conferences 247, 06023 (2021)                                             https://doi.org/10.1051/epjconf/202124706023
PHYSOR2020

              Outer UO2                                              (0.88)           (0.59)             (0.79)

         The 3-D high precision power density distribution and flux distribution were also gained and the 2-D
         results in specific cross-sections of the UNRODDED, RODDEDA and RODDEDB cases were showed in
         Figure 3., Figure 4. and Figure 5. From Figure 3-5, it was obviously that the ENTER code could provide a
         high fidelity solution to the 3-D transport problems. And with the control rods injecting into the reactor,
         the pin power in the bottom of the core was increasing and the flux was decreasing as expected.

                  a. Power Density Distribution in                     b. Power Density Distribution in
                     UNRODDED Case (X-Y, Z=0)                            UNRODDED Case (Y-Z, X=0)

                c. Flux Distribution of Group 7 in                    d. Flux Distribution of Group 7 in
                   UNRODDED Case (X-Y, Z=0)                              UNRODDED Case (Y-Z, X=0)

           Figure 3.    Power Density Distribution and Flux Distribution of Group 7 Form X-Y and Y-Z
                                        Cross-Section in UNRODDED Case

                                                             6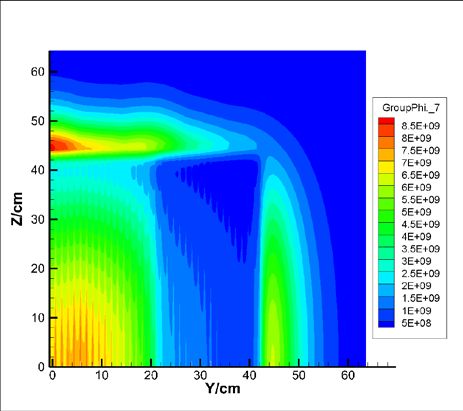
EPJ Web of Conferences 247, 06023 (2021)                                    https://doi.org/10.1051/epjconf/202124706023
PHYSOR2020

                  a. Power Density Distribution in              b. Power Density Distribution in
                      RODDEDA Case (X-Y, Z=0)                     RODDEDA Case (Y-Z, X=0)

                c. Flux Distribution of Group 7 in             d. Flux Distribution of Group 7 in
                   RODDEDA Case (X-Y, Z=0)                        RODDEDA Case (Y-Z, X=0)

         Figure 澨.    Power Density Distribution and Flux Distribution of Group 7 Form X-Y and Y-Z Cro
                                            ss-Section in RODEDDA Case

                                                        7
EPJ Web of Conferences 247, 06023 (2021)                                           https://doi.org/10.1051/epjconf/202124706023
PHYSOR2020

                  a. Power Density Distribution in                    b. Power Density Distribution in
                      RODDEDB Case (X-Y, Z=0)                           RODDEDB Case (Y-Z, X=0)

                c. Flux Distribution of Group 7 in                   d. Flux Distribution of Group 7 in
                   RODDEDB Case (X-Y, Z=0)                              RODDEDB Case (Y-Z, X=0)

           Figure 5.    Power Density Distribution and Flux Distribution of Group 7 Form X-Y and Y-Z
                                          Cross-Section in RODDEDB Case

                                                  5. CONCLUSIONS

         The ENTER code was tested by simulating the C5G7 MOX benchmark. The pin power distribution,
         power density distribution and flux distribution were presented and discussed in Section. 4. The relative
         percent errors of the maximum pin power were lower than 3.20% and the relative percent errors of
         assembly power are lower than 1.69%. These results matched well when compared with the reference
         from the benchmark book and other deterministic code. The detailed high precision power density
         distribution and flux distribution were parented inside the core by many 2-D figures and these figures
         gave an intuitive performance of the power and flux changing in condition of different control rod

                                                            8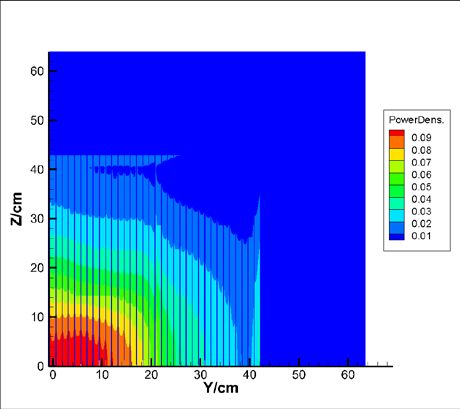
EPJ Web of Conferences 247, 06023 (2021)                                           https://doi.org/10.1051/epjconf/202124706023
PHYSOR2020

         positions. There was no doubt that the application of high fidelity meshes should be paid more attention
         on it to maintain the demanded calculation accuracy in a large scale reactor simulation.

         In conclusion, the ENTER code has the advantage of handling complex geometry problem with no
         approximations based on the high fidelity unstructured meshes. It means that the code can universally
         apply to various kinds of reactor. Secondly, all the calculations were operated on the supercomputer with
         1200 processes and the ENTER code was proved to have an excellent parallel operation capability. But
         there still remained some problems in this research. More research will be done to improve the ENTER
         code and to give more results explicitly.

                                                     REFERENCES

         1. Haibing Guo, Hongwen Huang, Jimin Ma, et.al, “Parallelization of the finite element SN neutron
         transport simulation based on domain decomposition,” Atomic Energy Science and Technology, 2020 (In
         Press, in Chinese)
         2. NEA, “Benchmark on Deterministic Transport Calculations Without Spatial Homogenization,”
         OECD. (2005):
         3. Seubert, A., W. Zwermann and S. Langenbuch, “Solution of the C5G7 3-D extension benchmark by
         the SN code TORT,” Progress in Nuclear Energy, 48(5), pp. 432-438. (2006).
         4. Dahl, J.A., “PARTISN results for the OECD/NEA 3-D extension C5G7 MOX benchmark,” Progress
         in Nuclear Energy, 48(5), pp. 401-409. (2006).
         5. Kim, H., C.Y. Han and J.K. Kim, “THREEDANT calculations for the 3-D extension C5G7 MOX
         benchmark,” Progress in Nuclear Energy, 48(5): pp. 424-431 (2006).
         6. Q. Liu, W. Zhao, J. Cheng, Z. Mo, A. Zhang and J. Liu, "A Programming Framework for Large
         Scale Numerical Simulations on Unstructured Mesh," 2016 IEEE 2nd International Conference on Big
         Data Security on Cloud (BigDataSecurity), IEEE International Conference on High Performance and
         Smart Computing (HPSC), and IEEE International Conference on Intelligent Data and Security (IDS),
         New York, 2016, pp. 310-315.
         7. Zhang, L., et al., “Calculation of the C5G7 3-D extension benchmark by ARES transport code,”
         Nuclear Engineering and Design, 318, pp. 231-238 (2017).
         8. Reda, S.M. and E.A. Amin, “Calculation of the NEA C5G7 MOX benchmark with MCNP5,”
         Progress in Nuclear Energy, 76, pp. 244-254 (2014).

                                                            9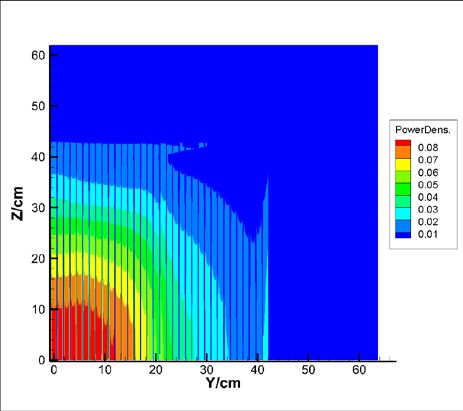
You can also read