Mechanisms of calcium metabolism in the dairy cow; relation to hypocalcemia .
←
→
Page content transcription
If your browser does not render page correctly, please read the page content below
2/14/2019

             Mechanisms of calcium
           metabolism in the dairy cow;
            relation to hypocalcemia .

                        Jesse P. Goff,
                     Iowa State University
                College of Veterinary Medicine,
                        Ames, IA USA

          Incidence of hypocalcemia in USA confinement herds
          3.0
          2.5
Ca (mM)

                    Normal
          2.0
              Sub-               25%          54%        53%
          1.5 clinical

          1.0 Milk Fever         0.7%         2%         5%

          0.5

           0
                0            1            2         ≥3
                                  Lactation #

                                                                      1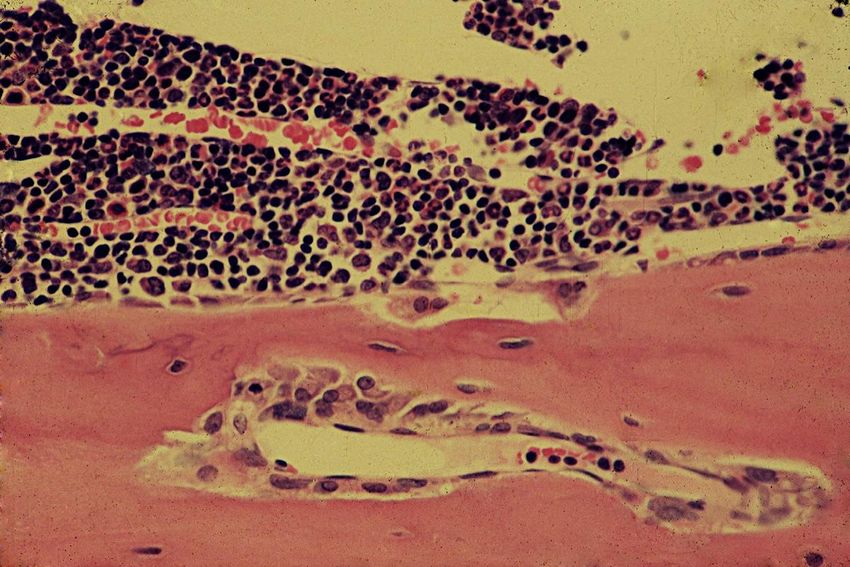
2/14/2019
Decreasing DMI Insufficient Vitamins, Trace High DCAD or
Minerals, or Anti-Oxidants
Around Calving Low Mg diets
Negative Energy +
Protein Balance Immune Suppression Hypocalcemia
Increasing NEFA Lost Muscle Tone
Lameness Mastitis
Ketosis/ Milk Fever
Fatty Liver
Retained
Fetal
Membranes
Rumen acidosis
and Metritis
Displaced Abomasum
Insufficient Dietary Effective Fiber
EFFECTS OF HYPOCALCEMIA AND MILK FEVER ON
DISEASE RESISTANCE
1. Reduced feed intake worsens negative energy
balance
2. Lack of muscle contraction
- impairs teat sphincter closure
- failure to expel contents of
uterus after calving
3. Reduction in Immune Cell Response to Stimuli
- Calcium is the “second messenger” of immune cells
2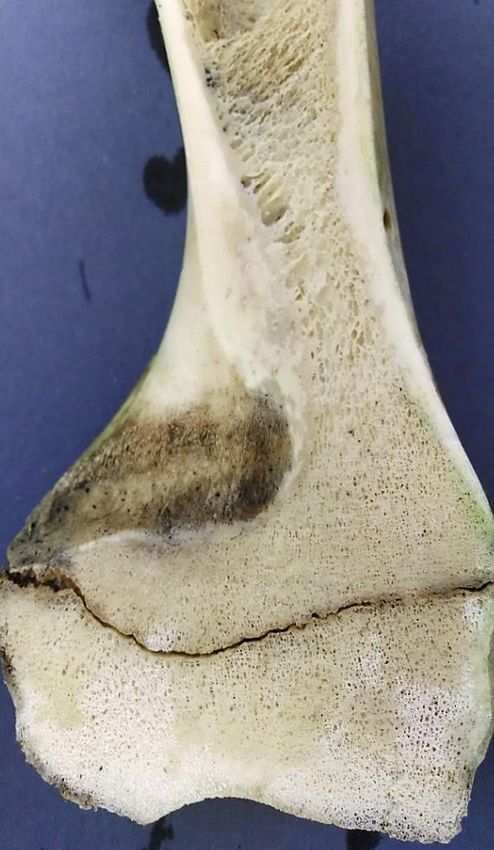
2/14/2019

               Normal Lymphocyte activation
Cytokine, antigen, or bacterial cell wall

                                         R

                      R                                    R

                R                         Ca++ Ca++            R
                                      Ca++          Ca++
                                               Ca++
                               Ca++      Ca ++
                                                 Ca++ ++
                                        Ca++        Ca
                                Endoplasmic
                      R         reticulum                  R

                                         R

               Normal Lymphocyte activation
Cytokine, antigen, or bacterial cell wall

                                         R

                      R                                    R

                R                         Ca++ Ca++            R
                                      Ca++        Ca++
                                             Ca++
                               Ca++      Ca++ Ca++
                                        Ca++      Ca++
                                Endoplasmic
                      R         reticulum                  R

                                         R

                                                                          3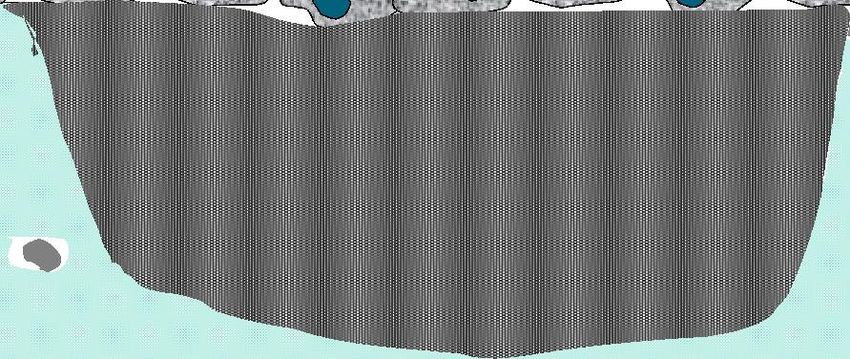
2/14/2019

               Normal Lymphocyte activation
Cytokine, antigen, or bacterial cell wall

                                         R

                      R                                    R

                            IP3
                R                         Ca++ Ca++            R
                                      Ca++          Ca++
                                               Ca++
                               Ca++      Ca ++
                                                 Ca++ ++
                                        Ca++        Ca
                                Endoplasmic
                      R         reticulum                  R

                                         R

               Normal Lymphocyte activation
Cytokine, antigen, or bacterial cell wall

                                         R

                      R                                    R

                            IP3
                R                         Ca++ Ca++            R
                                      Ca++        Ca++
                                             Ca++
                               Ca++      Ca++ Ca++
                                        Ca++      Ca++
                                Endoplasmic
                      R         reticulum                  R

                                         R

                                                                          4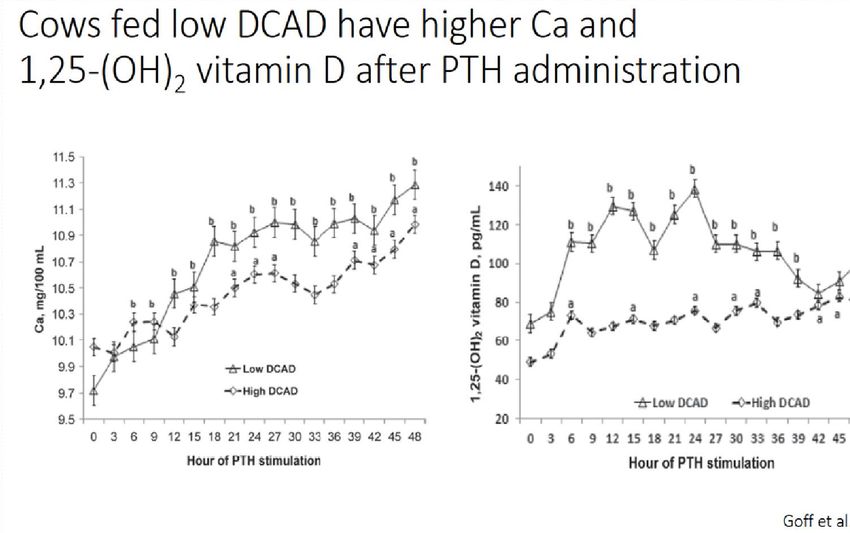
2/14/2019

               Normal Lymphocyte activation
Cytokine, antigen, or bacterial cell wall

                                         R

                      R                                            R
                                  Ca++ Ca++ Ca++
                                   Ca++    Ca++
                                                            Ca++
                R             IP3-R                                    R
                                                       ++
                                  Ca++       Ca++ Ca
                                             Ca++

                                Endoplasmic
                      R         reticulum                          R

                                         R

               Normal Lymphocyte activation
Cytokine, antigen, or bacterial cell wall

                                         R

                      R     Antibody, Antibacterial R
                            peptide production, etc.
                                  Ca++       Ca++
                                         Ca ++    Ca++
                                   Ca ++
                                             Ca++

                R                                                      R
                                                       ++
                                  Ca++       Ca++ Ca
                                             Ca++

                                Endoplasmic
                      R         reticulum                          R

                                         R

                                                                                  5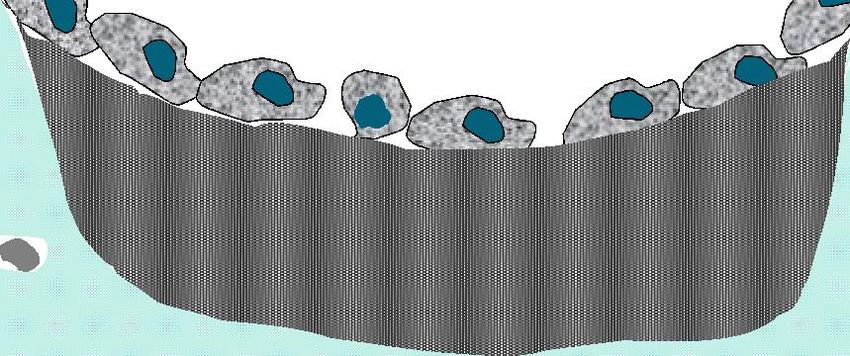
2/14/2019

          [Ca2+]i response to activation before and
                 after treatment of Milk Fever

   H2O2

                                               Pretreat (n=5)
                                               After Ca infusion (n=5)
    CD3

           0          1           2               3              4       5
                Fold increase inFluo-4/Fura red

                Lymphocyte activation during
                      Hypocalcemia
Cytokine, antigen, or bacterial cell wall

                                      R

                      R                                    R

                R                       Ca++                         R
                               Ca++
                                      Ca++        Ca++
                                Endoplasmic
                      R         reticulum                  R

                                      R

                                                                                    6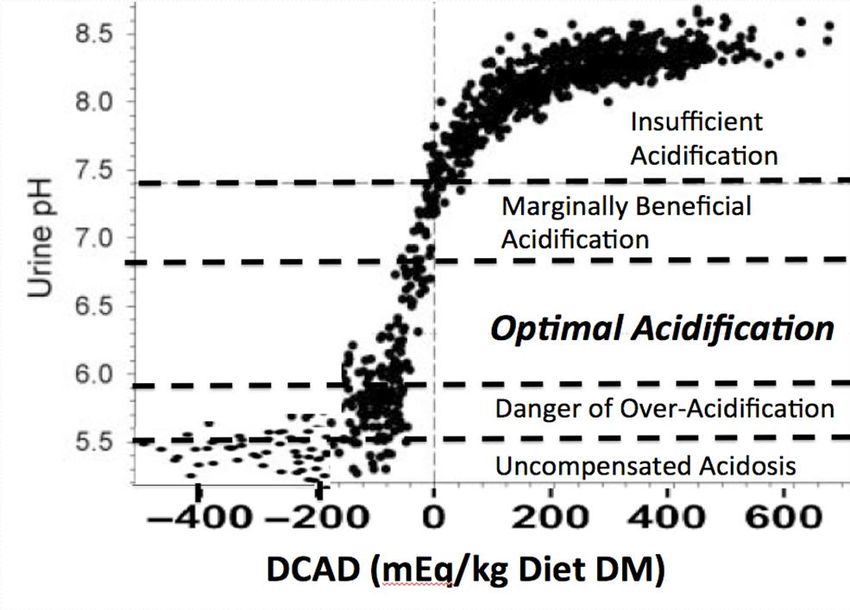
2/14/2019

                Lymphocyte activation during
                      Hypocalcemia
Cytokine, antigen, or bacterial cell wall

                                       R

                      R                                R

                 R                       Ca++              R
                                Ca++
                                       Ca++     Ca++
                                Endoplasmic
                      R         reticulum              R

                                       R

                Lymphocyte activation during
                      Hypocalcemia
Cytokine, antigen, or bacterial cell wall

                                       R

                      R                                R

                            IP3
                 R                       Ca++              R
                                Ca++
                                       Ca++     Ca++
                                Endoplasmic
                      R         reticulum              R

                                       R

                                                                      7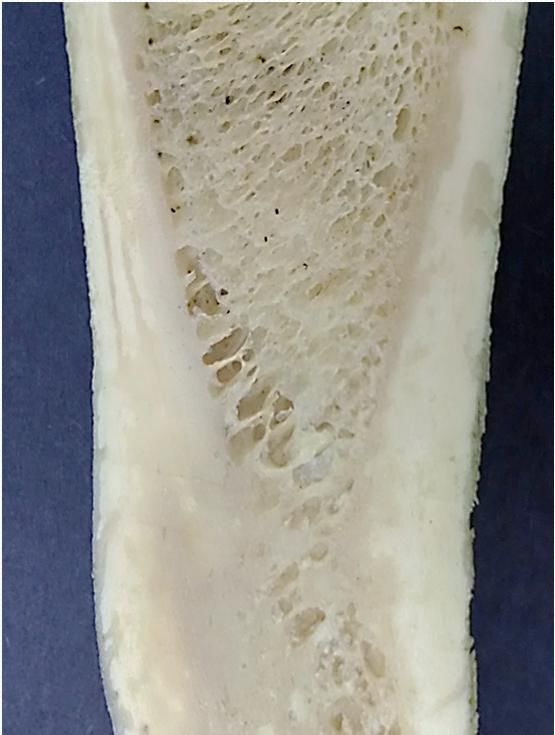
2/14/2019

                  Lymphocyte activation during
                        Hypocalcemia
Cytokine, antigen, or bacterial cell wall

                                           R

                        R                                      R

                              IP3
                  R                            Ca++                R
                                 Ca++
                                         Ca++           Ca++
                                  Endoplasmic
                        R         reticulum                    R

                                           R

                  Lymphocyte activation during
                        Hypocalcemia
Cytokine, antigen, or bacterial cell wall

                                           R

                        R                                      R

                                               Ca++
                                        Ca++

                  R             IP3-R                              R
                                                      Ca++
                                    Ca++

                                  Endoplasmic
                        R         reticulum                    R

                                           R

                                                                              8
2/14/2019

                Lymphocyte activation during
                      Hypocalcemia
Cytokine, antigen, or bacterial cell wall

                                         R

                      R     Antibody, Antibacterial R
                            peptide production, etc.

                                   Ca++
                                          X    Ca++

                 R                                              R
                                                       ++
                                  Ca++       Ca++ Ca
                                             Ca++

                                Endoplasmic
                      R         reticulum                   R

                                         R

        Ca Dynamics in the Periparturient Cow
   Late Gestation

   650 kg dairy cow needs to absorb:

   7-8 g Ca to support daily maintenance requirement
          = Endogenous fecal loss, urine loss

   9-10 g Ca to support fetal skeleton development.

   Total = 16-18 g Ca that must be restored to blood to maintain
   normal blood Ca concentrations

       Primarily met by absorbing dietary Ca!

                                                                           9
2/14/2019

        Ca Dynamics The Day of Calving

Maintenance – 7-8 g Ca

First Colostrum – 7.5 Kg X 2.3 g Ca / kg = 17.25 g Ca

   Within 45 min of colostrum removal- Ca uptake by
   mammary = ¾ of 17.25 = 10-12 g Ca

2nd milking removal at 12 hrs – mammary sequestered 11 g
Ca plus additional 3 g Ca (8.7 kg X 1.7 g Ca / kg= 14.8 g Ca)

   Within 45 min of second milk removal - Ca uptake by
   mammary for next milk is another 8- 10 g Ca.

Total Ca loss from blood between calving and 14 hrs after
calving can be 50 g Ca.

 Increase in Ca Demand the first half day after
 calving

 50 g Ca (post-calving ½ day) – 18 g Ca (precalving) =

 ~ 32 g Extra Ca that must be brought
 into blood to avoid hypocalcemia

                                                                      10
2/14/2019
Ca Homeostasis Begins With The Parathyroid Gland
Parathyroid cells have a Ca- Sensing G-Protein Coupled
receptor on their surface.
Lack of extracellular ionized Ca++ bound to the Ca-
Sensing receptor elicits Parathyroid Hormone Secretion
Parathyroid Hormone Targets
Kidney tubule cells
Bone osteocytes and osteoblasts
Salivary glands
Parathyroid Hormone
Kidney
25-OH vit D
Bone 1,25(OH)2D
Bone
~ 8 Kg Ca Fluid
Osteoclast ~9g Diet Ca = 45- 150 g
recruitment & Ca Passive Ca Active Ca
activation Transport Transport
Extracellular Ca Pool ~11 g
Serum Ca pool ~ 3.5 g
Lactation- 20-30 g
PTH
increase in Ca demand! Endogenous
Colostrum –2.3 g Ca/ L Urine Ca
Fecal Loss
Milk – 1.1 g Ca / L 0.2 g 5-8 g Ca
112/14/2019
Trabecular
A B
Figure 50.5
Parathyroid Hormone
Kidney
25-OH vit D
Bone 1,25(OH)2D
Bone
~ 8 Kg Ca Fluid
Osteoclast ~9g Diet Ca = 45- 150 g
recruitment & Ca Passive Ca Active Ca
activation Transport Transport
Extracellular Ca Pool ~11 g
Serum Ca pool ~ 3.5 g
Lactation- 20-30 g
PTH
increase in Ca demand! Endogenous
Colostrum –2.3 g Ca/ L Urine Ca
Fecal Loss
Milk – 1.1 g Ca / L 0.2 g 5-8 g Ca
122/14/2019
Osteocytic
Osteolysis
Ca within fluid
surrounding each
osteocyte and within
canaliculi is pumped
into blood under
control of PTH
Endosteal surface of a single spicule of trabecular bone in
the resting state. Note the small mircofracture within the
bone matrix.
132/14/2019
Activation – osteoblasts retract from the surface of the area
of bone to be remodeled. Osteoclasts move toward the site
of exposed bone.
Resorption – osteoclasts develop a ruffled border and form
a tight seal with the exposed bone. Secretion of acids and
enzymes causes dissolution of the organic matrix freeing
the minerals which enter extracellular fluid.
142/14/2019
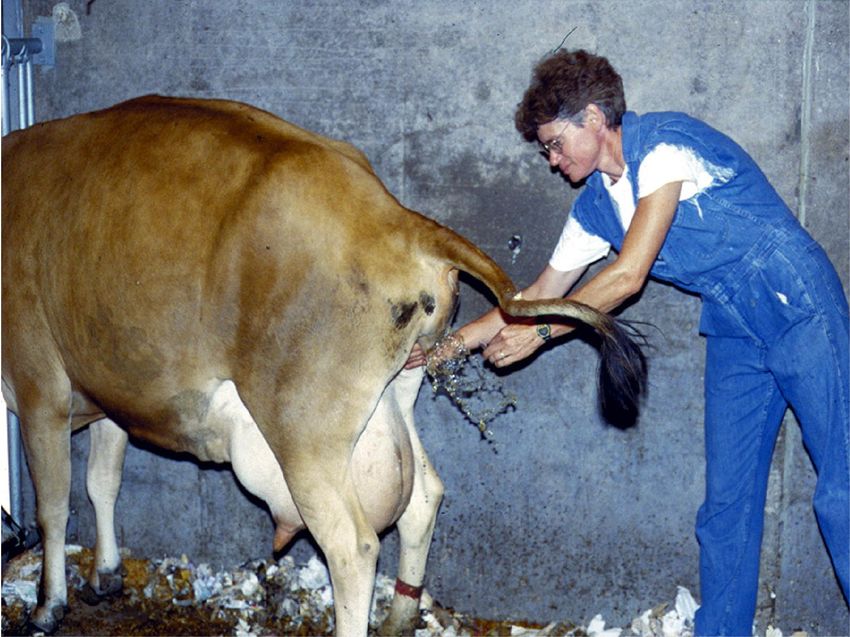
50 µ
Resorption – osteoclasts “scoop” out bone matrix
and mineral to a depth of approximately 50 .
Reversal – osteoclasts leave the area and become inactive. Osteoblasts
from among the endosteal bone lining cells at the edge of the resorption
site now enter the depths of the resorption cavity.
152/14/2019
Osteoblasts begin producing new bone matrix to fill in
the resorption cavity. Some become trapped within
the matrix to give rise to new osteocytes.
50 µ
The area of remodeled bone re-enters a resting state.
However there is now approximately 50 of new bone
formed to replace the microfracture with new bone.
162/14/2019
300 µ 200 µ
Normal Bone Remodeling – “Old” bone resorbed is replaced by New
172/14/2019
Lactational osteoporosis
The need for calcium to support lactation causes a “disconnect”
between the resorptive and reversal phases of the remodeling
process. Mediated by PTH and perhaps PTH-rP (beyond first week of
lactation?)!!
This occurs to some extent in all mammals even if diet calcium is
adequate. PTH-rP made by mammary gland!!
This resorbed bone is not replaced until some later point when
dietary calcium absorption is sufficient to sustain calcium
requirements of milk production, growth etc. About 5 weeks in a
cow. By that point 10-13% of skeletal Ca will have been removed.
The resorbed bone can be successfully replaced in late lactation!!?
Lactational
Osteoporosis
50 µ
Osteoclasts dig down 50 µ but osteoblasts
fail to replace matrix leaving 50 µ divots
182/14/2019
Lactational Osteoporosis
200 µ 100 µ
Lactational osteoporosis is reversible
300 µ 200 µ
Later when Ca balance is better or lactation ceases - bone resorbed is
replaced with New bone as improved Ca status triggers osteoblast activity
192/14/2019
Parathyroid Hormone
Kidney
25-OH vit D
Bone 1,25(OH)2D
Bone
~ 8 Kg Ca Fluid
Osteoclast ~9g Diet Ca = 45- 150 g
recruitment & Ca Passive Ca Active Ca
activation Transport Transport
Extracellular Ca Pool ~11 g
Serum Ca pool ~ 3.5 g
Lactation- 20-30 g
PTH
increase in Ca demand! Endogenous
Colostrum –2.3 g Ca/ L Urine Ca
Fecal Loss
Milk – 1.1 g Ca / L 0.2 g 5-8 g Ca
202/14/2019
Vitamin D-dependent Active Transport of Ca
Ca++ Ca++ Ca++
VDR
Ca++ 1,25-vitD
Vitamin D-dependent Active Transport of Ca
Ca++ Ca++ Ca++
VDR-1,25-vitD
VDR
Ca++ 1,25-vitD
212/14/2019
Vitamin D-dependent Active Transport of Ca
Ca++ Ca++ Ca++
TRPV6
CaBP
VDR-1,25-vitD
Ca-
ATPase
VDR-1,25-vitD
pump
Ca++
Vitamin D-dependent Active Transport of Ca
Ca++
Ca++ Ca++
TRPV6
Ca++
Ca++CaBP
Ca
ATPase
pump
Ca++
222/14/2019
Vitamin D-dependent Active Transport of Ca
Ca++ Ca++
TRPV6
Ca++-CaBP
Ca -
ATPase
Pump
Ca++
Vitamin D-dependent Active Transport of Ca
Ca++ Ca++
TRPV6
CaBP
Ca++
Ca -
ATPase
Pump
Ca++
Ca++
232/14/2019
Vitamin D-independent Passive Transport of Ca
++
Ionized Ca Ca++ Ca++Ca
Ca++ Ca++ Ca++
above 6 mM Ca++
Ca++
Vitamin D-independent Passive Transport of Ca ++
Ca++ Ca++++ Ca++Ca
Ca++ Ca
Ca++
Ca++
242/14/2019
Vitamin D-independent Passive Transport of Ca
Ca++
Ca++ Ca++ Ca++ Ca++
Ca++
Ca++
Ca++
Vitamin D-independent Passive Transport of Ca
Ca++ Ca++
Ca++
Ca++
Ca++
Ca++ Ca++ Ca++
252/14/2019 Ca Homeostasis – How long does it take to react? Kidney PTH promotes Ca reabsorption from tubular fluid within minutes (but normally brings
2/14/2019

Cows fed high DCAD diets become alkalotic and fail to respond
to PTH stimulation by increasing blood Ca and 1,25-(OH)2 Vit D
production. THIS CAUSES SEVERE HYPOCALCEMIA

  A. pH=7.35            B. pH=7.45        C. pH=7.35
  Normal Mg             Normal Mg         Hypomagnesemia

     PTH                      PTH             PTH

                             Receptor
     ++ Receptor        ++                      Receptor
Mg                 Mg
      Adenyl             Adenyl                Adenyl
      cyclase            cyclase               cyclase
      complex            complex               complex

     Cyclic AMP       Cyclic AMP            Cyclic AMP

                                                                       27
2/14/2019
Acid-Base Physiology & Strong Ions
All solutions must be electrically neutral ., ie.
The number of + charges in a solution must
equal the number of - charges in a solution.
Neutral solutions have an equal number of H+ and
OH- particles in them. This results in a pH of 7.0
If K+ ions are added to the solution it necessitates a
loss of H+ ions and a simultaneous increase in OH-
in the solution to achieve electroneutrality.
The pH increases.
Diet Cation-Anion Difference (DCAD) &
Acid-Base Status
Diet Cations (Na+, K+, Ca++, Mg++, NH4+)
absorbed into the blood will alkalinize the
blood
Diet Anions (Cl- , SO4-- , PO4--) absorbed into
the blood will acidify the blood.
282/14/2019
NaCl has equal numbers of + and - charges
Both Na+ and the Cl- are absorbed into the blood with nearly
100% efficiency.
The blood gains an equal number of + and - charges.
NO CHANGE in Electrical charge = NO CHANGE in pH!!!
Ca Cl2 also has an equal number of + and –
charges
The Cl- is absorbed with nearly 100% efficiency into the blood.
Less than 20% of the Ca in the salt is absorbed into the blood.
More – charges enter the blood than do + charges.
The blood becomes more negative necessitating
a rise in H+ = lower pH = More acidic blood
Milk Fever Prevention Strategies
1. Avoid high potassium forages for
close-up cows so cows are less
alkaline
2. Add anions (Cl or Sulfate) to diet to
reduce blood (and urine) pH.
3. Diet Mg = 0.4% must be available to cow
292/14/2019
Milk Fever Prevention Strategies
1. Avoid high potassium forages for
close-up cows so cows are less
alkaline
2. Add anions (Cl or Sulfate) to diet to
reduce blood (and urine) pH.
3. Diet Mg = 0.4% must be available to cow
2 Eq of each anion source fed
8.5
8.0
Urine pH
Elemental Sulfur
7.5
water
Mg sulfate
Ca sulfate
NH4 chloride
7.0
H2SO4
Ca chloride
6.5
HCl
6.0
5.5
302/14/2019
Parathyroid Hormone
Kidney
25-OH vit D
Bone 1,25(OH)2D
Bone
~ 8 Kg Ca Fluid
Osteoclast ~9- Diet Ca = 45- 150 g**
recruitment & 15 g Passive Ca Active Ca
activation Ca * Transport Transport
Extracellular Ca Pool ~11 g
Serum Ca pool ~ 3.5 g
Lactation- 20-30 g Ca
PTH
Endogenous
Colostrum –2.3 g Ca/ L Urine Ca
Fecal Loss
Milk – 1.1 g Ca / L 0.2 - 6 g * 5-8 g Ca
DCAD Equations
Most Commonly Used Equation
(mEq Na + mEq K) – (mEq Cl + mEq S)
Corrected for lower sulfate absorption
(mEq Na + mEq K) – (mEq Cl + 0.6 mEq S)
312/14/2019
Minerals/DCAD for Close-up Diets
Phos at .30-.35% , or lower???
Mg at .4% to use passive absorption!!
S between .22 and .4%
Ca at .85-1.3% ??
Na at .1-.12%
K as close to 1% as possible
Enough Chloride to urine pH.
Blood
Phosphorus
1,25-(OH)2Vitamin D
Bone
Kidney
FGF-23
FGF-23
Kidney
Bone
1,25-(OH)2Vitamin D
Blood
Phosphorus
322/14/2019
Minerals/DCAD for Close-up Diets
Phos at .30-.35%
Mg at .4% to use passive absorption!!
S between .22 and .4%
Ca at .85-1.3% ??
Na at .1-.12%
K as close to 1% as possible
Enough Chloride to urine pH.
HOW MUCH Chloride do I add to the diet?
Enough to bring urine pH between 6.2 and 6.8
the week before calving. (Jersey target= 5.8-6.2)
When urine pH is below 5.3 in the cows
you may have caused an uncompensated
metabolic acidosis = trouble!!!!!
Thumbrule To Get Started with Anions
% Chloride needed = % K - 0.5
Example -If diet K is 1.3% then bring diet to 0.8
% Cl and check urine pH to fine tune diet
332/14/2019
Adapted from Constable et al., 2017 and Charbonneau et al., 2006
342/14/2019
Magnesium
Adult Ruminants absorb Mg across rumen wall ! Mg
insoluble at rumen pH is NOT available.
- Active transport process efficient with low diet Mg
BUT EASILY POISONED BY DIET K AND NITROGEN
- Second passive transport system exists, but requires
high concentration of ionized Mg in rumen fluid to
work
Keep diet Mg at 0.4% prepartum and early post-
partum to take advantage of passive transport of Mg
across rumen wall
MAKE SURE Mg Source is AVAILABLE to the
cow. Finely ground, not overly calcined!
Magnesium sources
Pre-calving
- using MgSO4 or MgCl2 as “anions” also supplies readily
available, soluble Mg.
-The better anion supplements on the market include Mg
in this form to remove Mg worries pre-calving.
Post-calving
Magnesium Oxide – supply Mg and act as rumen
alkalinizer.
* my experience; Low Mg = primary cause of mid-
lactation milk fevers
352/14/2019
Testing Magnesium Oxide Availability
Weigh out 3 g MgO into large vessel.
Add 40 ml of 5% acetic acid (white vinegar) slowly!!
Cap container and shake well, shake again at 15
min. Check the pH at 30 min mark.
Vinegar will be pH 2.6-2.8!
The best MgO will bring the pH up to 8.2.
The worst to just 3.8.
pH is a log scale so this represents >10,000 fold
difference in buffering action.
Lean, et al 2014 Meta-Analysis
Studies contrasted use of anion supplements
vs controls. Anions had to be fed at least 21
days pre-calving for inclusion in study.
Utilized 15 published studies with 34 diet
comparisons.
Cows fed anions produced an average of 1.13
kg more Fat corrected milk / day for first 65
days in milk ( or 73 kg 1st 65 days).
362/14/2019
Anions cost $12 to $22 / cow
Milk price = 0.33 USD/ liter X 73 kg in 65 days = 24.11
USD
Over whole lactation – use 318 kg figure (Beede)
0.33 dollars/ L X 318 kg in 305 days = 104.94 USD
Relative risk Milk Fever has on other Disease
Development in that lactation (Curtis et al 1985)
Ketosis – 23 fold increased risk (16 fold for RP)
All Mastitis – 5 fold increased risk
Coliform Mastitis - 11 fold increased risk
Retained Placenta – 4 fold increased risk
Reduced retained placenta, improved uterine
health, less displaced abomasum, less mastitis?
How many $$$$$????
37You can also read