Ex vivo vibro-acoustography characterization of osteoporosis in an experimental mice model
←
→
Page content transcription
If your browser does not render page correctly, please read the page content below
Original Article

Ex vivo vibro-acoustography characterization of osteoporosis in
an experimental mice model
Paulo Moraes Agnollitto1,2^, Guilherme de Araújo Braz3^, Adriano Levi Spirlandeli1,
Francisco José Albuquerque de Paula1^, Antonio Adilton Oliveira Carneiro3^, Marcello Henrique Nogueira-Barbosa1,2^
1
    Ribeirão Preto Medical School, University of São Paulo, Ribeirão Preto, SP, Brazil; 2Ribeirão Preto Medical School Musculoskeletal Imaging
Research Laboratory, Ribeirão Preto, SP, Brazil; 3Physics Department, Faculdade de Filosofia, Ciências e Letras de Ribeirão Preto, University of São
Paulo, Ribeirão Preto, SP, Brazil

Correspondence to: Paulo Moraes Agnollitto, MD. Ribeirão Preto Medical School, University of São Paulo, Av. Bandeirantes, 3900, Ribeirão Preto, SP,
CEP 14048-900, Brazil. Email: pmagnollitto@alumni.usp.br.

                  Background: Osteoporosis is a highly prevalent multifactorial osteometabolic disease, classically diagnosed,
                  in vivo, by dual energy X-ray absorptiometry (DXA). This study evaluated osteoporosis, ex vivo, using vibro-
                  acoustography (VA), an elastographic technique based on ultrasound radiation force.
                  Methods: Three groups of mice femurs were used: (I) control group (CG), (II) osteoporosis group (OG)
                  and (III) treated osteoporosis group (TOG), in which the animals received pamidronate, an antiresorptive
                  drug. Evaluation was performed in an acoustic tank, using two high frequency focused beams produced by a
                  confocal ultrasonic transducer. A hydrophone registered the low frequency acoustic response (AR) of bone
                  samples. We used micro-computed tomography (microCT) as the reference standard and evaluated the
                  correlation between VA and microCT parameters.
                  Results: The spectral analyses of the ARs with estimated area under the curve (AUC) values (mean; st. dev.)
                  were, respectively, 1.29e–07 and 9.32e–08 for the CG, 3.25e–08 and 2.16e–08 for the OG, and 1.50e–07 and 8.37e–08
                  for the TOG. VA differentiated the experimental groups (P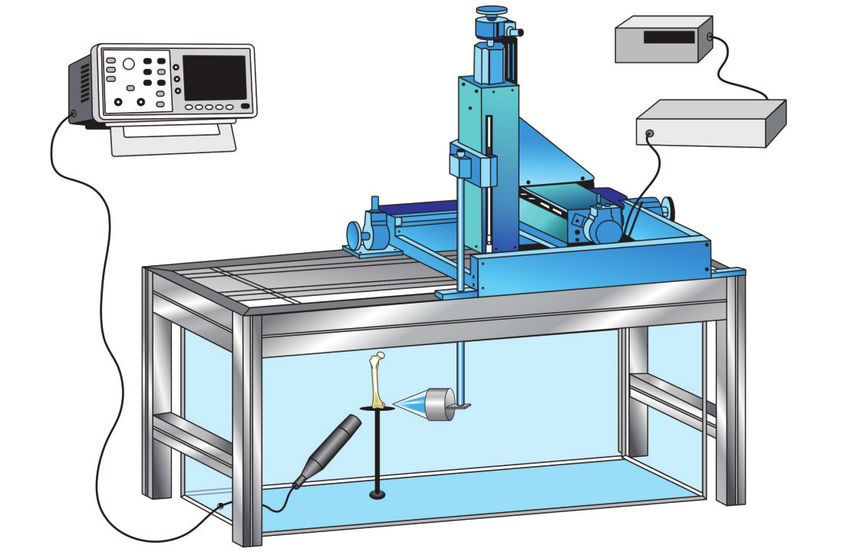
Quantitative Imaging in Medicine and Surgery, Vol 11, No 2 February 2021                                                                            587

therefore a comprehensive ultrasound evaluation of bone                     susceptibility to fracture based only on low bone mass,
tissue encounters significant limitations because of the high               but fragility fractures may occur in subjects showing a
acoustic impedance of cortical bone, which prevents the                     large spectrum of BMD values, including individuals with
propagation of ultrasound waves (4-6). Nevertheless, several                BMD within normal values. Alternatively, several methods
papers have introduced and highlighted the usefulness                       are available to evaluate detailed characteristics of the
of conventional ultrasound techniques to assess bone                        bone microarchitecture, but they are either invasive and
abnormalities, mainly by addressing the study of its surface                time-consuming (bone histomorphometry) or expensive
(7-11) or by emphasizing the evaluation of epiphyseal or                    and involve X-ray radiation (high resolution peripheral
apophyseal cartilaginous tissues in the pediatric population                computed tomography).
(12,13). In addition, recent developments in ultrasound                        Micro-computed tomography (microCT), on the other
imaging technologies, such as elastography, are changing                    hand, is the gold standard for measurement and visualization
this scenario.                                                              of bone structure in vitro and in preclinical animal studies.
    Elastography is an imaging modality that can be used                    It allows visualization of the three-dimensional (3D) nature
for medical purposes, as it can measure tissue’s elastic                    of the bone structure and also highly accurate quantification
parameters (“stiffness”), resembling manual palpation,                      of bone structural parameters. The most important
with the advantage of being a quantitative method (14,15).                  microCT parameters are bone volume fraction (BV/TV),
There are numerous elastographic techniques, mainly                         trabecular thickness (Tb. Th), trabecular separation (Tb.
differing in how the target is excited and/or how the                       Sp), trabecular number (Tb. N), connectivity (Conn.) and
response is acquired. Some of these techniques are in                       connectivity density (Conn. D) for cancellous bone, and
developmental stages and others have already reached                        cortical bone volume and thickness for cortical bone (32).
clinical practice (16-21). Some elastographic techniques                    Conn. is a 3D property that describes the various
are based on ultrasound radiation force interacting with                    connections between the so-called nodes (the structural
a target and producing low frequencies vibrations, called                   units that represent the confluence of three or more
acoustic response (AR), which carries mechanical properties                 trabeculae) and the connecting segments. Conn. is an index
of the target. Fatemi and Greenleaf proposed one such                       developed to characterize the redundancy of trabecular
technique: vibro-acoustography (VA) (22,23). The VA                         connections, and it is derived from the Euler number (33),
technique consists of focusing two acoustic primary beams                   which is a fundamental topologic measure counting the
emitted at close frequencies, which creates a localized low                 number of objects, the number of marrow cavities fully
frequency radiation beam on the studied object and using a                  surrounded by bone, and the number of connections that
hydrophone to register the low frequency acoustic emissions.                must be broken to split the structure in two parts. Because
Silva and Mitri demonstrated that, in VA, in addition to                    it depends on structure size, it can also be expressed as
the radiation force, the two beams interact nonlinearly,                    density (Conn. D), when divided by the total volume (34,35).
giving rise to harmonics of the primary waves (24).                         MicroCT has a limited role for in vivo studies due to the
Due to the interaction of focused and modulated beams, VA is                small field of view and high dose of radiation (36).
very sensitive to morphology and internal structure of the target.             The goal of our study was to assess the diagnostic
    Osteoporosis is a highly prevalent multifactorial                       potential of VA in osteoporosis and for this purpose, we
osteometabolic disease, characterized by a reduction in bone                have evaluated bone tissue ex vivo using microCT as the
mass and associated with changes in bone microarchitecture                  reference standard.
(25-27). The most important consequence of osteoporosis
is a reduction in the mechanical strength of bones, which
                                                                            Methods
increases the risk of fractures. Since 1994, the World Health
Organization (WHO) has defined the operational diagnosis                    This study was conducted using mice femurs obtained from a
of osteoporosis based on the measurement of bone mineral                    previous experimental study conducted in our laboratory (37)
density (BMD) (28-30). Dual energy X-ray absorptiometry                     and approved by the Institutional Animal Care and
(DXA) is the gold standard method for BMD measurement                       Use Committee of the Ribeirão Preto Medical School,
in vivo (31). The DXA methodology consists of estimating                    University of São Paulo (protocol no. 111/2011). New
the attenuation of two X-ray beams (with high and low                       committee approval was waived because no new experiment
energy) in bones and soft tissues. DXA predicts the                         with animals was necessary.

© Quantitative Imaging in Medicine and Surgery. All rights reserved.   Quant Imaging Med Surg 2021;11(2):586-596 | http://dx.doi.org/10.21037/qims-20-610
588 Agnollitto et al. Ex vivo VA characterization of osteoporosis
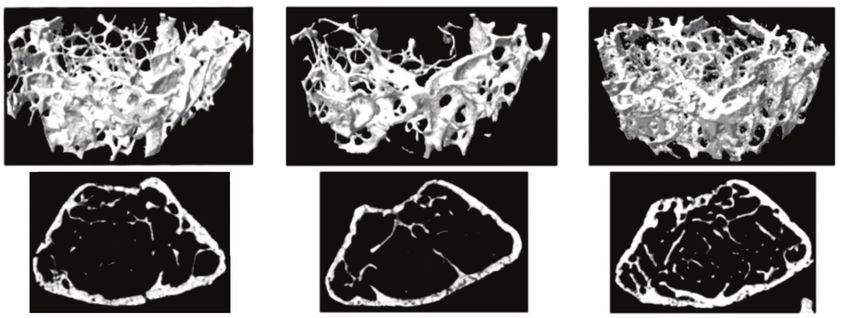
Function generator
Amplifier
Oscilloscope Positioning
system
Target
Confocal
transducer
Hydrophone
Figure 1 Experimental setup in the acoustic tank for the VA technique is shown. VA, vibro-acoustography.
Study design and animals 0.9% NaCl at 1.25 mg/kg at the end of the fourth week.
Mortality rate was 25% in the groups of mice receiving
The study design included femurs from three groups
the intraperitoneal injection of CCl4, and this rate was not
of mice: (I) a control group (CG), with six specimens,
influenced by the additional administration of pamidronate.
(II) a group with induced osteoporosis (OG), with six
At the end of the tenth week, the mice were euthanized by
specimens submitted to intraperitoneal injections of carbon
cervical dislocation, following the guidelines of the local
tetrachloride (CCl4-Sigma-Aldrich, Saint Louis, Missouri,
Institutional Animal Care and Use Committee.
United States) and (III) a group with induced osteoporosis
treated with pamidronate (TOG), with five specimens
submitted to intraperitoneal injections of CCl4 followed by Experiments and VA
treatment with pamidronate (Eurofarma, Ribeirão Preto,
SP, Brazil), an antiresorptive drug. The experiments with VA were conducted in an acoustic
Five-week-old male mice weighing approximately 18 g tank with degassed water under controlled temperature
were used in our experiments. The animals were housed in (23 ℃) (Figure 1). In the VA technique, performed in the
cages in a room with controlled humidity and temperature tone burst mode, a confocal ultrasonic transducer (two
(23±1 ℃) conditions and with an artificial light/dark cycle piezoelectric elements; focus of 5 cm; lateral resolution
of 12 hours (lights on: 06:00 am–06:00 pm). The animals of 0.7 mm and focal zone of 1 cm) generates two high
had free access to tap water and pellet chow. To induce frequency (3.200 and 3.265 MHz) focused beams, with
hepatic osteodystrophy (HO), which was our model of a frequency difference of 65 kHz between them (beating
induced osteoporosis, the mice were treated with CCl 4 frequency). The transducer crystals were excited by
(1 mL/kg body weight) dissolved in olive oil 1:4 (v:v) function generators (Model 33220A, Keysight, Santa Rosa,
administered via intraperitoneal injection twice per week, California, United States). The two beams interact with
as adapted from previous studies in this line of investigation each other at focus on the bone sample, producing a low
(38,39). At the end of the 8-week period of CCl4 injections, frequency AR that is registered by a hydrophone (Model
a 2-week interval was allowed for the consolidation of ITC-6050C, International Transducer Corporation, Santa
hepatic disease. Mice in the TOG group were then treated Barbara, California, United States) (Figure 2). The AR
with an intraperitoneal injection pamidronate dissolved in signals were windowed and processed with the fast Fourier
© Quantitative Imaging in Medicine and Surgery. All rights reserved. Quant Imaging Med Surg 2021;11(2):586-596 | http://dx.doi.org/10.21037/qims-20-610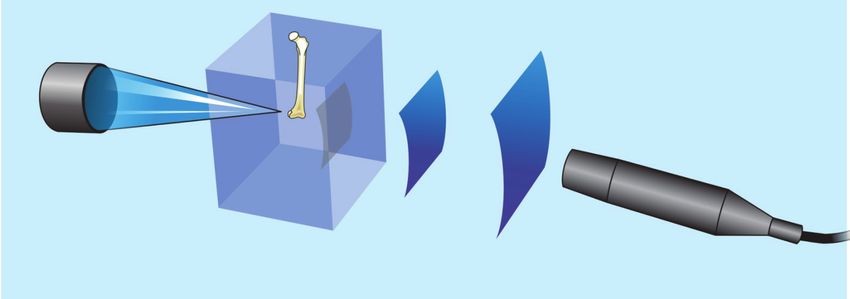
Quantitative Imaging in Medicine and Surgery, Vol 11, No 2 February 2021                                                                                          589

                                                                                                Acoustic response

                                                               Target

                                     Confocal
                                    transducer

                                                           Object
                                                                                                                 Hydrophone

Figure 2 A schematic illustration of the AR being captured by the hydrophone is shown. AR, acoustic response.

                     ×10−7                                                                   These parameters were determined in the distal portion
               1.2                                                       CG
                                                                         OG
                                                                         TOG              of the femurs, starting 0.25 mm proximal to the distal
                1
                                                                                          growth plate and covering a total length of 1 mm. Cortical
               0.8                                                                        bone was manually excluded, separating only the trabecular
|Y (f)| a.u.

                                                                                          bone, since osteoporosis affects primarily this region of
               0.6
                                                                                          the bone in the early stages of the disease (41). The bones
               0.4                                                                        were scanned with an energy level of 55 kVp, tube current
                                                                                          of 145 mA and a voxel of 5.0 μm3 (32,36). The equipment
               0.2
                                                                                          underwent a weekly programmed calibration, with phantoms
                0
                 0       10   20   30   40    50    60    70   80       90     100
                                                                                          presenting with densities of 0.25 and 0.75 mg/cm 3 .
                                        Frequency (kHz)                                   CT-analyzer software (version 1.13.2.1) was used for the
Figure 3 VA spectral curves representing the experimental                                 quantitative assessment and CTVol (version 2.2.3.0) and
groups: CG (black line), OG (red line) and TOG (blue line) is                             Dataview (version 1.4.4.0) software were used to reconstruct
shown. |Y(f)| represents the module of the fast Fourier Transform                         images of the bones. The results are expressed according to
of the acoustic signals multiplicated by its complex conjugate,                           the standard nomenclature (36).
expressed in a.u. VA, vibro-acoustography; CG, control group;
OG, osteoporosis group; TOG, treated osteoporosis group; a.u.,                            Statistical analysis
arbitrary units.
                                                                                          The results obtained for the three groups were compared
                                                                                          using ANOVA followed by Tukey’s post-hoc test. The
transform (Figure 3). In order to obtain numerical values                                 reproducibility of the experiments was assessed using the
carrying information about the mechanical properties of the                               interclass correlation coefficient (ICC), and Spearman’s
samples, the area under the curve (AUC) was estimated in                                  coefficient was used to determine the correlation between
an interval centered at 65 kHz with a width of 5 kHz (VA-                                 two parameters. The statistical analysis was performed
AUC). The experiments were repeated three times in order                                  using SAS (version 9.2; SAS, Cary, North Carolina; United
to test reproducibility.                                                                  States) and R (version 3.4.1; The R Project for Statistical
                                                                                          Computing; General Public License) software. A P value
                                                                                          less than 0.05 was considered statistically significant.
MicroCT

Mice femurs were scanned using a microCT instrument                                       Results
(Model 1172, SkyScan, Kontich, Antwerp, Belgium). The
                                                                                          VA spectral analysis and group differentiation
morphometric parameters selected for the analysis of bone
microarchitecture are described in Table 1. All the parameters                            The VA spectral analysis of the mean of each group is
were named according to the Parfitt’s system (40).                                        shown in Figure 3, while numerical values of VA-AUC, are

© Quantitative Imaging in Medicine and Surgery. All rights reserved.                 Quant Imaging Med Surg 2021;11(2):586-596 | http://dx.doi.org/10.21037/qims-20-610
590 Agnollitto et al. Ex vivo VA characterization of osteoporosis
Table 1 Definition and description of trabecular bone microarchitecture according to Parfitt et al. 1987
Abbreviations Variables Description Unit
BV/TV Bone volume fraction Ratio of segmented bone volume to total volume of the region of interest %
Tb. Th Trabecular thickness Mean thickness of trabeculae, assessed using direct 3D methods mm
Tb. N Trabecular number Average number of trabeculae per unit length 1/mm
Tb. Sp Trabecular separation Mean distance between trabeculae assessed using direct 3D methods mm
Conn. D Connectivity density A measure of the degree of connectivity of trabeculae normalized by TV (total 1/mm3
volume of the region of interest)
Table 2 Numerical results for the VA-AUC
Group N Mean St. dev.
–07
CG 6 1.29e 9.32e–08
OG 6 3.25e–08 2.16e–08
TOG 5 1.50e–07 8.37e–08
VA-AUC, vibro-acoustography area under the curve estimation; CG, control group; OG, osteoporosis group; TOG, treated osteoporosis
group.
3.0e-07
MicroCT
Vibro-acoustography signal (a.u.)
MicroCT assessment of the three experimental groups
2.5e-07
are depicted in Table 3, and 3D render volumetric
2.0e-07 reconstructions of the trabecular anatomy, associated with
corresponding axial slice of a specimen of each experimental
1.5e-07 group are shown in Figure 5.
1.0e-07
Correlation between VA measurements and microCT
5.0e-08 parameters
CG OG TOG The VA/microCT correlations are listed in Table 4. There
Group
was a strong correlation between VA and microCT Conn.
(r=0.80; PQuantitative Imaging in Medicine and Surgery, Vol 11, No 2 February 2021 591
Table 3 MicroCT parameters
CG OG TOG
Parameters
Mean St. dev. Mean St. dev. Mean St. dev.
BV/TV (%) 11.961 3.47 10.398 3.53 12.886 4.44
Tb. Th (mm) 0.054 0.009 0.052 0.006 0.047 0.005
Tb. N (1/mm) 2.287 0.28 1.679 0.14 2.532 0.70
Tb. Sp (mm) 0.174 0.02 0.222 0.03 0.103 0.01
Conn. 598.00 175.11 358.00 136.54 3,086.83 1,109.78
3
Conn. D (1/mm ) 264.84 79.13 172.66 51.50 1,452.19 504.83
MicroCT, micro-computed tomography; CG, control group; OG, osteoporosis group; TOG, treated osteoporosis group; BV/TV, bone
volume fraction; Tb. Th, trabecular thickness; Tb. N, trabecular number; Tb. Sp, trabecular separation; Conn., connectivity; Conn. D,
connectivity density.
A CG OG TOG
B
Figure 5 Representative microCT images of each experimental group. (A) Reconstructions with volume rendering showing the
tridimensional microstructure of trabecular bone; (B) axial sections of the distal portion of the femurs. microCT, micro-computed
tomography; CG, control group; OG, osteoporosis group; TOG, treated osteoporosis group.
Table 4 Correlations between VA-AUC and microCT parameters
Parameters Spearman’s coefficient (r) P value
BV/TV (%) 0.19 0.47
Tb. Th (mm) –0.34 0.20
Tb. N (1/mm) 0.52 0.06
Tb. Sp (mm) –0.49 0.06
Conn. 0.80592 Agnollitto et al. Ex vivo VA characterization of osteoporosis
A Grupos B Grupos
CG OG TOG 2000 CG OG TOG
4000
Connectivity Density
1500
3000
Connectivity
1000
2000
1000 500
0 0
5.0e-08 1.0e-07 1.5e-07 2.0e-07 2.5e-07 3.0e-07 5.0e-08 1.0e-07 1.5e-07 2.0e-07 2.5e-07 3.0e-07
Vibro-acoustography signal (a.u.) Vibro-acoustography signal (a.u.)
Figure 6 Scatter plots showing statistically significant correlations between VA-AUC and microCT in (A) Conn. (r=0.80; PQuantitative Imaging in Medicine and Surgery, Vol 11, No 2 February 2021 593
understood (48). Some studies have shown that decreased assessments. These results encourage further studies aimed
bone formation is the predominant mechanism (47), at evaluating the potential use of VA for the diagnosis of
while others point to increased bone resorption as the main osteoporosis as a relatively low-cost and radiation-free
cause of bone loss (49). Bilateral oophorectomy, spinal alternative to DXA.
cord lesion, immobilization and dietary manipulation are
the most common methods used to induce experimental
Acknowledgments
osteoporosis (50-56). While we did not use the most
common models of experimental osteoporosis described in We thank Agnelo dos Santos Bastos Neto for his technical
the literature, our trabecular bone loss was equivalent to support and Carolina de Freitas Lins, Estela Carneseca and
these classical models, as depicted by our microCT results, Guilherme Zeri for their support in the preparation of this
that showed severe bone loss in the OG. manuscript.
Quantitative ultrasonometry (QUS) is another ultrasound Funding: This study was financed in part by the
technique used to evaluate bone tissue, based on velocity Coordenação de Aperfeiçoamento de Pessoal de Nível
and amplitude attenuation of ultrasound waves (57-59). Superior – Brasil (CAPES) – Finance Code 001. The
QUS is not used to obtain images, but to measure and authors also acknowledge the following funding sources:
assess tissue properties (60). This modality may be used to Conselho Nacional de Desenvolvimento Científico e
evaluate osteoporosis (61,62) and fracture healing (63-65). Tecnológico – CNPq (grant 305610/2017-1), Finep (grant
QUS is a low-cost technique that has been applied at different 2210/2008) and FAEPA (grant 819/2019).
anatomical sites, but according to the International Society
for Clinical Densitometry (ISCD) official guideline (66)
Footnote
the only validated skeletal site is the calcaneus.
The VA technique has already been used to evaluate bone Conflicts of Interest: All authors have completed the ICMJE
tissue (45,67-69), however most of these studies focused on uniform disclosure form (available at http://dx.doi.
qualitative aspects of bone tissue. In contrast, our study is org/10.21037/qims-20-610). MHNB serves as an unpaid
the first successful attempt to show quantitative correlations editorial board member of Quantitative Imaging in Medicine
between VA and microCT parameters, which is the gold and Surgery. The other authors have no conflicts of interest
standard for assessment and quantification of bone structure to declare.
in experimental studies. Recently, Ghavami et al. (70) used
VA to discriminate normal and osteoporotic bone in vivo in Ethical Statement: This study was approved by the
humans, illustrating the potential of this technique to reach Institutional Animal Care and Use Committee of the
clinical practice and to become an alternative diagnostic test Ribeirão Preto Medical School, University of São Paulo.
to DXA, in the context of osteoporosis.
Our study has some noteworthy limitations. Firstly, Open Access Statement: This is an Open Access article
we have tested a relatively limited number of specimens. distributed in accordance with the Creative Commons
In addition, the current setup is not suitable for clinical Attribution-NonCommercial-NoDerivs 4.0 International
use. Furthermore, to the present moment, there is not a License (CC BY-NC-ND 4.0), which permits the non-
complete physical understanding of the VA interaction with commercial replication and distribution of the article with
bone tissue, and therefore, there is no certainty about what the strict proviso that no changes or edits are made and the
is really being measured, though it is probably related to original work is properly cited (including links to both the
the internal structure of the bone. Our group is working in formal publication through the relevant DOI and the license).
physical models to better understand these phenomenons. See: https://creativecommons.org/licenses/by-nc-nd/4.0/.
Nevertheless, our preliminary results encourage further
research and development to investigate the possible use of
References
VA in vivo for the diagnosis of osteoporosis.
Our results show that VA can detect bone impairment in 1. Özkaya N, Leger D, Goldsheyder D, Nordin M.
mice femurs with induced osteoporosis and might be useful Mechanical properties of biological tissues. In: Özkaya
to monitor post-treatment improvement of bone tissue. A N, Leger D, Goldsheyder D, Nordin M. Fundamentals
positive correlation was observed between VA and microCT of biomechanics: equilibrium, motion, and deformation.
© Quantitative Imaging in Medicine and Surgery. All rights reserved. Quant Imaging Med Surg 2021;11(2):586-596 | http://dx.doi.org/10.21037/qims-20-610594 Agnollitto et al. Ex vivo VA characterization of osteoporosis
Cham: Springer International Publishing, 2017:361-87. Biol 2011;56:R1-29.
2. Saraf H, Ramesh KT, Lennon AM, Merkle AC, Roberts 16. Almeida TWJ, Sampaio DRT, Bruno AC, Pavan TZ,
JC. Mechanical properties of soft human tissues under Carneiro AAO. Comparison between shear wave
dynamic loading. J Biomech 2007;40:1960-7. dispersion magneto motive ultrasound and transient
3. Cho KH, Lee YH, Lee SM, Shahid MU, Suh KJ, Choi elastography for measuring tissue-mimicking phantom
JH. Sonography of bone and bone-related diseases of the viscoelasticity. IEEE Trans Ultrason Ferroelectr Freq
extremities. J Clin Ultrasound 2004;32:511-21. Control 2015;62:2138-45.
4. Cobbold RSC. Foundations of biomedical ultrasound. 17. Catheline S, Thomas JL, Wu F, Fink MA. Diffraction field
Oxford: Oxford University Press, 2007:802. of a low frequency vibrator in soft tissues using transient
5. Macintyre NJ, Lorbergs AL. Imaging-based methods for elastography. IEEE Trans Ultrason Ferroelectr Freq
non-invasive assessment of bone properties influenced by Control 1999;46:1013-9.
mechanical loading. Physiother Can 2012;64:202-15. 18. Doherty JR, Trahey GE, Nightingale KR, Palmeri ML.
6. Wells PNT, Liang HD, Young TP. Ultrasonic imaging Acoustic radiation force elasticity imaging in diagnostic
technologies in perspective. J Med Eng Technol ultrasound. IEEE Trans Ultrason Ferroelectr Freq Control
2011;35:289-99. 2013;60:685-701.
7. Baillet A, Gaujoux-Viala C, Mouterde G, Pham T, Tebib 19. Sarvazyan A, Hall TJ, Urban MW, Fatemi M, Aglyamov
J, Saraux A, Fautrel B, Cantagrel A, Le Loët X, Gaudin SR, Garra BS. An overview of elastography - an emerging
P. Comparison of the efficacy of sonography, magnetic branch of medical imaging. Curr Med Imaging Rev
resonance imaging and conventional radiography for the 2011;7:255-82.
detection of bone erosions in rheumatoid arthritis patients: 20. Sigrist RMS, Liau J, Kaffas A El, Chammas MC, Willmann
a systematic review and meta-analysis. Rheumatology JK. Ultrasound elastography: review of techniques and
(Oxford) 2011;50:1137-47. clinical applications. Theranostics 2017;7:1303-29.
8. Griffith JF, Rainer TH, Ching AS, Law KL, Cocks RA, 21. Tang A, Cloutier G, Szeverenyi NM, Sirlin CB.
Metreweli C. Sonography compared with radiography Ultrasound elastography and mr elastography for assessing
in revealing acute rib fracture. AJR Am J Roentgenol liver fibrosis: part 1, principles and techniques. AJR Am J
1999;173:1603-9. Roentgenol 2015;205:22-32.
9. Jin W, Yang DM, Kim HC, Ryu KN. Diagnostic 22. Fatemi M, Greenleaf JF. Ultrasound-stimulated vibro-
values of sonography for assessment of sternal fractures acoustic spectrography. Science 1998;280:82-5.
compared with conventional radiography and bone scans. J 23. Fatemi M, Greenleaf JF. Vibro-acoustography: an
Ultrasound Med 2006;25:1263-8. imaging modality based on ultrasound-stimulated acoustic
10. Li YQ, Jiang C, Li Y, Xu F, Xu KL, Ta DA, Le LH. Multi- emission. Proc Natl Acad Sci U S A 1999;96:6603-8.
layer velocity model based synthetic aperture ultrasound 24. Silva GT, Mitri FG. Difference-frequency generation in
imaging of cortical bone. Acta Phys Sin 2019;68:184302. vibro-acoustography. Phys Med Biol 2011;56:5985-93.
11. Renaud G, Kruizinga P, Cassereau D, Laugier P. In vivo 25. Compston J, Cooper A, Cooper C, Gittoes N, Gregson
ultrasound imaging of the bone cortex. Phys Med Biol C, Harvey N, Hope S, Kanis JA, McCloskey EV, Poole
2018;63:125010. KES, Reid DM, Selby P, Thompson F, Thurston A, Vine
12. Hryhorczuk AL, Restrepo R, Lee EY. Pediatric N; National Osteoporosis Guideline Group (NOGG).
musculoskeletal ultrasound: practical imaging approach. UK clinical guideline for the prevention and treatment of
AJR Am J Roentgenol 2016;206:W62-72. osteoporosis. Arch Osteoporos 2017;12:43.
13. Markowitz RI, Davidson RS, Harty MP, Bellah RD, Hubbard 26. Golob AL, Laya MB. Osteoporosis. Med Clin North Am
AM, Rosenberg HK. Sonography of the elbow in infants and 2015;99:587-606.
children. AJR Am J Roentgenol 1992;159:829-33. 27. Tarantino U, Iolascon G, Cianferotti L, Masi L, Marcucci
14. Ophir J, Céspedes I, Ponnekanti H, Yazdi Y, Li X. G, Giusti F, Marini F, Parri S, Feola M, Rao C, Piccirilli
Elastography: a quantitative method for imaging E, Zanetti EB, Cittadini N, Alvaro R, Moretti A, Calafiore
the elasticity of biological tissues. Ultrason Imaging D, Toro G, Gimigliano F, Resmini G, Brandi ML.
1991;13:111-34. Clinical guidelines for the prevention and treatment of
15. Parker KJ, Doyley MM, Rubens DJ. Imaging the elastic osteoporosis: summary statements and recommendations
properties of tissue: the 20 year perspective. Phys Med from the Italian Society for Orthopaedics and
© Quantitative Imaging in Medicine and Surgery. All rights reserved. Quant Imaging Med Surg 2021;11(2):586-596 | http://dx.doi.org/10.21037/qims-20-610Quantitative Imaging in Medicine and Surgery, Vol 11, No 2 February 2021 595
Traumatology. J Orthop Traumatol 2017;18:3-36. 39. Taveira AT, Pereira FA, Fernandes MI, Sawamura R,
28. Kanis JA, McCloskey EV, Johansson H, Cooper C, Rizzoli Nogueira-Barbosa MH, Paula FJ. Longitudinal evaluation
R, Reginster JY. European guidance for the diagnosis and of hepatic osteodystrophy in children and adolescents
management of osteoporosis in postmenopausal women. with chronic cholestatic liver disease. Braz J Med Biol Res
Osteoporos Int 2013;24:23-57. 2010;43:1127-34.
29. Kanis JA, Harvey NC, Cooper C, Johansson H, Odén 40. Parfitt AM, Drezner MK, Glorieux FH, Kanis JA,
A, McCloskey EV; Advisory Board of the National Malluche H, Meunier PJ, Ott SM, Recker RR. Bone
Osteoporosis Guideline Group. A systematic review of histomorphometry: standardization of nomenclature,
intervention thresholds based on FRAX: a report prepared symbols, and units. Report of the ASBMR
for the National Osteoporosis Guideline Group and the Histomorphometry Nomenclature Committee. J Bone
International Osteoporosis Foundation. Arch Osteoporos Miner Res 1987;2:595-610.
2016;11:25. 41. Osterhoff G, Morgan EF, Shefelbine SJ, Karim L,
30. Nayak S, Edwards DL, Saleh AA, Greenspan SL. McNamara LM, Augat P. Bone mechanical properties and
Systematic review and meta-analysis of the performance changes with osteoporosis. Injury 2016;47:S11-20.
of clinical risk assessment instruments for screening 42. Zou KH, Tuncali K, Silverman SG. Correlation and
for osteoporosis or low bone density. Osteoporos Int simple linear regression. Radiology 2003;227:617-22.
2015;26:1543-54. 43. Urban MW, Chalek C, Kinnick RR, Kinter TM, Haider B,
31. Tella SH, Gallagher JC. Prevention and treatment of Greenleaf JF, Thomenius KE, Fatemi M. Implementation
postmenopausal osteoporosis. J Steroid Biochem Mol Biol of vibro-acoustography on a clinical ultrasound system.
2014;142:155-70. IEEE Trans Ultrason Ferroelectr Freq Control
32. Campbell GM, Sophocleous A. Quantitative analysis of 2011;58:1169-81.
bone and soft tissue by micro-computed tomography: 44. Kamimura HAS, Urban MW, Carneiro AAO, Fatemi
applications to ex vivo and in vivo studies. Bonekey Rep M, Alizad A. Vibro-acoustography beam formation with
2014;3:564. reconfigurable arrays. IEEE Trans Ultrason Ferroelectr
33. Odgaard A, Gundersen HJG. Quantification of Freq Control 2012;59:1421-31.
connectivity in cancellous bone, with special emphasis on 45. Nogueira-Barbosa MH, Kamimura HAS, Braz G,
3-D reconstructions. Bone 1993;14:173-82. Agnollitto PM, Carneiro AAO. Preliminary results of
34. Dalle Carbonare L, Valenti MT, Bertoldo F, Zanatta vibro-acoustography evaluation of bone surface and bone
M, Zenari S, Realdi G, Lo Cascio V, Giannini S. Bone fracture. Quant Imaging Med Surg 2017;7:549-54.
microarchitecture evaluated by histomorphometry. Micron 46. Barbu EC, Chițu-Tișu CE, Lazăr M, Olariu C, Bojincă M,
2005;36:609-16. Ionescu RA, Ion DA, Bădărău IA. Hepatic osteodystrophy:
35. DeHoff RT, Aigeltinger EH, Craig KR. Experimental a global (re)view of the problem. Acta Clin Croat
determination of the topological properties of three- 2017;56:512-25.
dimensional microstructures. J Microsc 1972;95:69-91. 47. Klein GL, Soriano H, Shulman RJ, Levy M, Jones
36. Bouxsein ML, Boyd SK, Christiansen BA, Guldberg G, Langman CB. Hepatic osteodystrophy in chronic
RE, Jepsen KJ, Müller R. Guidelines for assessment of cholestasis: evidence for a multifactorial etiology. Pediatr
bone microstructure in rodents using micro-computed Transplant 2002;6:136-40.
tomography. J Bone Miner Res 2010;25:1468-86. 48. Gatta A, Verardo A, Di Pascoli M, Giannini S, Bolognesi
37. Spirlandeli AL, Dick-de-Paula I, Zamarioli A, Jorgetti M. Hepatic osteodystrophy. Clin Cases Miner Bone Metab
V, Ramalho LNZ, Nogueira-Barbosa MH, Volpon 2014;11:185-91.
JB, Jordão AA, Cunha FQ, Fukada SY, de Paula FJA. 49. Chen CC, Wang SS, Jeng FS, Lee SD. Metabolic bone
Hepatic osteodystrophy: the mechanism of bone loss disease of liver cirrhosis: is it parallel to the clinical severity
in hepatocellular disease and the effects of pamidronate of cirrhosis? J Gastroenterol Hepatol 1996;11:417-21.
treatment. Clinics (Sao Paulo) 2017;72:231-7. 50. Guedes PMSG, Zamarioli A, Botega II, Silva RABD, Issa
38. Pereira FA, Facincani I, Jorgetti V, Ramalho LN, Volpon JPM, Butezloff MM, Sousa YTCS, Ximenez JPB, Volpon
JB, Dos Reis LM, de Paula FJ. Etiopathogenesis of hepatic JB. Undernutrition impairs the quality of growth plate and
osteodystrophy in Wistar rats with cholestatic liver disease. trabecular and cortical bones in growing rats1. Acta Cir
Calcif Tissue Int 2009;85:75-83. Bras 2019;34:e201900301.
© Quantitative Imaging in Medicine and Surgery. All rights reserved. Quant Imaging Med Surg 2021;11(2):586-596 | http://dx.doi.org/10.21037/qims-20-610596 Agnollitto et al. Ex vivo VA characterization of osteoporosis
51. Jee WS, Ma Y. Animal models of immobilization Ultrasound-based estimates of cortical bone thickness
osteopenia. Morphologie 1999;83:25-34. and porosity are associated with nontraumatic fractures in
52. Jee WS, Yao W. Overview: animal models of osteopenia postmenopausal women: a pilot study. J Bone Miner Res
and osteoporosis. J Musculoskelet Neuronal Interact 2019;34:1585-96.
2001;1:193-207. 62. Rinaldo N, Pasini A, Donati R, Belcastro MG, Gualdi-
53. Komori T. Animal models for osteoporosis. Eur J Russo E. Quantitative ultrasonometry for the diagnosis of
Pharmacol 2015;759:287-94. osteoporosis in human skeletal remains: New methods and
54. Lelovas PP, Xanthos TT, Thoma SE, Lyritis GP, Dontas standards. J Archaeol Sci 2018;99:153-61.
IA. The laboratory rat as an animal model for osteoporosis 63. Barbieri G, Mazzer N, Ribeiro EA, Nogueira-Barbosa
research. Comp Med 2008;58:424-30. MH, Barbieri CH. A comparative analysis between
55. Volpon JB, Silva AV, Falcai MJ, Louzada MJ, Zamarioli A, ultrasonometry and computer-aided tomography to
Kotake BG, Issa JP. The osteogenic effects of swimming evaluate bone healing. J Orthop Res 2012;30:1076-82.
on bone mass, strength, and microarchitecture in rats 64. Mandarano-Filho LG, Bezuti MT, Barbieri CH. In vivo
with unloading-induced bone loss. Microsc Res Tech standardization of bone ultrasonometry of the clavicle.
2015;78:784-91. Clinics (Sao Paulo) 2016;71:140-4.
56. Zamarioli A, Battaglino RA, Morse LR, Sudhakar S, 65. Xu K, Ta D, He R, Qin YX, Wang W. Axial transmission
Maranho DA, Okubo R, Volpon JB, Shimano AC. method for long bone fracture evaluation by ultrasonic
Standing frame and electrical stimulation therapies guided waves: simulation, phantom and in vitro
partially preserve bone strength in a rodent model experiments. Ultrasound Med Biol 2014;40:817-27.
of acute spinal cord injury. Am J Phys Med Rehabil 66. 2019 Official Positions Adult. (cited 2020 Jul 21). Available
2013;92:402-10. online: https://iscd.app.box.com/s/5r713cfzvf4gr28q7zdcc
57. Bernard S, Monteiller V, Komatitsch D, Lasaygues P. g2i7169fv86
Ultrasonic computed tomography based on full-waveform 67. Alizad A, Walch M, Greenleaf JF, Fatemi M. Vibrational
inversion for bone quantitative imaging. Phys Med Biol characteristics of bone fracture and fracture repair:
2017;62:7011-35. Application to excised rat femur. J Biomech Eng
58. Pereira D, Haïat G, Fernandes J, Belanger P. Effect of 2006;128:300-8.
intracortical bone properties on the phase velocity and cut- 68. Callé S, Remenieras JPP, Bou Matar O, Defontaine M,
off frequency of low-frequency guided wave modes (20–85 Patat FF. Application of nonlinear phenomena induced by
kHz). J Acoust Soc Am 2019;145:121-30. focused ultrasound to bone imaging. Ultrasound Med Biol
59. Xu K, Minonzio JG, Ta D, Hu B, Wang W, Laugier P. 2003;29:465-72.
Sparse SVD method for high-resolution extraction of the 69. Urban MW, Alizad A, Aquino W, Greenleaf JF, Fatemi
dispersion curves of ultrasonic guided waves. IEEE Trans M. A review of vibro-acoustography and its applications in
Ultrason Ferroelectr Freq Control 2016;63:1514-24. medicine. Curr Med Imaging Rev 2011;7:350-9.
60. Barkmann R. Quantitative ultrasound. In: Barkmann R. 70. Ghavami S, Denis M, Gregory A, Webb J, Bayat M,
Radiology of osteoporosis. Heidelberg: Springer Berlin Kumar V, Fatemi M, Alizad A. Pulsed vibro-acoustic
Heidelberg, 2008:163-73. method for assessment of osteoporosis & osteopenia: a
61. Minonzio JG, Bochud N, Vallet Q, Ramiandrisoa feasibility study on human subjects. J Mech Behav Biomed
D, Etcheto A, Briot K, Kolta S, Roux C, Laugier P. Mater 2019;97:187-97.
Cite this article as: Agnollitto PM, Braz GA, Spirlandeli
AL, de Paula FJA, Carneiro AAO, Nogueira-Barbosa MH.
Ex vivo vibro-acoustography characterization of osteoporosis
in an experimental mice model. Quant Imaging Med Surg
2021;11(2):586-596. doi: 10.21037/qims-20-610
© Quantitative Imaging in Medicine and Surgery. All rights reserved. Quant Imaging Med Surg 2021;11(2):586-596 | http://dx.doi.org/10.21037/qims-20-610You can also read