A Metrics Framework to Facilitate Integration of Disaggregated Software Development
←
→
Page content transcription
If your browser does not render page correctly, please read the page content below
A Metrics Framework to Facilitate Integration of
 Disaggregated Software Development

 Stephen C Cook
 Shoal Group Pty Ltd and
 The University of Adelaide
 Stephen.Cook@shoalgroup.com

 Ashok Samalam Mark H Unewisse
 Shoal Group Pty Ltd Defence Science and Technology Group
 Ashok.Samalam@shoalgroup.com Mark.Unewisse@dst.defence.gov.au
 Copyright © 2021 by Stephen C Cook, Ashok Samalam, and Mark H Unewisse. Permission granted to INCOSE to publish and use.

Abstract. Contemporary defence information system developments are moving towards utilising Con-
tinuous Iterative Development (CID) employing cloud native software development approaches involv-
ing many contractors delivering various components. The key questions for capability managers not
familiar with CID developments revolve around knowing how well the development is progressing and
understanding how well the constituent systems to be delivered will integrate as time goes by. The au-
thors were tasked to produce a metrics framework to address these questions and the resulting new con-
struction is presented along with the key metrics and integration matrices. The paper concludes that the
matrices will readily identify integration issues very early in the program because their instantiation will
necessitate the evaluation of all nominated services between the constituent systems.

 Introduction
In the Defence sector, users of CID are increasing adopting the Development Security Operations
(DevSecOps) approach, which is an organizational software engineering culture and practice that aims at
unifying software development (Dev), security (Sec) and operations (Ops). This paradigm is intended to
deliver security-tested, micro-service capability elements on very short timeframes (weeks to months).
This, in turn, enables an Agile-like development process to meet rapidly changing client needs and reflect
technological advancements.

The Australian Department of Defence is planning to adopt CID approaches for certain Software-Inten-
sive Systems (SIS) and is also moving away from relying on prime contractors in order to avoid depend-
ence on a single contractor. A paradigm shift of this type calls for new software measurement approaches
and the authors were tasked with designing a metrics framework that can provide information to guide
the contractor group on cross-supplier integration matters; support the monitoring of delivery progress
against the technical specifications for the components; and ensure that the components to be delivered
will integrate as expected and contribute to higher-level capability goals. The output of the first part of
this research program was a report that provides the desired metrics framework and substantial back-
ground and review material (Cook, 2020). This paper is an evolution of that work in that it advances the
unique synthesis of ideas that comprise the framework, but space precluded the inclusion of the integra-
tion-related metrics at the various levels of decomposition of the software. This will form a subsequent
publication after the metrics are evaluated in field trials.

The paper opens by describing the recent, substantial push in the US defence sector to move to CID and
the impact this has on software development metrics. We next define what we mean by the term metrics
framework and then proceed to provide a description of each of the three core elements: underpinning
software measurement theory and concepts, software metrics design methodology and practices, and se-
lected tools and techniques. The paper concludes with a section on how this framework can be used to
inform metrics definition and application in a major CID SIS.

 CID within the Defence Sector
Around the world, defence organisations have been examining the use of CID approaches for some time.
In the US, Defense Science Board (DSB) (2018) and Defense Innovation Board (DIB) (McQuade et al.,
2019) studies strongly advocated the adoption of CID for software-intensive systems. In response to
these reports and other drivers, the US Department of Defense (DoD) has made a transformational change
in acquisition policy by redesigning the Defense Acquisition System to include a new Software Acquisi-
tion Pathway to facilitate rapid and iterative delivery of software capability to the user (DoDI, 2020). The
document states that the new software acquisition pathway integrates modern software development prac-
tices such as Agile Software Development, Development Security and Operations (DevSecOps), and
Lean Practices. The pathway is characterized by small cross-functional teams that include operational
users, developmental and operational testers, software developers, and cybersecurity experts that leverage
enterprise services to deliver software rapidly and iteratively to the operational environment.

 Teams Cadence Output

 Value
 Stakeholders
 Streams

 Epics

 Solution
 Solution Demo Capabilities
 Train

 Single Agile Release Train
 Program Increment Features
 (ART)

 System Demo

 Agile Team Iteration Stories

 Figure 1. Summary of CID concepts
 Program Program
Increment Solution Demo Increment
Boundary Boundary

 Inspect & Inspect & Inspect &
 Adapt Adapt Adapt
 (System Demo) (System Demo) (System Demo)

 Development Development Development Innovation &
 PI Planning Iteration Planning Iteration
 Iteration Iteration

 Figure 2. The anatomy of a typical program increment

Figure 1 attempts to summarise key CID concepts, using the terminology of the Scaled Agile Framework
(SAFe, 2020) as an exemplar. Firstly, work is decomposed into a set of epics that deliver a set of capa-
bilities, that comprise a set of features which are described in a set of user stories. At the enterprise level,
the entire effort is managed as a portfolio with multiple value streams and epics. Secondly, CID ap-
proaches employ defined cadences. The Program Increment (PI) is the heartbeat of a CID program. It is
a timeboxed planning interval during which an Agile Release Train (ART) (and for larger jobs one or
more a Solution Trains) plan and deliver incremental value in the form of working, tested software and
systems. PIs are typically 8-12 weeks long and typically comprise a PI planning iteration, around four

development iterations, followed by one innovation and planning iteration that reflects on the achieve-
ments of the PI and designs the subsequent PI, see Figure 2. While the development effort is timeboxed,
releases of new software which represent the achievement of thresholds of capability, are managed to suit
demand. Typically, the first release is referred to as the minimum viable product and subsequent ones as
the next viable product. These releases are aligned to the epics and provide a stream of value to the users
and owners of the system under development.

To support the move to CID in both defence and industry sectors, a collaborative working group was
established between Practical Software and Systems Measurement (PSM), the National Defense Indus-
trial Association (NDIA) Systems Engineering Division, and the International Council on Systems Engi-
neering (INCOSE) to develop the PSM Measurement Framework for Continuous Iterative Development
(CID). The resulting report, (Jones et al., 2020), overviews CID concepts, provides a methodology to
measure the Execution Phase of the new Software Acquisition Pathway, and provides a list of measures
based on a series of surveys of members of relevant NDIA, PSM, and INCOSE working groups. The
PSM CID measurement framework provides guidance for information needed and measures from three
perspectives: development team, product, and enterprise. The PSM framework is well suited to address
one of the three purposes of the metrics framework: monitoring of delivery progress against the technical
specifications for the components, however, it does not explicitly address integration of disaggregated
software developments and this is the thrust of the novel framework described below.

 The Structure of the CID Measurement Framework
Dictionary.com (2020) defines a framework as a skeletal structure designed to support or enclose some-
thing; a frame or structure composed of parts fitted and joined together. We follow Westfall (2006) and
consider that a metrics framework should be able to hold the entire package of things needed to design,
perform, and interpret systems and software measurement. We conceive the framework as four interde-
pendent components as shown in Figure 3. The domain or area of application that we are concerned with
is CID for SIS. (It is important to make the distinction between CID and waterfall-style approaches
because the metrics are rather different.) The contents of the three components are discussed in greater
detail in the sections below.

 Domain: Continuous Iterative Development for SIS

 Methodology
 and Practices

 Underpinning
 Tools and
 Theory &
 Techniques
 Concepts

 Figure 3. The components of the CID systems and software metrics framework

 Underpinning Theories and Concepts
Measurement can be defined informally using the statement below synthesised from the work of Finkel-
stein (1982) and Bush and Fenton (1990):

 Measurement is the process of empirical, objective assignment of numbers or symbols to
 attributes of entities or events in the real world in such a way as to describe them.

An entity can be an object such as a person, place, software program, event, or time period whereas an
attribute is a feature or property of the entity. A subtle but important point is that measurement is con-
cerned with specific attributes of an entity and only that attribute and not the whole entity. For example,
a measurement of tyre tread depth does not convey any information about the tyre pressure or indeed the
vehicle to which it is fitted. Thus, it necessary to be very specific about the entity and the attribute being
measured and the mapping between the observations and the symbols used to record the measurement.

Technical measurement in project management and systems and software engineering is well established
and, indeed, the activity features as a technical management process in the top-level systems engineering
standard, ISO/IEC/IEEE 15288:2015, and has its own standard ISO/IEC/IEEE 15939:2007. These stand-
ards draw on what has been found to be valuable in practice as documented in a series of INCOSE pub-
lications (Roedler and Jones, 2005; Miller et al., 2010; Carson et al., 2015). These documents treat meas-
urement as a feedback control system, see Figure 4, where measurement informs action within systems
engineering.

 Figure 4. Measurement as a feedback control system (Miller et al., 2010)

It is useful to define the term measure before continuing. ISO/IEC/IEEE 15939:2007 defines the noun
measure as a variable to which a value is assigned as the result of measurement and notes that the plural
form measures is used to refer collectively to base measures, derived measures and indicators (see later
for definitions of these terms). The references in the paragraph above identify three types of measures:
resource, process, and product measures. Resource measures capture the expenditure of money and also
the utilisation of human, computing, and infrastructure resources. These are very useful for project man-
agement monitoring and reporting. However, resource measures are not strongly related to software
integration outcomes and so this paper concentrates on process and product measures. Process measures
relate to how well a given process or activity is working and they provide insights into process stability
and process improvement opportunities. Many generic process measures can be found in SEI (2010)
which gives examples such as cycle time and defect removal efficiency. Such measures also provide
useful information for estimating the resources needed for new projects. Products measures relate to the
various work products, see for example the list in Figure 4. The principal product measures for major
projects can be thought of as an interdependent hierarchy as described by from Roedler and Jones (2005)
that comprises measures of effectiveness, key performance parameters, measures of performance, and
technical performance measures. The terms are broadly consistent with contemporary Australian Depart-
ment of Defence usage and good definitions can be found in Roedler and Jones (2005).

Measurement produces data, for it to be useful it must be able to inform people and act as a catalyst for
decision making and control. Thus, it is necessary to identify what goals are being sought, what infor-
mation is needed and by whom to indicate progression towards the goal, and the measurements needed
to provide that information. An important concept is that the value of measurement comes not from the
act of measuring but from the subsequent analysis and the action taken to correct a variance from a target
value or to improve current performance. ISO/IEC/IEEE 15939:2007 describes how this can be done.
The terms measures and metrics are often used interchangeably. In this paper we use the definition of
metric found in ISO/IEC/IEEE 24765:2010 where it is stated that a metric is: “a combination of two or
more measures or attributes; a quantitative measure of the degree to which a system, component or pro-
cess possesses a given attribute; the defined measurement method and measurement scale.” 1 This is con-
sistent with Westfall (2006) who states that a metric is the entire package including:
 • Measurement definition (including all the component measures needed to form the metric).
 • Techniques for obtaining the measurement.
 • Definitions, rules, and methods for collecting, storing, reporting, and interpreting the measure-
 ment information.
Westall goes on to say that standardised metric definitions are the only way to ensure that when two
people measure the same attribute of the same entity, they get the same result.

 Measurement
 Construct

 Figure 5. The Measurement Information Model (adapted from ISO/IEC/IEEE 15939:2007)

The idea of the Measurement Information Model (ISO/IEC/IEEE 15939:2007) shown in Figure 5 identi-
fies basic terms and concepts and shows the relationships between stakeholder information needs and the

1
 Given that many measurement reference documents, including ISO/IEC/IEEE 15939:2007, use the term measure ex-
clusively to describe metrics and measures, it must be accepted that measure can also cover metrics albeit with an addi-
tional qualifier such as derived measure.
relevant entities and their attributes of concern. It pulls the theoretical measurement ideas together and
helps determine what a measurement planner needs to specify during measurement planning, execution,
and evaluation. It is the full description of a metric, as discussed above.

Core to the Measurement Information Model is the measurable concept that describes possible ideas to
satisfy the information needs and takes the form of an abstract relationship between the attributes of
entities and information needs. The measurable concept is translated into a measurement construct that
identifies:
 • base measures that capture information about the attributes of single, independent entities.
 • derived measures that combine the base measures through a defined measurement function.
 • analysis model that combines derived measures and decision criteria.
 • indicators that provide an estimate or evaluation of specified attributes derived from a model with
 respect to the information need.

 CID Software Measurement Principles
In the process of reviewing CID software metrics to identify pre-existing measures aimed at ensuring
software integration, Cook (2020) encountered a significant amount of guidance on metrics formulation.
This is summarised in Table 1.
 Table 1. CID software measurement principles
 No. Name Principle
 1 Metrics must have stake- Each metric must have an identified stakeholder. Stakeholders exist at various
 holders levels: team, product and enterprise and metrics will be needed at each level.
 2 Purpose of Metrics Each metrics should:
 • inform decisions or answer key programmatic questions
 • drive actions
 • allow early visibility into issues so that timely corrective action can be
 taken
 3 Metric Parsimony A minimum practical set of metrics should be selected and tailored based on or-
 ganizational and program circumstances, tools, and processes.
 4 Automated Metric Collec- The collection of (system) metrics should be automated to the extent practical
 tion and integrated with business workflows. In the first instance, system metrics
 should be based on the metrics inherent in the selected development environ-
 ment.
 5 Survey Data is Valuable Survey data can reveal important cultural, perceptual, and holistic information
 not obtainable from automated measurement and should be used to augment sys-
 tem metrics (Forsgren and Kersten, 2018).
 6 Choose a Metric Set that In a CID program, a balance between speed and quality needs to be maintained.
 Balances Speed and Qual- There is often a ‘sweet spot’ trade-off between speed and quality that delivers a
 ity best value solution based on project objectives. Quality needs to be monitored,
 in addition to speed, to ensure that these measures are appropriately balanced.
 7 First Law of Measurement You cannot measure what is not defined. For process measures, be sure to have
 the process defined first.
 8 Measure lead time and cy- Agile Principle #1: the highest priority is to satisfy the customers through early
 cle time and continuous delivery of valuable software. Thus, metrics like time to first
 release and lead time: the elapsed time from when a work request is provided to
 its satisfaction will always be important.
 9 Measure delivery rate Agile Value #7: Working software is the primary measure of progress.
 (burndown)
 10 Aim to measure value Successful projects will develop metrics that relate to user value (McQuade et
 al., 2019).
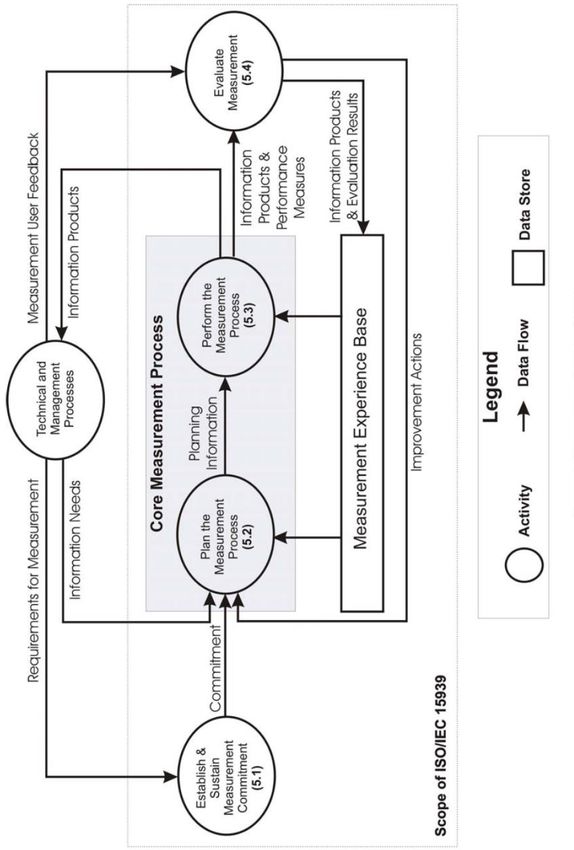
No. Name Principle
 11 Measurement context Metric selection, (in particular for the higher-level metrics) will depend on the
 type of software, the development approach chosen, and the selected develop-
 ment environment. Avoid a one-size-fits-all approach (McQuade et al., 2019).
 See Carson et al. (2015) for a complete list of factors that need to be considered
 when designing metrics.

 Methodology and Practices
ISO/IEC/IEEE 15939:2007 provides a visualisation of the measurement process model and the scope of
the standard, see Figure 6. Miller et al. (2010) provides a synthesised description of the measurement
processes of ISO/IEC/IEEE 15939:2007, Practical Software and Systems Measurement (PSM), and the
Capability Maturity Model Integration Measurement and Analysis Process Area, (SEI, 2010) and this
forms a solid basis for measuring CID software integration. An overview follows from that perspective.
There are four iterative activities: establish, plan, perform, and evaluate, of which the plan and perform
processes are referred to as the “core measurement process”. The technical and management processes
of ISO/IEC/IEEE 15288:2015 represent the project’s decision-making activities.

Establish Commitment. This process defines the scope of the measurement program, its purpose, the
organisational unit to which it applies, and all the stakeholders. In our case the organisation will encom-
pass the owners, users, acquirers and all the companies producing the various constituent systems. The
process also covers establishing commitment to measurement through allocation of resources and through
achieving management and staff buy-in. Given that the production of disaggregated CID software is in
many ways similar to corralling the evolution of a System of Systems (SoS), many of the worldviews,
concepts and principles (Pratt & Cook, 2018) from SoS apply well, in particular, the implementation
principle that it is necessary to create and maintain a SoS Engineering culture and that stakeholder organ-
isations must intrinsically consider and balance the needs of both the SoS and the constituent systems.

 Figure 6. Measurement Process Model (ISO/IEC/IEEE 15939:2007)

Plan the measurement process. This activity comprises all the measurement planning tasks. The first
two are to characterise the organisational unit and identify and prioritise information needs. The infor-
mation needs are derived from the goals, constraints, risks, and issues to be addressed in the organisation
by the stakeholders. Miller et al. (2010) provides a list of categories of information needs:
 • Schedule and progress.
• Resources and costs.
 • Systems performance.
 • Growth and stability.
 • Product quality.
 • Life Cycle process.
 • Technological effectiveness.
 • Customer/User Satisfaction.

For our purposes we would also include integration convergence. ISO/IEC/IEEE 15939:2007 states that
information needs may address questions. In our case the key question would be “How do we evaluate
the prospective integration outcome of a CID SIS program during design and implementation?”. Once
the information needs have been identified, the stakeholder group prioritises them and selects a subset to
be addressed during the measurement process.

The next step is to identify metrics that can satisfy the selected information needs; a process for doing
this is described below in the Tools and Techniques section. The resulting set of metrics should be eval-
uated to ensure they conform to the characteristics of a good metric that can be found in Miller et al.
(2010).

The remaining measurement planning tasks are to define the data collection, analysis, storage, and report-
ing; define criteria for evaluating the measurement process; allocate resources; and acquire and deploy
supporting technologies. CID software employs sophisticated development environments, often called
software factories, that come with a range of inbuilt metrics. As stated in the section on metrics principles
above, the use of automated metrics from the software factory is strongly encouraged and this will be a
major factor in metrics selection. Furthermore, for CID software, the top-down approach described above
will need to be augmented with metrics that are recommended by experts for the selected software devel-
opment paradigm, acquisition model, and development practices.

 Tools and Techniques
There exists a rich array of tools and techniques for software measurement. We will limit our discussion
to two: a practical process for formulating metrics and matrix-based metrics for addressing integration
matters explicitly.

 A Practical Process for Formulating Software Metrics
Given that there are a large number of possible entities and attributes in any SIS, there are an even larger
number of possible metrics; indeed, Ponisio and van Eck (2012) identified nearly 1000 metrics that were
relevant to outsourced software development. ISO/IEC/IEEE 15939:2007 makes it clear that each project
will need to invest effort in selecting and documenting their metrics in the test planning phase. However,
while standards are strong on describing processes and what activities need to be done, they leave it to
the practitioner to determine how to implement the process. This paper draws on the work of software
engineers like Westfall (2006), Basili and Rombach (1988), and van Solingen (2003) to provide useful,
practical guidance on metrics design and selection. The structure of the following subsections is based
on a melding of Westfall’s multiple-step, top-down approach, Basili et al’s Goal/Question/Metric (GQM)
formulation, and the need to populate the measurement concept discussed above. It is helpful to note that
Westfall’s approach is strongly outcome focused and encourages practitioners to ask: “Why am I meas-
uring? and “What business needs does the organisation wish its measurement initiative to address?”

GQM, (Basili et al. 1994) is based upon the premise that for an organization to measure software devel-
opment in a meaningful way it must first specify the organisational goals it is aiming to achieve and then
those for the project. Basili et al state that a GQM model is a hierarchical structure starting with a goal
that specifies the purpose of measurement, the object to be measured, the issue to be measured, and the
viewpoint from which the measure is taken. The goal is refined into several questions that usually break
down the issue into its major components. Each question is then refined into metrics, some of them ob-
jective, some subjective. Metrics can be used to answer more than one question. GQM has three levels:

The Conceptual Level (Goal). At this level, goals are defined for objects (i.e. resources, processes, or
products), for a variety of reasons, with respect to various models of quality, from various points of view
(in particular that of the metrics customers), relative to a particular environment. At the organisational
level, project goals will typically flow down from strategic goals such as maintaining top-tier customer
satisfaction, achieving corporate budget and schedule targets, and in our case facilitating integration by
design. At the project level, it is normal to use classical project goals such as cost, schedule, performance,
and quality. At the task level, the goals would typically relate to task exit criteria. Each metric customer
(defined later) would have one or more goals, some of which could be shared between customers.

The Operational Level (Question). Questions are used to elucidate an understanding of how the assess-
ment of achievement against a specific goal is to be performed.

The Quantitative Level (Metrics). Metrics produce the data used to answer each question in a quantita-
tive way. The data can be subjective if it depends on both the object that is being measured and the
viewpoint from which they are taken; for example, readability of a text, level of user satisfaction or ob-
jective if it depends only on the object being measured, for example staff hours spent on a task.

The software metrics programs must be designed to provide the specific information necessary to manage
the project and to improve software engineering products, processes, and services. Thus, the goals and
the measurement construct have to be determined during project and test planning well before the imple-
mentation starts. The paragraphs below step through the process of defining the goals and the associated
metrics.

Step 1 Identify Metrics Customers. The first step is to identify the customers for each information need,
that is the person or group who will be making decisions or taking action based upon the metric. For our
purposes there are three classes of customers for metrics: the software development organisation, the
acquiring organisation, and the capability manager who represents the end user community. Westfall
points out that customers’ information requirements should drive the metrics program and if a metric does
not have a customer it should not be produced.

Step 2 Define Target Goals. Basili et al. (1994) explain that a GQM model is developed by identifying
a set of quality and/or productivity goals (or in our case integration goals spanning legacy systems and
new developments), at corporate, divisional or project level; (for example, customer satisfaction, on-time
delivery, improved performance) and that the process of setting goals is critical to the successful applica-
tion of the GQM approach. A goal in GQM has a purpose and three dimensions: the issue about which
the goal is concerned; the object of interest (products, processes, or resources); and the viewpoint from
which the goal is being pursued. The development of a goal is based on three basic sources of information.
The first source is the policies and strategies of the organization that applies GQM. The issue and purpose
of the goal can be determined through analysis of corporate policy statements and strategic plans coupled
with information gained from interviews of relevant subjects. The second source of information is the
description of the process and products of the organization, or, at least, the ones that are within the scope
of the measurement we want to perform. If, for instance, we want to assess a process, we need a model
of that process and of the component sub processes. From this source we derive the object coordinate of
the Goal by specifying process and product models, at the best possible level of formality. The third
source of information is the model of the organization, which provides us with the viewpoint coordinate
of the Goal. Obviously, not all issues and processes are relevant for all viewpoints in an organisation,
therefore, we must perform a relevancy analysis step before completing our list of goals, in order to make
sure that the goals that we have defined have the necessary relevancy.

Step 3 Formulate Questions. The next step is to define the questions that need to be answered to ensure
that the goal is being achieved. Basili et al. (1994) suggest that at least three classes of questions be used.
 • Group 1. How can we characterise the object (product, process, or resource) with respect to the
 overall goal?
• Group 2. How can we characterise the attributes of the object that are relevant with respect to the
 issue?
 • Group 3. How do we evaluate the characteristics of the object that are relevant with respect to the
 issue?
Example questions for a specific goal appear in Table 2 below.

 Table 2. An example GQM table for Integration Achieved
 Element Description
 Goal Purpose Monitor
 Issue integration of
 Object software solutions across the portfolio
 Viewpoint from the capability sponsor’s viewpoint
 Question Q1 How well is the new software integrating across the portfolio?
 Metrics M1 Integration Achievement of newly developed software
 M2 Integration Achievement of legacy systems
 Question Q2 How quickly are user integration needs resolved
 Metrics M3 Lead time
 M4 User satisfaction
 Question Q3 What quality level is being achieved?
 Metrics M5 Technical debt
 M6 System architecture health
 M7 Compliance quality
 Question Q4 Is the development rate satisfactory?
 Metrics M8 Number of features integrated per PI
 Question Q5 Is the project expenditure within agreed bounds?
 Metrics M9 Project expenditure achieved
 M10 Project expenditure planned for next 18 months

Step 4 Select Metrics. Once the questions have been developed, we proceed to select metrics that provide
the information needed to answer the questions. Basili et al (1994) state that the following factors influ-
ence the choice of metrics:
 • Amount and quality of the existing data sources. The aim is to try to maximise the use of existing
 or default data sources if they are available and reliable.
 • Maturity of the objects of measurement. More mature measurement objects tend to feature objec-
 tive measurement whereas it is necessary to use more subjective evaluations when dealing with
 informal or unstable objects.
 • Learning enablement. The measures we define must help us to evaluate and learn about not only
 the object of measurement but also the effectiveness of the measurement concept.
Westall (2006) states that each metric must have a clear objective and answer one or more questions and
that it is important to select metrics that are practical, realistic, and pragmatic and start with what is pos-
sible within the current process. Note that care must be taken to ensure that the metrics set selected
facilitates decision-maker understanding without overwhelming them.

Step 5 Choose Measurement Functions. A metric is a combination of one or more measurements cal-
culated using a measurement function. In the simplest case, where a metric is derived from only one base
measure, the measurement function has only one variable whereas in the general case, metrics are derived
measures that are calculated from mathematical combinations of base measures and other derived
measures. A degree of pragmatism is needed to pick the measures that are most important and to start
with simple functions; they can be elaborated later. Many software measurement functions exist that
have been successfully used. Indeed, standardised metrics are commonly found in software development
approaches, see for example the recommendations of Jones et al. 2020 for CID software, and it is advan-
tageous to examine these to see if they can be used to answer the questions. If there is a compelling
reason to develop a new measurement function it is important to speak to the people who are responsible
for the development of the product or resource or those who are involved in the process. Table 2 is a
GQM table for an integration metric. At the top of the table is the goal described by its four elements.

Step 6 Determine Base Measures and Measurement Methods. The next step is to break down the
measurement function into its base measures and define the measurement method to be used to map a
value or symbol to each base measure. The measurement method would also include rules that are to
apply to the measurement method, for example if the measure is problem report counts, then there might
be a rule to exclude reports that did not result from a product defect.

Step 7 Define the Analysis Model and Decision Criteria. Measures are produced to provide information
needed to support decision making. The analysis model of Figure 5 is the algorithm or calculation that
combines one or more base or derived measures with associated decision criteria. ISO/IEC/IEEE
15939:2007 states that the analysis model is based on an understanding of, or assumptions about, the
expected relationship between the component measures and/or their behaviour over time. The purpose
of the model is to produce estimates or evaluations, (indicators) relevant to defined information needs.
Decision criteria help to interpret measurements. They are the thresholds, targets, or patterns used to
determine the need for action or further investigation, or to describe the level of confidence in a result.

Humphreys (1989) states there are four reasons to measure software developments, these are to control,
evaluate, understand, or predict. Indicators used for control are used to monitor software projects, prod-
ucts, processes, and services and identify areas where corrective action is required. Westfall (2006) states
that indicators used for control are red flags used to warn people when things are not as expected or
planned; they are more alarms than data streams used for automatic control in engineering systems. De-
cision criteria for control metrics usually take one of three forms:
 • Thresholds: a value that when crossed indicates an out-of-control condition. An example would
 be exceeding a 15% staff turnover rate.
 • Variances: the difference between two values. When a variance exceeds a certain value, it indi-
 cates an out-of-control condition. An example would be actual expenditure versus budget.
 • Control limits: Specific upper and lower bounds that behave like thresholds. Example upper and
 lower bounds of a statistical process control chart.

Westfall (2006) states that for indicators used to understand and predict, it is typical to use a level-of-
confidence decision criterion. An example would be the level of confidence that 90% of the committed
service interactions between constituent systems will be implemented by the end in the PI. This could be
calculated as a statistical confidence interval or subjectively by considering a range of measures and their
stability over time and the potential accuracy of the data upon which the indicator is based.

Step 8 Defining the Information Product. The last step is determining the nature of the information
product including the reporting format, data extraction and reporting cycle, reporting mechanisms, distri-
bution, and availability. The information product includes the indicators and the associated interpreta-
tions that together address an information need. An example would be a comparison of measured defect
rate to planned defect rate along with an assessment of whether the difference indicates a problem.

Step 9 Capturing the Design of the Measurement Framework. As should be apparent from the above,
a lot of work goes into the design of a measurement framework and it is important to capture not just the
finished product but also the rationale behind the decisions that shape the design. A measurement frame-
work is a living entity, and just like the software development endeavour it is intended to measure, it will
change over time to reflect what has been learned about its effectiveness and to suit forthcoming infor-
mation needs.
A Set of Matrices to Capture Integration Aspects
In the case of disaggregated software integration using a CID approach such as DevSecOps, components
are developed as services by different organisations with differing schedules and timelines. Clearly, for
the overall SIS to work as intended, the services must interoperate correctly. A set of matrices is proposed
which can be used to assess the state of integration and “herd” the various development organisations into
driving the development of their respective components/services to achieve the integrated capability
along with delivering the individual capabilities.

We model the coordination and cooperation as a producer-consumer paradigm. Each service creates a set
of features that are consumed by other services to create cross-functional capabilities. Consider the per-
formance measurements for an iterative cycle that is planned to deliver a set of features/services. The
input to integration is several features from each of the services and the output of integration is a set of
features that have passed integration test and are considered fit for use. (It should be noted that features
that have not passed integration testing could still be fit for use in standalone capabilities as they would
have passed individual service integration and production tests and hence accepted for release.)

We consider Number of Features Accepted as our measure and illustrate how it can be used as a perfor-
mance metric of the coordination and cooperation among the various development organisations. Table
3 defines the notation used using the Number of Features Accepted as an example.
 Table 3. Notation for the Integration Matrix
 Symbol Meaning Comments
 i, j Service index from 1 to n
 FI Feature matrix at input to Integration Testing
 O
 F Feature matrix after Integration Testing

 Elements of FI - number of features delivered Diagonal elements refer to number of features
 by servicei on which servicej features are de- that are produced and consumed by a service.
 pendent. The matrix need not be symmetrical. Where
 there is no dependency its value is set to -1 to
 avoid division by 0 for computing E.

 Elements of FO - number of features delivered Diagonal elements refer to number of features
 by servicei on which servicej features are de- that are produced and consumed by a service.
 pendent and has passed Integration test. The matrix need not be symmetrical.
 E = FO/FI A measure of the efficiency of an organisation
 Matrix of elementwise division i.e. developing a service in delivering cross func-

 tional features and hence its cooperation and co-
 ordination with other organisations and ser-
 vices.

Rather than consider the total number of features accepted for integration testing from each organisation,
we measure the number of features accepted from each service that are needed by other services to create
a capability. These numbers are represented in the form of a matrix wherein the rows and columns are
indexed by the services.

Diagonal elements fii represent the number of features produced and consumed by servicei to deliver a
capability. In other words, they are standalone features that a service can deliver without the need to
interact with other services.

Element fij represents the number of features of servicei which are needed by features of servicej to deliver
solution capabilities. They are an indication of the dependency of other services on an individual service
and measure the coupling between the services. Where there is no dependency then the value is -1. The
number of inter-dependencies between any two trains need not be equal as one may need more features
from the other to deliver a solution. Hence the matrix will not be symmetrical and in general fij ≠ fji. The
description of a number of example metrics based on this matrix structure follows.

Integration Efficiency. The elements of E, Integration Efficiency Matrix, are the ratio of number of
features that have passed integration test to the total number tested and is a measure of successful inte-
gration of the features to form the solution. Where there is no dependency, the value is set to -1. As the
number of successful features cannot exceed the number of input features, the elements of E are always
less than or equal to 1. A 0 value indicates total failure in integration and a -1 indicates there is no de-
pendency.

Planning Efficiency. Another measure that can be defined is based on number of planned features. If FP
is the matrix of the number of planned features, then a matrix P can be defined as P = FO/FP where the
elements of P are a measure of the efficiency of individual service development organisations in planning
as well as in developing a set of features to achieve the desired capabilities in a PI.

Producer and Consumer Efficiency. There are other useful metrics that can be derived by simple cal-
culations on the matrix elements. The average of the elements of a row of E is a measure of the overall
efficiency of the corresponding organisation as a producer while the average of the column elements is a
measure of its efficacy as a consumer. The difference matrix P – E is a measure of execution of the
organisation. A high value indicates poor coordination between planning and execution processes, while
a low value indicates good coordination.

Relative Efficiencies. It is also possible to assess the relative performance of organisations by comparing
the relative values between the corresponding rows of the matrix.

Trends. By gathering these measures over several iterative cycles, it is possible to generate trend graphs
and extrapolate them to predict the future performance of not only each of the organisations but also of
the combined software. The trends would also provide an indication of the existence of systemic issues
within, as well as between, organisations.

The basic framework of matrices can be used to compute other useful metrics pertaining to the coopera-
tive execution by organisations developing disaggregated software.

Those familiar with system architectural design and partitioning will have recognised that the integration
matrices are of the same form as a Design Structure Matrix (DSM) (Browning, 2001). Given that DSMs
are commonly used to visualise and guide the partitioning of complex systems and to recognise and man-
age interfaces, information to populate the integration matrices is likely to be readily available from the
SIS architecting effort.

 An Example Application of the Metrics Framework
The example we consider is a defence command and control system. Figure 7 illustrates that the value is
delivered over time as a series of viable products integrated from the six constituent value streams being
provided by different contractors. Note the red lines within Figure 7 that represent the dependencies
between the constituent value streams that capture the software services that need to be provided between
the constituent systems. Successful delivery of these dependent software services is critical to providing
the emergent value of the overall system (SoS) working as a whole. Thus, keys to program success are
to:
 • define the dependences;
 • describe the associated interfaces and data flows;
 • identify the risks of partial or non-delivery of the dependent services;
 • identify integration requirements of the dependent software services;
 • test and verify that the dependencies successfully integrate and behave as expected at system and
 solution demonstration time; and
 • record the information above in the form of integration matrices and interpret them to form indi-
 cators for decision making.
We will now describe how successful delivery can be facilitated using the metrics framework described
above.
 C2 C2
 Capability Value Capability
 τ=1 Increment 2 τ=2
 C2 Minimum Next Viable
 Value
 Capability Viable Product1
 Increment 1
 τ=0 Product
 Extant
 System
 C2 Value at τ = 2
 Joint C2 Value Stream
 Joint C2 Value Stream JP9111 – SAFe Portfolio C2 Solution Train
 JP9111 – SAFe Portfolio JP9111 Solution Train
 JP9111 Solution Train
 Constituent Constituent Constituent Constituent Constituent
 Constituent Sub-Value Value Sub-Value Value Sub-Value Value Sub-Value Value Value

 Constituent
 Value Stream 3Stream 2 Stream 4 Stream 3 Stream 4
 Sub- & Stream 5 Control
 Stream 6 Stream 5 Stream 6
 Sub-Value Stream 2 Sub-Value Sub-Value
 Value PlanningSituation IntelligencePlanning
 Value Personnel Info Information Comms
 Stream 3 Situation Stream 4 Stream 5
 Awareness τ=2
 Stream 2 & & TargetingExecution
 Stream & τ=2 Mgmt & Managemt
 PlanningAwareness Intelligenc Personnel
 Execution τ = 2 τ = 2 6 Logistics Comms τ=2
 Situation & e& & Info
 τ=1 τ=1
 Awareness Execution Targeting Logistics Mgmt &
 τ=0 Comms

 Constituent Value Stream 1
 Sub-Value Stream 1 - Core Core Services ⁞
 Sub-Value Stream 1 - Services ⁞ τ=2
 Core Services ⁞

 Figure 7. The evolution of C2 value over time through evolution of the constituent value streams, the
 dependencies, and the interfaces

One of the earliest priorities in a CID approach is to create a shared understanding of the high-level
business objectives that the system under development is expected to help pursue. In an Agile method-
ology, this can be done during portfolio planning that establishes the strategic themes, creates the portfolio
objectives and key results, and formulates the portfolio vision and roadmap that describe the proposed
state of the system over time through a sequence of PIs. This activity is aimed at establishing a shared
vision and measures for the overall value stream. Hence this activity would incorporate many of the
activities from the Plan the Measurement Process of ISO/IEC/IEEE 15939:2007. In Figure 7, the objec-
tives and key results would relate to the planned capability at PI times τ = 1, 2, 3,… . Metrics at this level
would be reviewed periodically but are likely to be slowly changing because the generic needs for any
information system can be expected to evolve fairly slowly. It is at this time that a draft testing and
demonstration strategy will be determined that will shape the subsequent solution demonstrations for each
PI.

The next major process would design the organisational structure for the program and would include the
following activities:
 • Identifying the operational value streams.
 • Identifying the constituent systems that support the operational value streams (including legacy
 components that would not be evolved).
 • Identifying the people who develop and maintain those systems.
 • Identifying or producing a top-level architectural framework.
 • Defining the developmental value streams that contain the systems and people.
 • Adding the people needed to build the full business solution.
 • Identifying the Agile Release Trains (ARTs) that realize the development value streams.
 • Revise the testing strategy to reflect the dependencies and interfaces between the constituent sys-
 tems (roughly speaking ARTs) and the dependency DSM.
Rechtin (1991) advises that choosing the appropriate aggregation of system functions is critical in the
design of systems. This is echoed in the SAFe literature (SAFe, 2020) that describes a questioning
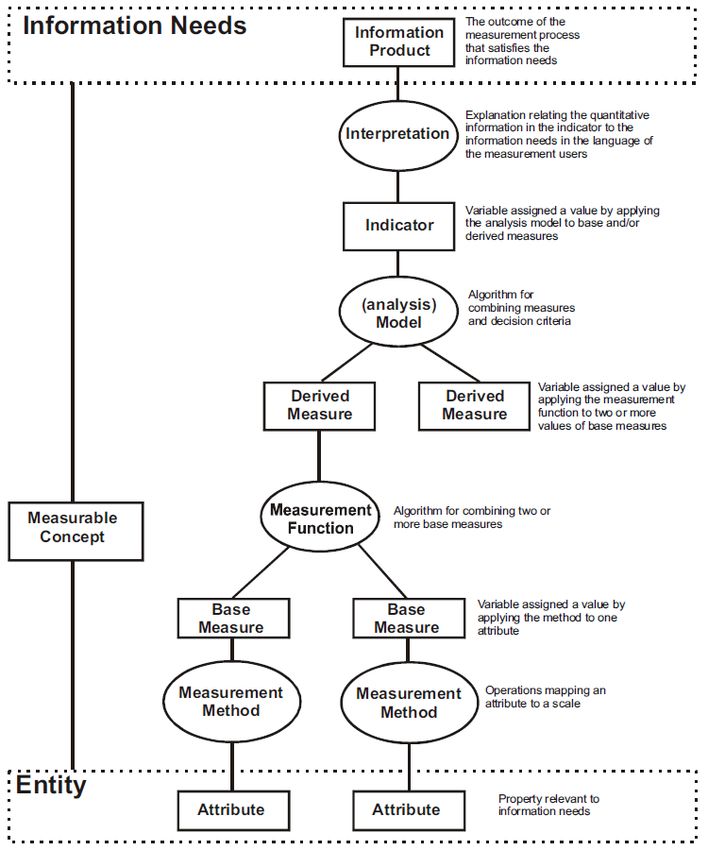
technique to assist in partitioning the system into operationally aligned value streams. Rechtin provides
additional advice on this partitioning:
 • Choose the developmental value streams so that they are as independent as possible and have
 minimal communication and dependencies between them (this is often done using a DSM).
 • Design the developmental value steams so that their performance is insensitive to unknown or
 uncontrollable external influences.
 • When choices must be made with unavoidably inadequate information, choose the best option
 available and then watch to see whether future solutions appear faster than future problems. If
 not, go back and choose again.

The next step is to commence the initial instantiation of the Continuous Development Pipeline that in
SAFe (2020) terminology comprises the three interconnected activities Continuous Exploration, Contin-
uous Integration (CI), and Continuous Deployment. Continuous Exploration is the process that re-
searches and hypothesises what needs to be developed; architects, analyses and trades-off potential solu-
tions; synthesises the Solution Vision, Solution Roadmap, and Solution Backlog; and culminates in the
Program Increment Planning (PIP) at the solution level. The CI process focuses on taking features from
the program backlog and implementing them. In CI, the application of design thinking tools in the prob-
lem space focuses on refinement of features (e.g., designing a user story map) and design for integration.
The PIP processes at portfolio and solution levels provide a set of objectives that are to be fulfilled in the
forthcoming PI by the ARTs and the individual Agile teams they contain. Also produced are a set of
solution quality metrics that will shape the development effort and be validated at the end of the PI. The
integration matrices described above would feature here and in the early conversion to a CID approach
there is also likely to be matrices for the proportion of legacy systems made interoperable with the solu-
tion. In addition , there other common solution quality metrics such as technical debt and system archi-
tecture health that can provide insight into integration progress.

Now that the initial Portfolio and Solution activities have been conducted and metrics defined at these
levels, the Program Increment cadence can commence. Figure 8 shows the three types of iteration that
comprise a PI: the first is PI Planning that serves as the driver of the Solution Train and ARTs, aligning
all participants to a shared mission and vision. The output of PI Planning is:
 • Committed PI objectives at each level.
 • A program board that highlights delivery dates for the new features, feature dependencies across
 teams, and relevant milestones.
 • A promulgated architecture vision.
 • Updated risk management.
 • Team alignment.
 • An agreed metrics set and testing regime for the solution demonstration to be held at the end of
 the PI.

For distributed development teams comprising multiple contractors without an overarching prime, par-
ticular consideration needs to be given to the following in each PI Planning / Explore Phase:
 • Agreement of the overall stage outcomes and the associated performance metrics.
 • Services to be provided from each contractor to the other contractors.
 • Agreement on the interface requirements and quality of service that should be expected.

These elements are consistent with best practice systems engineering applied within the SAFe approach
and captured in the set of integration matrices as outlined in Table 3. If undertaken effectively, the metrics
associated with the overall performance and inter-contractor dependencies should facilitate the delivery
of the required overall capability performance without a prime contractor to drive the process.

At the end of PI Planning, all PI Objectives will be in place and the metrics for determining team perfor-
mance over the PI will be promulgated. A key to successful integration is to ensure that all of the teams
understand that their performance will be measured by how well their software contributes to the
organisational and program objectives such as integration as measured by the integration matrices and
other integration metrics.
 Program Program
 Increment Solution Demo Increment
 Boundary Boundary

 Inspect & Inspect & Inspect &
 Adapt Adapt Adapt
 (System Demo) (System Demo) (System Demo)

 Development Development Development Innovation &
 PI Planning Iteration Planning Iteration
 Iteration Iteration

 Dependency ART ART ART Solution Integration
 Metrics Integration Integration Integration Verification Metrics
 Metrics Metrics Metrics

 Figure 8. Integration planning and verification across Program Increments
At the end of the planned number of Development Iterations, a solution demonstration will be held fol-
lowed by a week-long Innovation and Planning Iteration (IPI) (SAFe (2020) terminology) that would
include:
 • A solution-level review workshop to assess performance against committed objectives and iden-
 tify opportunities for improvement.
 • Final integration of the solution, including verification and validation if releasing on the PI bound-
 ary.
 • Final user acceptance testing and documentation.
 • Work on technical infrastructure.
 • Time for innovation and exploration.

During the IPI, all metrics would be enumerated and evaluated, and testing of system qualities would be
undertaken to evaluate the Solution’s compliance to non-functional requirements. At this time, the degree
of integration achieved will be assessed through the performance of the Solution and from the solution
integration matrices that will readily highlight integration issues. In addition, an assessment will be made
as to whether the development effort has covered all the things that should have been done and, as such,
evaluate the level of technical debt.

Finally, the IPI incorporates the Solution PI Planning for the subsequent PI after which the cycle begins
again with a PI Planning Iteration for the ARTs and Agile Teams.

 Conclusion
This paper has described a metrics framework to facilitate the integration of defence software that is to
be produced using continuous iterative development approaches and contracted out to multiple independ-
ent vendors under independent contracts. The metrics framework comprises the domain of concern, in
this case CID software, underpinning software measurement theory and concepts, a methodology for
software metrics design, and selected tools and techniques. The framework draws on standards and pro-
fessional society guidebooks as well as the academic literature and aims to integrate with contemporary
practices. Design for CID SIS integration is dependent on an appropriate architectural design, a suitable
set of metrics to monitor and predict integration outcomes and to drive control action, and a shared culture
that recognises that success is only achieved when the stakeholders at the highest level are satisfied.
Fortunately, CID approaches are inherently more responsive to integration concerns because full builds
of the software occur regularly. It is our belief that with the addition of a thoughtful set of integration
metrics, the contractor group and the acquirers will be able to monitor integration matters and achieve
better integration outcomes. The utility of the framework is to be evaluated through experimentation in
the near future.

 References
Basili, V.R., Caldiera, G. and Rombach, H.D., 1994. “The Goal Question Metric Approach”, in Encyclo-
 pedia of Software Engineering. Wiley.
Basili, V.R., and Rombach,H.D.,1988 “The TAME Project: Towards Improvement-Oriented Software
 Environment.” IEEE Transactions on Software Engineering, Vol 14, No 6.
Browning T.R., 2001. “Applying the Design Structure Matrix to system decomposition and integration
 problems: a review and new directions.” IEEE Transactions on Engineering Management, Vol
 48, No 3.
Bush, M.E. and Fenton, N.E., 1990. “Software measurement: a conceptual framework.” Journal of Sys-
 tems and Software, 12(3), pp.223-231.
Carson R.S., Frenz P.J., and O.Donnell E., 2015. Project Manager's Guide to Systems Engineering Meas-
 urement (No. INCOSE-TP-2015-001-01), INCOSE.
Cook S.C., 2020. A metrics framework for disaggregated software development. SHOAL-REPORT-371-
 2020-J825, V1.2 20 Oct 2020, Shoal Group Pty Ltd.
DoDI 2020. DoD Instructions 5000.02 Operation of the Adaptive Acquisition Framework, January 23,
 2020).
DSB, 2018. Design and Acquisition of Software for Defense Systems, Defense Science Board (DSB) Task
 Force on Design and Acquisition of Software for Defense Systems. (2018, February). Retrieved
 from: https://dsb.cto.mil/reports/2010s/DSB_SWA_Report_FINALdelivered2-21-2018.pdf
Finkelstein, L., 1982. “Theory and philosophy of measurement.” In Handbook of measurement science, 1,
 pp.1-30.
Forsgren, N. and Kersten, M., 2018. “DevOps metrics.” Communications of the ACM, 61(4), pp.44-48.
Humphreys W.S., 1989. Managing the Software Process, Addison-Wesley.
ISO/IEC/IEEE 15288:2015. Systems and software engineering – System life cycle processes. ISO, IEC,
 IEEE.
ISO/IEC/IEEE 15939:2007. Systems and software engineering – Measurement process. ISO, IEC, IEEE.
ISO/IEC/IEEE 24765:2010. Systems and software engineering – Vocabulary. ISO, IEC, IEEE.
ISO/IEC/IEEE 21839:2019. Systems and software engineering – System of systems (SoS) considerations
 in life cycle stages of a system. ISO, IEC, IEEE.
Jones, C.L., Golanz B., Draper, GT., Janusz, P., 2020. Practical Software and Systems Measurement
 Continuous Iterative Development Measurement Framework, Version 1.05 15 June 2020, PSM,
 NDIA & INCOSE.
McQuade J.M., Murray R.M., Louie G., Medin M., Pahlka J., and Stephens T., 2019. Software Is Never
 Done: Refactoring the Acquisition Code for Competitive Advantage, Defense Innovation Board,
 Final Software Acquisition and Practices (SWAP) Report. https://media.de-
 fense.gov/2019/Apr/30/2002124828/-1/-
 1/0/SOFTWAREISNEVERDONE_REFACTORINGTHEACQUISITIONCODEFORCOMPET
 ITIVEADVANTAGE_FINAL.SWAP.REPORT.PDF
Miller C., Carson R.S., Fowler D.J., Gantzler D.J. and Roedler G., 2010. INCOSE Systems Engineering
 Measurement Primer v2.0 (No. INCOSE-TP-2010-005-02), INCOSE.
You can also read