Modification of a conventional photolytic converter for improving aircraft measurements of NO2 via chemiluminescence.
←
→
Page content transcription
If your browser does not render page correctly, please read the page content below
Modification of a conventional photolytic converter for improving
     aircraft measurements of NO2 via chemiluminescence.
     Clara M. Nussbaumer1 , Uwe Parchatka1 , Ivan Tadic1 , Birger Bohn2 , Daniel Marno1 , Monica Martinez1 ,
     Roland Rohloff1 , Hartwig Harder1 , Flora Kluge3 , Klaus Pfeilsticker3 , Florian Obersteiner4 ,
     Martin Zöger5 , Raphael Doerich1 , John N. Crowley1 , Jos Lelieveld1,6 , and Horst Fischer1
     1
       Max Planck Institute for Chemistry, Department of Atmospheric Chemistry, 55128 Mainz, Germany
     2
       Institute of Energy and Climate Research, IEK-8: Troposphere, Forschungszentrum Jülich GmbH, 52428 Jülich, Germany
     3
       Institute of Environmental Physics, Heidelberg Univsersity, 69120 Heidelberg, Germany
     4
       Karlsruhe Institute of Technology, 76021 Karlsruhe, Germany
     5
       Flight Experiments, German Aerospace Center (DLR), 82234 Oberpfaffenhofen, Germany
     6
       Climate and Atmosphere Research Center, The Cyprus Institute, Nicosia, Cyprus
     Correspondence: Clara M. Nussbaumer (clara.nussbaumer@mpic.de)

     Abstract. Nitrogen oxides (NOx ≡ NO + NO2 ) are centrally involved in the photochemical processes taking place in the earth’s
     atmosphere. Measurements of NO2 , particularly in remote areas where concentrations are of the order of pptv (parts per trillion
     by volume), are still a challenge and subject to extensive research. In this study, we present NO2 measurements via photolysis-
     chemiluminescence during the research aircraft campaign CAFE Africa (Chemistry of the Atmosphere - Field Experiment
5    in Africa) 2018 around Cabo Verde as well as the results of laboratory experiments to characterize the photolytic converter
     used. We find the NO2 reservoir species MPN (methyl peroxy nitrate) to produce the only relevant thermal interference in the
     converter under the operating conditions during CAFE Africa. We identify a memory effect within the conventional photolytic
     converter (type 1) associated with high NO concentrations and rapidly changing water vapor concentrations, accompanying
     changes in altitude during aircraft measurements, which is due to the porous structure of the converter material. As a result,
10   NO2 artifacts, which are amplified by low conversion efficiencies, and a varying instrumental background adversely affect
     the NO2 measurements. We test and characterize an alternative photolytic converter (type 2) made from quartz glass which
     improves the reliability of NO2 measurements in laboratory and field studies.

     1   Introduction

     NOx (nitrogen oxides) represent the sum of NO (nitric oxide) and NO2 (nitrogen dioxide) which can rapidly interconvert in
15   the atmosphere in the presence of sunlight and O3 (ozone) as shown in Reactions (R1) and (R2) (Jacob, 1999).

     N O + O3 → N O2 + O2                                                                                                       (R1)

                                                                   O
     N O2 + hν → N O + O(3 P )                             O(3 P ) −→
                                                                    2
                                                                      +O3                                                       (R2)

                                                                    1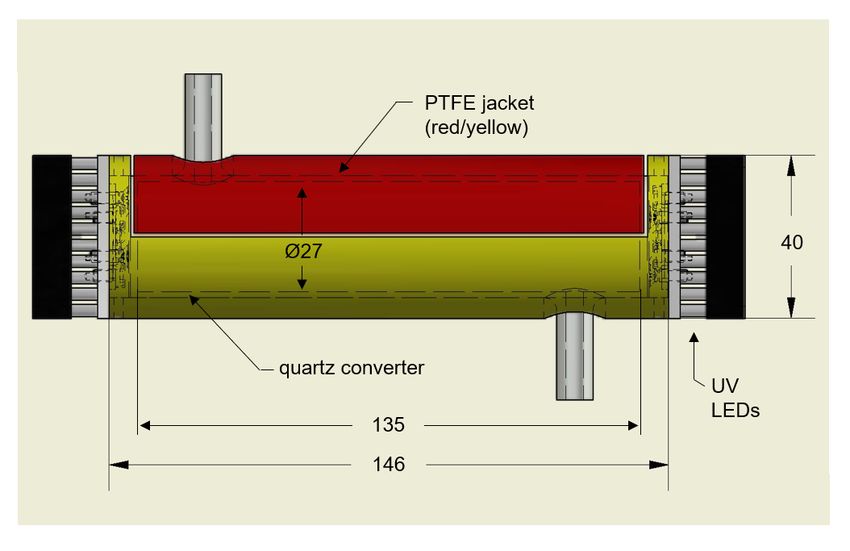
Considering only these two reactions in atmospheric NOx chemistry, the so called Leighton ratio represents NO2 , NO and O3
20   in photostationary state (PSS) as shown in Equation (1) (Leighton, 1961). kN O+O3 is the rate coefficient of Reaction (R1) and
     jN O2 is the photolysis frequency for NO2 in Reaction (R2).

     kN O+O3 × [N O] × [O3 ]
                             =φu1                                                                                                      (1)
         jN O2 × [N O2 ]
     Several studies have shown that the Leighton ratio as presented in Equation (1) is only valid for highly polluted environments
     whereas in other regions, besides O3 , oxidized halogen species and peroxy radicals (HO2 and RO2 ) significantly contribute
25   to the oxidation of NO to NO2 and require an extension of the Leighton expression for a reliable calculation of PSS NO2
     concentrations as presented in Sect. 2.4. (Mannschreck et al., 2004; Griffin et al., 2007; Ma et al., 2017; Reed et al., 2016).
       NOx can be emitted from either natural and anthropogenic sources, with the latter dominating globally. Natural emissions
     include for example biogenic soil emissions, biomass burning and lightning. Anthropogenic emissions are mainly from com-
     bustion processes in vehicles or from power and industrial plants which contribute almost two thirds to the global burden
30   (Pusede et al., 2015; Ganzeveld et al., 2002; Logan, 1983). Nitrogen oxides are, together with volatile organic compounds,
     important precursors to tropospheric ozone which can be a hazard to plant, animal and human health, causing multiple diseases
     regarding the cardiovascular and respiratory system (Nussbaumer and Cohen, 2020; Nuvolone et al., 2018; Lippmann, 1989).
     NOx additionally promote the formation of acid rain (through conversion to HNO3 ) - hazardous to many ecosystems - and
     are a threat to human health themselves (Boningari and Smirniotis, 2016; Greaver et al., 2012). Beyond that, NOx control
35   the abundance of OH radicals which regulate the oxidizing capacity of the atmosphere (Levy, 1971; Lelieveld and Dentener,
     2000). Due to the health implications and the impact on atmospheric photochemical processes, it is highly relevant to measure
     and monitor ambient NOx concentrations with sophisticated instruments which provide reliable concentration measurements,
     especially also in remote areas where NO and NO2 are low. More specifically, this requires a low instrumental background
     which - particularly for NO2 - is often impacted by unwanted chemical processes which can lead to artifact signals (Reed et al.,
40   2016; Andersen et al., 2020; Jordan et al., 2020).
       Many different measurement techniques have been deployed to measure nitrogen oxides such as cavity enhanced absorption
     spectroscopy (and variants, e.g. cavity attenuated phase shift spectroscopy (Ge et al., 2013; Kebabian et al., 2005), cavity ring
     down spectroscopy (O’Keefe and Deacon, 1988) and others (Zheng et al., 2018)), differential optical absorption spectroscopy
     (Hüneke et al., 2017; Winer and Biermann, 1994) and laser induced fluorescence (Thornton et al., 2000; Javed et al., 2019) for
45   NO2 or absorption spectroscopy for NO (Ventrillard et al., 2017). However, detection of NO and NO2 via chemiluminescence
     (CLD) is likely the most common technique for the measurement of nitrogen oxides in the atmosphere and is distinguished by
     the simultaneous in-situ measurement of both, NO and NO2 , low detection limits and the deployability in research aircrafts
     at high altitudes for measurements in the upper troposphere (Pollack et al., 2010; Reed et al., 2016; Tadic et al., 2020). The
     measurement principle is based on the reaction of nitric oxide and ozone which yields electronically excited NO2 (NO2 *) which
50   (along with physical quenching) returns to the electronic ground state by fluorescence whereby a photon of a wavelength
     > 600 nm is emitted, which can be detected by a photomultiplier tube. The resulting signal is proportional to the initial NO
     concentration (Clough and Thrush, 1967). For nitrogen dioxide detection, NO2 is first converted to NO. The standard method

                                                                     2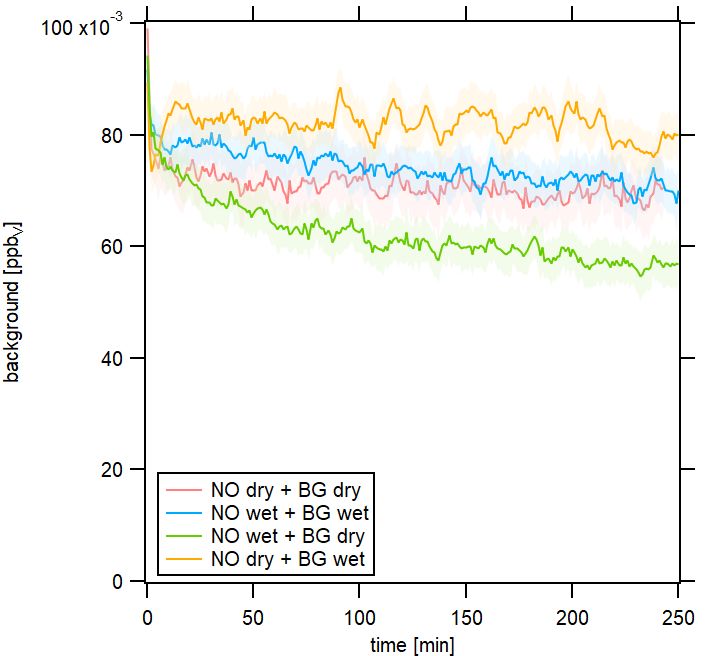
for this conversion is the use of a catalytic converter, in which NO2 passes through a heated molybdenum converter where it is
     reduced by Mo to NO (Mo + 3 NO2 → MoO3 + 3 NO). However, high temperatures (300 - 350 ◦ C) in the converter along with
55   catalytic surface effects lead to interferences with other atmospheric compounds that can be converted to NO2 such as HONO
     (nitrous acid), HNO3 (nitric acid) or PAN (peroxyacyl nitrate) and bias the measurement (Demerjian, 2000; Villena et al., 2012;
     Jung et al., 2017). An alternative and widespread method is the use of a photolytic converter (photolysis-chemiluminescence:
     P-CL), also referred to as blue light converter, which utilizes LEDs emitting at a wavelength of around 395 nm to dissociate
     NO2 to NO (Pollack et al., 2010; Reed et al., 2016; Tadic et al., 2020; Ryerson et al., 2000). Interferences (as described
60   above) in the blue light converter are still possible, but to a significantly lesser extent. Reed et al. (2016) investigated potential
     interferences in a photolytic converter which are related to the presence of PAN, methyl peroxy nitrate (MPN, CH3 O2 NO2 ) or
     pernitric acid (PNA, HO2 NO2 ). These compounds are NO2 reservoir species and their decomposition (to NO2 ) is dependent on
     the temperature, the pressure and the residence time in the blue light converter (Nault et al., 2015; Fischer et al., 2014). Please
     note that none of these compounds are photolyzed in the blue light converter and only subject to thermal decomposition (Reed
65   et al., 2016; Tadic et al., 2020). Generally, increasing temperature and residence time promote the decay of thermally unstable
     trace gases and the release of NO2 which is further described in Section 2.5 (Reed et al., 2016). With increasing residence time
     in the converter and high atmospheric HONO/NO2 ratios photolysis of HONO could become relevant as recently shown by
     Gingerysty et al. (2021).
       The CLD detects a signal (which we call NOc signal) which is composed of the ambient NO concentration and the ambient
70   NO2 concentration multiplied by the conversion efficiency Ce according to Equation (2).

     [N Oc ] = [N O] + Ce × [N O2 ]                                                                                                    (2)

       The conversion efficiency describes the fraction of NO2 that is converted to NO in the converter and can be thought of as the
     NO yield from NO2 . Its value is dependent on the optical output of the LEDs as well as the NO2 residence time and the pressure
     in the converter. Ce is therefore in competition with unwanted formation of NO2 from NO2 reservoir species. For example, a
75   longer residence time increases the conversion efficiency, but could potentially increase the amount of NO2 reservoir species
     that decay in the converter, which takes place according to first order kinetics which is described in more detail in Section
     2.5. The NO2 concentration is calculated from the difference in the signal with and without use of the photolytic converter:
     [NO2 ] = ([NOc ]-[NO])/Ce (Sadanaga et al., 2010; Tadic et al., 2020; Ryerson et al., 2000).
       While NO measurements are generally reliable and well-understood, NO2 measurement techniques utilizing the conversion
80   of NO2 to NO are subject to extensive research. Hosaynali Beygi et al. (2011) found a strong deviation from the Leighton
     ratio at low NOx concentrations between 5 and 25 pptv despite the inclusion of HO2 , RO2 and halogen oxides suggesting the
     occurrence of a so far unknown atmospheric oxidant. Frey et al. (2015) also reported higher measured NO2 /NO ratios than
     expected from PSS based on measurements in Antarctica and hypothesized the presence of an additional oxidant or a mea-
     surement bias. This is in line with findings and suggestions by Silvern et al. (2018) based on observations during the aircraft
85   campaign SEAC4 RS over the United States of America. Reed et al. (2016) examined the described deviation through the lab-

                                                                       3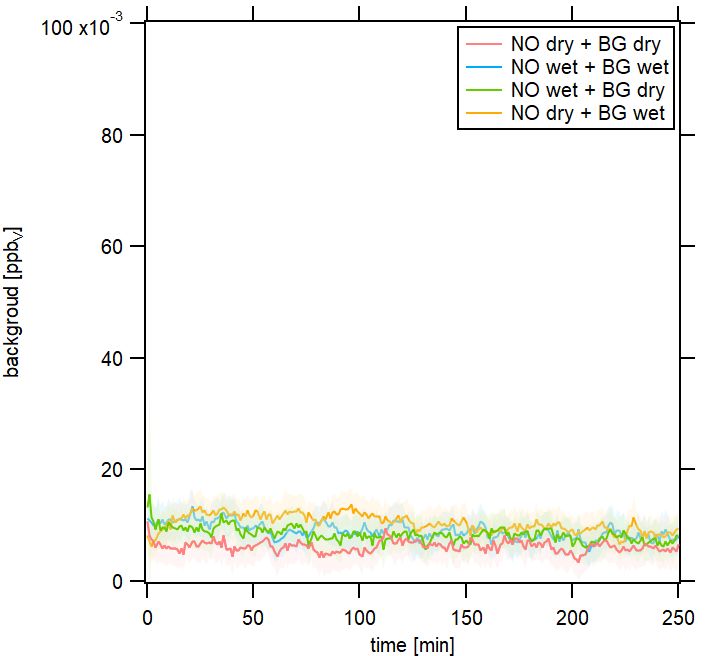
oratory investigation of potential NO2 interferences of thermally unstable trace gases such as peroxyacyl nitrate (PAN) within
      the photolytic converter in comparison to laser-induced fluorescent NO2 measurement and found that this could contribute to
      the higher than expected NO2 concentrations measured by P-CL instruments. Jordan et al. (2020) investigated interferences in
      a photolytic converter made from quartz glass and showed how the converter conditions affect the conversion efficiency and the
90    artifact signal (caused by NO2 reservoir species). The correct adjustment of the conditions, preferably including low pressure,
      high flow rates and small temperature variations, can minimize interferences which was also concluded by Reed et al. (2016).
      Andersen et al. (2020) reported the measurement of a significant NO2 measurement bias during ground-based observations in
      the remote marine tropical troposphere with a conventional blue light converter which was related to its porous walls. They
      were able to eliminate this effect by implementation of a photolytic converter made from quartz glass which reduced the overall
95    measurement uncertainty by around 50 %. The use of quartz glass in a blue light converter was also reported by Pollack et al.
      (2010) who compared the commercially available converter BLC-A manufactured by Droplet Measurement Technologies to
      other photolytic converters.
      An additional challenge is the significant decrease in the NO2 /NO ratio with altitude. At the surface at daytime, NO2 concen-
      trations are approximately two to four times higher than NO concentrations. The NO2 /NO ratio decreases by around one order
100   of magnitude when going from the lower to the upper troposphere which increases the uncertainty when deriving NO2 mixing
      ratios using Equation (2) (Travis et al., 2016; Silvern et al., 2018; Logan et al., 1981). At the same time, the concentration of
      NO2 reservoir species such as PNA or MPN is significantly higher in the upper troposphere compared to that at the surface and
      consequently interferences are more likely to occur at high altitudes (Nault et al., 2015; Kim et al., 2007). These aspects result
      in particularly strict requirements regarding airborne NO2 measurements.
105     In this study, we describe a modified blue light converter (BLC) (type 1) originally purchased from Droplet Measurement
      Technologies, which we have deployed in NO2 measurements via photolysis-chemiluminescence during the research aircraft
      campaign CAFE Africa (Chemistry of the Atmosphere: Field Experiment in Africa) and also in laboratory investigations. We
      show how high NO concentrations and rapidly changing water vapor concentrations affect the instrumental background and
      induce a memory effect which cannot be corrected retrospectively. This is particularly relevant to aircraft measurements where
110   water vapor concentrations are subject to rapid changes due to variations in flight altitude, but also to all other application areas.
      The photolytic converter and similar designs are widely used for field measurements of NO2 all across the world (e.g. Andersen
      et al. (2020); Jung et al. (2017); Xu et al. (2013); Breuninger et al. (2013); Fuchs et al. (2010); Reidmiller et al. (2010); Crowley
      et al. (2010); Sather et al. (2006)) and can provide reliable results for stationary use and locations with only little variations in
      ambient NO and low humidity levels, but suffer from enhanced uncertainty in other applications. We propose the elimination
115   of any direct contact points between the sample gas and the porous inner converter surface and have developed an alternative
      photolytic converter entirely made from quartz glass (type 2). Highly reflective properties are achieved by an outer mantel
      made from optical PTFE (polytetrafluoroethylene, also known as teflon). The type 2 quartz converter shows promising results
      in the laboratory regarding its application in field studies for more reliable NO2 measurements. We do not claim to be the
      first to present an alternative quartz glass converter for P-CL measurement of NO2 . However, we are first to point out the

                                                                        4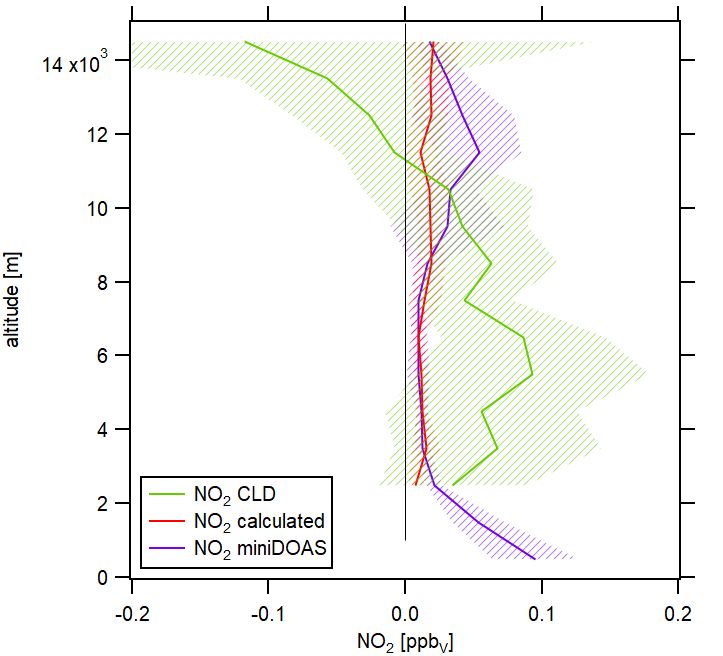
120 technical difficulties in the application of conventional NO2 converters in airborne studies and believe the presented results to
be a guidepost for future NO2 aircraft measurements via photolysis-chemiluminescence.
2 Observations and methods
2.1 Instrument
All NOx measurements were performed using a modified two-channel chemiluminescence instrument originally purchased
125 from ECO Physics, Dürnten, Switzerland (CLD 790 SR) as described by Tadic et al. (2020) (Figure 2 presents the instrument
schematic) operated at a total gas flow of 3 SLM, equally divided into the two channels. NO concentrations are measured in
the first channel, also referred to as the NO channel, through formation of NO2 * via reaction with O3 . The resulting excited
NO2 * emits a photon (> 600 nm) detected by a photomultiplier tube, preamplifier set up and recorded as counts per second.
The second channel, also referred to as NOc channel, is structurally identical except for the implementation of a photolytic
130 converter which converts a known fraction of NO2 to NO prior to the reaction with O3 and is operated at a constant pressure
of 110 hPa (105 hPa during the CAFE Africa field experiment). NO2 concentrations are obtained from the difference in counts
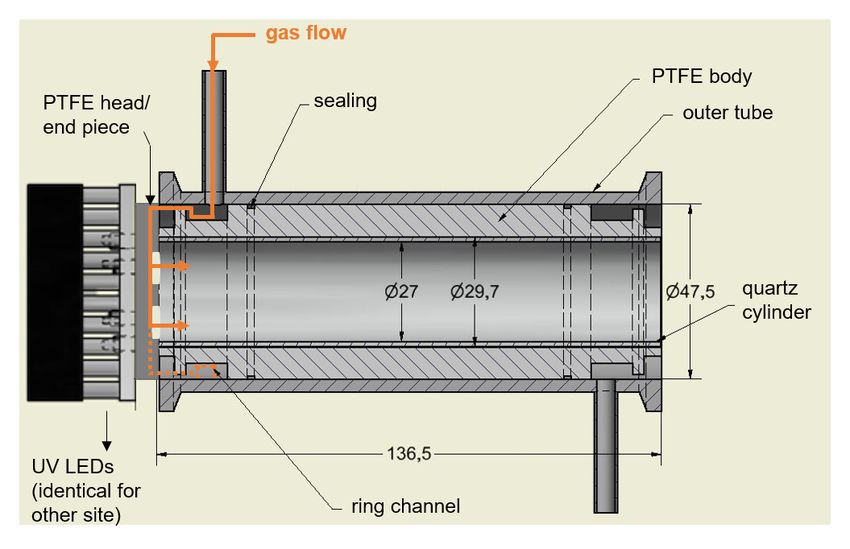
from each channel and the conversion efficiency Ce as described above (see Equation 2). We use a blue light converter (type
1) purchased from Droplet Measurement Technologies in 2005 (later Air Quality Design, now Teledyne API) equipped with
UV-LEDs emitting at a wavelength of 397 nm (FWHM = 14 nm, as characterized in the laboratory) which is shown in Figure
135 1a. The converter was designed for airborne applications. Originally, the inner material is made of porous, optically active
PTFE (polytetrafluoroethylene) for providing highly reflective properties. To reduce surface effects the converter was equipped
with a quartz cylinder covering approximately half of the PTFE surface (the gas still gets in touch with the PTFE surface in
the ring channel and through the head piece). Please note that this modification was made prior to the CAFE Africa research
campaign within a limited time frame and did not have the desired outcome. The sample gas enters the converter sideways into
140 the ring channel and reaches the inner tube via the PTFE head piece which has four circular recesses, one for each UV LED.
The sample gas outlet proceeds analogously. The inner volume of the converter is V = 78 cm3 which gives a residence time
V × 60 s min−1 p 78 cm3 × 60 s min−1 110 hPa
of t = × = × = 0.34 s. The conversion efficiency for this type 1
F pstandard 1500 cm3 min−1 1013 hPa
photolytic converter operated under the conditions described above is approximately 20 % (j = 0.66 s−1 ) which was determined
via gas phase titration (GPT) of NO with ozone. The results obtained with the described type 1 converter were compared to
145 an alternative photolytic converter completely made from quartz glass (type 2) which is shown in Figure 1b. For maintaining
the reflective properties of the type 1 blue light converter, the type 2 quartz converter was jacketed with optical PTFE which
provides diffuse reflectance of > 99 % in the wavelength range 350 - 1500 nm (SphereOptics GmbH, 2017). The PTFE material
was found to provide a higher conversion efficiency in the converter compared to aluminum foil and additionally provides
a stable housing for the sensitive quartz tube. The volume of the type 2 converter is 77 cm3 which gives a residence time
150 of t = 0.33 s and a conversion efficiency of approximately 14 % (j = 0.46 s−1 ) under the operating conditions. The applied
LEDs were purchased from LED ENGIN (San Jose, California, USA) (High Efficiency VIOLET LED Emitter LZ1-10UB00-
5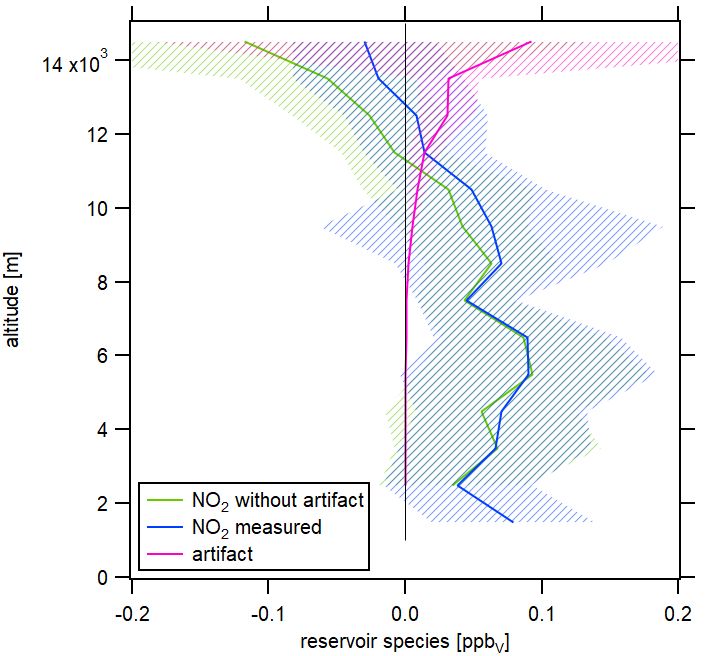
(a) type 1 blue light converter                           (b) type 2 photolytic quartz converter

      Figure 1. Sketches of the photolytic converters applied in this study.

      01U6, 2 - 2.2 W, 395 - 400 nm peak wavelength). Please note that the low conversion efficiencies in both converters result
      from the operation at low pressures which we have implemented to pursue aircraft measurements where altitude changes
      are accompanied by pressure variations. Operating the converter at lower than minimum ambient pressure levels (max. ∼
155   15 km flight altitude) has the benefit of a constant conversion efficiency. The fractional dissociation of thermally unstable NOx
      reservoir species increases with increasing pressure in the converter which can be seen in Figure S1a of the Supplement. On the
      other hand, a higher conversion efficiency would be desirable for improved accuracy of the measurement. The main difference
      between the two converters is that the sample gas flow does not have direct contact with the porous surface of the material
      for the type 2 quartz converter. Additionally, the sample gas flow in the type 2 quartz converter does not have contact with
160   the LEDs which likely minimizes the sample gas heating and consequently the thermal interferences when passing through
      the converter. The reaction chambers (where the reaction of NO and O3 takes places) are operated at a constant temperature
      of 25 ◦ C and a pressure of 9 - 10 mbar in order to minimize quenching of NO2 * by other molecules. The dry ozone flow is
      humidified with water vapor for maintaining a constant humidity level at all times.
        Besides the photons emitted from relaxation of NO2 *, the PMT signal also includes detected photons from interference
165   reactions, for example the reaction of O3 with alkenes (Alam et al., 2020), as well as a dark current signal. Therefore, a pre-
      chamber measurement is operated for 20 seconds every 5 minutes where ozone is added to the sample gas flow. The residence
      time in the pre-chamber allows for the reaction of O3 and NO and the relaxation of NO2 * before entering the main reaction
      chamber (pre-chamber efficiency > 96 % for the NO channel and ∼ 100 % for the NOc channel). It is not long enough to convert
      interfering compounds which then occurs in the following main chamber. Consequently during pre-chamber measurements,
170   the PMT signal only includes the interfering signal and the dark current signal (Ridley and Howlett, 1974; ECO PHYSICS AG,
      2002). We subtracted the interpolated signal obtained during pre-chamber measurements from the signal detected during main-
      chamber measurements in order to obtain the signal generated from NO. The material of both the pre- and the main-chambers
      is gold-plated stainless steel.

                                                                               6
The instrumental background of each channel is determined via zero (synthetic) air measurements from a gas cylinder and
175 can be converted to mixing ratios using calibration measurements with a known NO concentration which defines the sensi-
tivity (counts s−1 per ppbv (parts per billion by volume) of each channel towards NO as shown in Eq. (3) (after pre-chamber
corrections). The signal detected from zero air measurement (counts(zero air)) is subtracted from the signal detected from NO
calibration (counts(NO calibration)) and divided by the absolute concentration of the NO calibration (c(NO calibration)) to
calculate the sensitivity. Dividing the signal detected from zero air measurements by this value gives the instrumental back-
180 ground concentration in mixing ratios, e.g. ppbv. The precision is determined from the reproducibility of the NO calibrations
and is 3 % (1σ). The NO concentration is 4.96 ± 0.21 ppmv which gives a 4 % uncertainty on the used secondary standard.
The resulting NO calibration mixing ratio is 15.8 ± 0.7 ppbv. The detection limit is given by the reproducibility of the zero air
measurements which is around 5 pptv for the NO channel and the NOc channel using the type 2 quartz converter. The detection
limit is higher when using the type 1 converter, but difficult to determine due to the observed memory effects and estimated at
185 > 10 pptv.
counts(NO calibration) − counts(zero air) counts(zero air)
sensitivity = c(background) = (3)
c(NO calibration) sensitivity
Please note that the utilized zero air can include a trace concentration of NOx . The manufacturer specifies the maximum
concentration of NOx to be 0.1 ppmv (parts per million by volume) (Westfalen Gas Schweiz GmbH).
2.2 CAFE Africa field experiment
190 The CAFE Africa research campaign took place in August and September 2018 and included fourteen measurement flights
(MF03 - MF16) which were performed with the HALO (High Altitude Long Range) research aircraft starting from the cam-
paign base in Sal on Cabo Verde (16.75 ◦ N, 22.95 ◦ W). We included data measured during the measurement flights MF10,
MF12, MF13, MF14 and MF15 in this analysis (MF11 was a nighttime flight and therefore excluded) for which CLD NO2
measurements were available. An overview of the flight tracks is presented in Figure 2. A bypass line provided the instruments
195 with air from the aircraft inlet for which the residence time depended on the ambient pressure level (for high altitudes < 0.1 s).
The sample line temperature was approximately 25 ◦ C. More details on the campaign can be found in Tadic et al. (2021).
NO and NO2 were measured via photolysis-chemiluminescence with the instrument described in Sect. 2.1 using the type 1
conventional blue light converter equipped with the quartz glass cylinder, operated at a temperature of 313 K and a pressure of
105 hPa (0.32 s residence time). Please note that it was not possible to measure the temperature inside the converter. Instead, the
200 temperature of the gas outflow from the converter in the ring channel was measured which we equate to the inner temperature.
Zero air measurements and NO calibrations using a secondary NO standard (cylinder concentration of 1.187 ± 0.036 ppmv
and calibration mixing ratio of 2.97 ± 0.09 ppbv) were performed regularly to determine the variability in the instrumental
background and the sensitivity of the channels. The ambient measurement was interrupted every 1 - 2 h by one minute zero
air measurement, followed by one minute NO calibration and another one minute zero air measurement. These calibration-
205 background-cycles (CB-cycles) were performed 4 - 6 times during each measurement flight. We linearly interpolated these
7Figure 2. Geographic overview of the measurement flight tracks included in this analysis.
instrumental background and calibration measurements to each entire flight. The NO data were processed as described by Tadic
et al. (2021) (5 pptv detection limit at 1 min integration time and 6 % relative uncertainty (1σ)). Please note that the instrumental
background for the NO data was determined at 5.0 ± 5.3 pptv during a nighttime measurement on August 26, 2018 of NO as
presented by Tadic et al. (2021) and previously described by Lee et al. (2009). The instrumental background determined via
210 zero-air measurement was similar with 4 ± 7 pptv (Tadic, 2021) (measured four to six times per MF). For the NO2 data, the
NOc channel sensitivity and the instrumental background concentration were calculated after pre-chamber correction according
to Equation (3). The ambient NOc signal was divided by the channel sensitivity, accordingly. Final NO2 concentrations were
determined via Equation (4) which includes subtraction of the calculated (and interpolated) NOc instrumental background
concentration and the NO concentration in the NO channel, and dividing by the conversion efficiency of the blue light converter
215 which was 24.2 ± 2.8 % during the campaign.
c(NOc ) − c(backgroundNOc ) − c(NO)
c(NO2 ) = (4)
Ce
2.3 Further measurements
Additional measurements of atmospheric trace gases during CAFE Africa including O3 , CO, CH4 , HO2 , OH, NO2 and water
vapor as well as the photolysis frequencies jN O2 and jP N A were used in this study. O3 was measured via UV absorption and
220 chemiluminescence with the FAIRO (Fast AIRborne Ozone) instrument (total measurement uncertainty of 2.5 %, Zahn et al.
(2012). CO and CH4 were measured via quantum cascade laser absorption spectroscopy (total measurement uncertainty of
4.3 % and 0.3 %, respectively, Schiller et al. (2008)). HO2 and OH were measured with the custom-built HORUS (HydrOxyl
8Radical measurement Unit based on fluorescence Spectroscopy) instrument via fluorescence spectroscopy (Novelli et al., 2014;
Marno et al., 2020). Please note that these data are still preliminary and the measurement uncertainty is estimated at 50 %.
225 Additional NO2 concentrations for comparison were measured via differential optical absorption spectroscopy (miniDOAS)
with a detection limit of about 5 pptv and an uncertainty depending on the altitude and cloud cover of typically 40 pptv (Hüneke
et al., 2017; Kluge et al., 2020). Water vapor was measured via direct absorption by the tunable diode laser system SHARC
(Sophisticated Hygrometer for Atmospheric ResearCh) (accuracy of 5 %, detection limit typically in the range of 2 - 3 ppmv)
(Kaufmann et al., 2018). The photolysis frequencies were calculated from actinic flux densities measured with a spectral
230 radiometer (Meteorologie Consult GmbH, Metcon, Koenigstein, Germany) (uncertainty < 15 %) (Bohn and Lohse, 2017).
Please note that all measurement data were converted to a uniform timescale with a 1 min time resolution as a basis for this
analysis.
2.4 NO2 calculations
For calculating the photostationary state NO2 concentrations during CAFE Africa, we assume that NO2 production occurs
235 through reaction of NO with O3 (Reaction (R1)), HO2 (Reaction (R3)) and RO2 (Reaction (R4)). Tadic et al. (2021) showed
that RO2 is well represented by CH3 O2 during CAFE Africa via model simulations (80 % at 200 hPa altitude and up to 90 %
below) which we therefore use as surrogate for describing all organic peroxy radicals. In analogy to Leighton (1961), we
describe NO2 loss by photo dissociation as shown in Reaction (R2). Other loss pathways for NO2 for example via OH can be
neglected (< 1 %) (Bozem et al., 2017).
240 N O + HO2 → N O2 + OH (R3)
N O + CH3 O2 → N O2 + CH3 O (R4)
NO2 concentration in photostationary state can therefore be obtained via Equation (5) whereas the concentration of CH3 O2 is
calculated by help of Equation (6) which was derived by Bozem et al. (2017). For the calculation via Equation (6) we assume
245 that CH3 O2 and HO2 formation occur through CH4 and CO oxidation, respectively. We estimate an uncertainty of around 20 %
resulting from these assumptions. Propagating the measurement uncertainties of HO2 , CH4 and CO suggests a 50 % uncertainty
in the calculated CH3 O2 data. The NO2 PSS data have an uncertainty of 22 % regarding the trace gas measurements according
to Gaussian error propagation (uncertainty of rate coefficients is considered negligible).
[N O] × (kN O+O3 × [O3 ] + kN O+HO2 × [HO2 ] + kN O+CH3 O2 × [CH3 O2 ])
[N O2 ]P SS = (5)
jN O2
250
kCH4 +OH × [CH4 ]
[CH3 O2 ] = × [HO2 ] (6)
kCO+OH × [CO]
9The temperature dependent rate coefficients were obtained from the data sheets of the IUPAC Task Group on Atmospheric
Chemical Kinetic Data Evaluation (2021) (Atkinson et al., 2004, 2006).
2.5 Calculation of NO2 reservoir species
255 We consider the NO2 reservoir species PAN (peroxyacetyl nitrate), MPN (methyl peroxy nitrate) and PNA (pernitric acid). PAN
was measured during CAFE Africa via chemical ionization mass spectrometry (CIMS) (Phillips et al., 2013). MPN and PNA
were not measured and instead estimated via photostationary state calculations as suggested by Murphy et al. (2004). PNA
(HO2 NO2 ) production occurs through reaction of HO2 and NO2 (R5) while PNA loss is described by Reactions (R6)-(R8)
either through thermal decomposition, photolysis or reaction with OH (Veres et al., 2015; IUPAC Task Group on Atmospheric
260 Chemical Kinetic Data Evaluation, 2021; Atkinson et al., 2004). PSS HO2 NO2 concentrations can then be calculated via
Equation (7). k is the rate coefficient for each reaction and jP N A is the photolysis frequency for Reaction (R7).
HO2 + N O2 + M → HO2 N O2 + M (R5)
HO2 N O2 + M → HO2 + N O2 + M (R6)
265
HO2 N O2 + hν → products (R7)
HO2 N O2 + OH → products (R8)
k5 × [HO2 ][N O2 ]P SS
270 [HO2 N O2 ]P SS = (7)
k6 + jP N A + k8 × [OH]
MPN production and loss terms are in analogy to PNA as shown in Reactions (R9)-(R11) except for the reaction with OH
which is negligible (Nault et al., 2015; Browne et al., 2011; Murphy et al., 2004; Bahta et al., 1982). The calculation in PSS is
performed via Equation (8). k represents the rate coefficients and jM P N is the photolysis frequency for Reaction (R11). During
CAFE Africa, only the photolysis frequency jP N A was evaluated because reliable molecular data for MPN were missing. As
275 suggested by Murphy et al. (2004) we assume identical UV cross sections of MPN and PNA and therefore jM P N to be identical
with jP N A .
CH3 O2 + N O2 + M → CH3 O2 N O2 + M (R9)
10CH3 O2 N O2 + M → CH3 O2 + N O2 + M (R10)
280
CH3 O2 N O2 + hν → products (R11)
k9 × [CH3 O2 ][N O2 ]P SS
[CH3 O2 N O2 ]P SS = (8)
k10 + jM P N
In the photolytic converter PNA, MPN and PAN can decompose to NO2 depending on the temperature, the pressure and the
285 residence time t according to first order kinetics. The resulting NO2 artifact is determined via Equation (9).
[N O2 ]artif act = [HO2 N O2 ]P SS × (1 − exp(−k6 × t))
+ [CH3 O2 N O2 ]P SS × (1 − exp(−k10 × t)) (9)
+ [CH3 COO2 N O2 ] × (1 − exp(−kCH3 COO2 N O2 +M × t))
Gaussian error propagation gives an uncertainty of 55 % for the calculated PNA and MPN data. We use the residence time
according to the volume and the flow rate in the photolytic converter as described earlier. The actual value could deviate from
the calculated one due to unknown flow-dynamics and temperature gradients. Assuming 30 % uncertainty in the residence time
290 gives an overall uncertainty of around 60 % in the NO2 formed from PNA and MPN in the photolytic converter.
3 Results and Discussion
3.1 Aircraft measurements
3.1.1 NO2 reservoir species
Figure 3a shows the vertical concentration profiles of the NO2 reservoir species MPN and PNA according to photostationary
295 steady state calculations (Equations (8) and (7)) as well as PAN measurements during CAFE Africa. MPN concentrations were
close to zero at low altitudes up to 10 km and increased above, reaching 57 ± 40 pptv between 13 and 14 km altitude. The
concentration increased further aloft but had a large variability. PNA mixing ratios were low below 8 and above 12 km altitude
and showed peak concentrations of 54 ± 21 pptv between 9 and 10 km. PAN increased from ground level to mid-range altitudes
with a maximum of 383 ± 283 pptv at 4 - 5 km. Concentrations subsequently decreased with altitude, reaching 92 ± 44 pptv at
300 14 - 15 km. Figure 3b shows the NO2 artifact concentrations resulting from thermal decomposition of the reservoir species in
the type 1 blue light converter according to first order decay. It can be seen that only relevant artifact signals originated from
MPN of which more than 50 % decomposed to NO2 at the conditions present in the converter. 3 % of the ambient PNA was
11(a) NO2 reservoir species (b) NO2 artifact (c) temperature dependent decay
Figure 3. Vertical profiles of (a) NO2 reservoir species MPN, PNA (from PSS calculations) and PAN (measured during CAFE Africa) and
(b) NO2 artifacts in the blue light converter from reservoir species according to first order decay. The shaded plot areas present the 1 σ
standard deviation resulting from averaging the concentrations at each considered altitude range. (c) Temperature dependent decay of the
NO2 reservoir species in the type 1 blue light converter.
converted to NO2 . Even though atmospheric PAN concentrations, particularly at mid-range altitudes, were high, temperature,
pressure and residence time in the blue light converter were too low for PAN to decay to NO2 . As an overview, Figure 3c
305 shows the temperature-dependent decay (1 - c/c0 ) of the discussed NO2 reservoir species in the converter. The calculation is
based on constant pressure (105 hPa) and residence time (0.32 s). The temperature in the converter is shown with the black
dashed line. Increasing temperature increases the decomposition share. It can be seen that, for PAN and PNA, the converter
temperature would need to be significantly higher to observe a relevant decay (10 % decay of PNA at > 50 ◦ C and of PAN
at ∼ 80 ◦ C). In contrast for MPN, small changes in the temperature have a strong effect on the decomposing share (4 % per
◦
310 C at the steepest point). We show the time- and pressure-dependent decay of PAN, PNA and MPN in Figure S1 of the
Supplement. PAN and PNA decay only slightly depends on pressure at the given temperature and residence time. Please note
that the residence time and the pressure are correlated, which we have neglected in this calculation. Based on these results,
we recommend the implementation of a monitoring system for both temperature and pressure within the photolytic converter
which is difficult to implement in the type 1 blue light converter, but allows for a more accurate calculation of the decomposing
315 share and consequently a reliable correction of the NO2 signal.
We have subtracted the NO2 artifact signal arising from the decomposition of MPN and PNA from the CLD NO2 concen-
trations. Please note that the data coverage for the NO2 artifact from MPN is 55 % and from PNA is 48 % (difference due
to OH data coverage). We have interpolated the data used in the following sections to reach full coverage of the CLD NO2
concentrations. Sometimes the data were incomplete at the start or the end of a measurement flight in which case we considered
320 the averaged NO2 artifact signal according to the vertical profile shown in Figure 3b as a function of the altitude.
12(a) NO2 concentrations (b) differences in measurem. and calc. (c) CLD NO2 with and without artifact
Figure 4. Vertical profiles of (a) NO2 concentrations measured by the CLD, miniDOAS and calculated via Eq. (5), (b) the difference in NO2
concentrations from PSS calculations and measurements and (c) CLD NO2 concentrations with and without artifact. The shaded plot areas
present the 1 σ standard deviation resulting from averaging concentrations at each considered altitude range.
3.1.2 Atmospheric NO2 concentrations
Figure 4 shows the vertical profile of NO2 concentrations measured via CLD in green, miniDOAS measurements in purple
and NO2 from PSS calculations in red. Calculated PSS NO2 concentrations were on average 17 ± 14 pptv and approximately
constant over the considered altitude range. At high altitudes, NO2 from decomposing reservoir species exceeded the PSS
325 values by around a factor of five. NO2 concentrations measured by the miniDOAS instrument were 95 ± 31 ppt at ground level
and decreased with altitude up to 2 km. They were constant with 15 ± 16 pptv between 2 and 10 km altitude and agreed to
within ∼ 85 % to the calculated values. Concentrations increased again above reaching 54 ± 31 pptv between 11 and 12 km
and decreased aloft with values similar to PSS NO2 between 14 and 15 km. Average NO2 concentrations measured by the
CLD were 49 ± 76 pptv below 10 km altitude where decomposition of reservoir species did not play a role and decreased with
330 altitude above. Figure 4b shows the calculated difference in NO2 concentrations between PSS calculations and miniDOAS
measurements in black, and between PSS calculations and CLD measurements in gray. It is notable that NO2 concentrations
from PSS and miniDOAS measurements were nearly identical apart for a difference with a maximum value of 48 ± 4 pptv
between 10 and 13 km altitude. In contrast, CLD NO2 concentrations were higher by 45 ± 62 pptv compared to the calculation
up to 10 km altitude and lower at higher altitudes with a maximum deviation of more than 100 pptv between 14 and 15 km.
335 Figure 4a shows that the NO2 CLD mixing ratios are negative at high altitudes. This is an indicator of a wrongly measured
instrumental background signal in the second channel. If the determined instrumental background was too high, Eq. (4) could
return underestimated or even negative NO2 concentrations. However, the CLD NO2 data were not generally too small, but even
enhanced at lower altitudes compared to PSS and miniDOAS data which may indicate the contribution of additional factors
which we investigate in the following by the help of NO, H2 O and NO2 concentrations in the course of selected measurement
13340 flights. For comparison, Figure 4c shows the CLD NO2 data with and without the calculated artifact signal. It can be seen that
the data are already negative before the subtraction of decomposing NO2 reservoir species.
3.1.3 Influence of atmospheric water vapor
Atmospheric water vapor concentrations are highest at ground-level and decrease with increasing altitude. As an example,
the vertical concentration profile of atmospheric water vapor during CAFE Africa is shown in Figure S2 of the Supplement.
345 Accordingly, altitude changes during aircraft measurements introduce rapid changes in relative humidity to the instruments
on-board.
Figure 5 shows a time series of NO, water vapor, and calculated and measured NO2 concentrations during the measurement
flights MF10 (Figure 5a) and MF12 (Figure 5b). NO concentrations varied between 0.005 and 0.56 ppbv for MF10 and between
0.005 and 0.46 ppbv for MF12. We have recently shown that enhanced NO concentrations in the morning and afternoon
350 of MF12 were due to local, recent lightning activity (Nussbaumer et al., 2021). For MF10, enhanced NO concentrations at
high altitudes had their source over the African continent. At low altitudes, NO concentrations were close to zero as there
were no significant NO emissions in the marine boundary layer. Water vapor concentrations showed the expected inverse
correlation with the flight altitude with mixing ratios below the detection limit at high altitudes. As already suggested by the
vertical NO2 concentration profiles in Figure 4a, NO2 concentrations obtained from CLD measurements were lower than NO2
355 concentrations from miniDOAS measurements and PSS calculations (and sometimes even below zero) at high altitudes and
higher at low altitudes. Please note that the CLD NO2 data shown in Figure 5 were processed as described earlier. This includes
the interpolation of the instrumental background and calibration measurements which were performed 6 times for MF10 and 4
times for MF12. A potential variation of the instrumental background or the sensitivity of the channels between two CB-cycles
would therefore be unaccounted for. We show the instrumental background measurements in the top data trace of each subfigure
360 in Figure 5 by red dots and the interpolation as red dashed line. For MF10, the measured instrumental background in the NOc
channel varied between 85 and 127 pptv and for MF12 between 87 and 109 pptv. In comparison, the instrumental background
in the NO channel varied between 1 and 11 pptv for MF10 and between -2 and 6 pptv for MF12. We show the instrumental
background for MF10 and MF12 in each channel in Figure S3 of the Supplement. Calculated PSS NO2 concentrations ranged
between 1 and 93 pptv for MF10 and between 2 and 46 pptv for MF12. Local maxima mainly accompanied peaks of nitric
365 oxide which is a result of the NO dependence of Equation (5). NO2 concentrations measured by the miniDOAS instrument
varied between 2 pptv and 39 pptv for MF10. For MF12, concentrations were 15 ± 16 pptv and generally lower for low altitudes
and higher for high altitudes. NO2 concentrations measured by the CLD instrument ranged from -224 to 317 pptv for MF10
and from -153 to 384 pptv for MF12. It is striking that the maxima were obtained simultaneously with a sharp decrease in
altitude accompanied by an increase in water vapor concentration. For each measurement flight here shown, this phenomenon
370 was observed twice, indicated by the orange dashed lines. For example, the research aircraft descended from 12.6 km to 3.9 km
at 13:30 UTC during MF12. At the same time, the CLD NO2 concentration increased from an average of 23 ± 14 pptv between
13:00 and 13:30 UTC to its maximum of 384 pptv at 13:45 UTC when reaching the new lower flight altitude. Water vapor
measurements were incomplete before 13:00 UTC, but it can be assumed that they were constant and close to zero at 12.6 km
14(a) MF10
(b) MF12
Figure 5. Temporal development of the instrumental background (BG) in the NOc channel, NO, water vapor, and calculated and measured
NO2 for measurement flights 10 and 12. The orange dashed lines indicate the simultaneous occurrence of a rapid decrease in altitude, an
increase in water vapor concentration and a peak in the NO2 CLD data.
15altitude, rising to 9.5 ± 0.7 × 10³ ppmv on average after reaching 3.9 km (+ 15 minutes). Similar observations were made for
375 MF12 at 18:30 UTC and for MF10 at around 13:30 and 18:00 UTC, in each case accompanied by a decrease in altitude and
an increase in water vapor concentrations. The observed NO2 peaks appeared only for the CLD measurement, and not for
the values from PSS calculation or miniDOAS measurement which underlines the instrumental cause. The time series for the
measurement flights MF13, MF14 and MF15 shows similar results and can be found in Figure S4 of the Supplement.
We hypothesize that these observations were influenced by a surface effect in the type 1 blue light converter which has a
380 highly porous inner surface as described earlier. This material can adsorb atmospheric compounds, such as NO, and desorb
them at a later stage (for example supported by an increase in humidity), which we will refer to as memory effect in the
following. In a series of laboratory studies, we have investigated the impact of NO concentrations and humidity on the effects
described above and particularly in regard to the instrumental background.
3.2 Laboratory experiments and implications for CAFE Africa
385 We propose that the memory effect described in the previous section is strongly affected by NO molecules and is dependent on
changes in the introduced relative humidity. In order to show this, we have conducted different experiments in the laboratory
to investigate the instrumental background produced by the photolytic converter in the NOc channel. Beside NO and H2 O, we
suggest that one or more additional factors affect the observed instrumental background signal which are connected to the light
of the LEDs and which we discuss at the end of this section.
390 For the first set of experiments, we exposed the converter (LEDs switched-on) to 16 ppbv of NO for 2 h followed by 4 h
zero air measurements. The first experiment was carried out under dry conditions, sampling NO and zero air directly from
the gas cylinder. For the second experiment, we introduced water vapor by passing zero air through a washing bottle with
deionized water before entering the instrument. The thus obtained relative humidity was ∼ 95 % at ambient temperature and
decreased over time with decreasing water temperature (through evaporation). For the third and the fourth experiment, zero air
395 was humidified only for the zero air measurement and the NO measurement, respectively. We repeated the latter introducing a
lower relative humidity of ∼ 35 % and obtained the same result.
Figure 6 shows the temporal development of the instrumental background signal in ppbv in the NOc channel after 2 h NO mea-
surement with a concentration of 16 ppbv. The red line shows the experiment under dry conditions and the blue line presents
the experiment under humid conditions. For the yellow line, we performed the NO measurement under dry conditions and the
400 following instrumental background measurement under humid conditions. The green line shows humid NO measurement and
dry instrumental background measurement. Figure 6a presents the results obtained with the conventional blue light converter
modified with a quartz glass cylinder. All experiments showed a decreasing instrumental background signal over time in the
NOc channel. For comparison, the instrumental background signal in the NO channel over time is presented in Figure S5 of
the Supplement. The lines show no significant trend over time. This indicates that the converter adsorbs NO molecules, for
405 example during NO measurements, and desorbs them during zero air measurements. At t = 0 min, the instrumental background
signals for all experiments were approximately the same between 90 and 100 pptv, but showed a different development over
time. The strongest decline by around 25 % over 250 minutes was observed for dry instrumental background measurement
16(a) type 1 converter containing contact with porous PTFE (b) type 2 converter containing only contact with quartz
Figure 6. Instrumental background in response to dry and humid conditions after 2 h of NO calibration at 16 ppbv in the NOc channel. The
LEDs of the photolytic converter were switched on.
after humid NO measurement (green curve). For the opposite case, humid instrumental background measurement after dry
NO measurement, the signal decreased by around 5 % over the observed time period (yellow curve). Performing the whole
410 experiment under dry or humid conditions (red and blue curve, respectively) had a similar outcome with an instrumental back-
ground signal decrease of approximately 10 %. These observations indicate that the instrumental background measurements
in the NOc channel which were performed during CAFE Africa and used for the data processing according to Equation (4)
were consistently too high as they were only run for two times one minute (per CB-cycle) and therefore did not represent the
actual instrumental background but an artifact signal. In the laboratory, we observed the strongest effect for a dry instrumental
415 background measurement following a humid NO measurement which was a likely scenario for the ambient monitoring during
CAFE Africa as zero air for an instrumental background measurement was sampled from a gas cylinder (dry conditions) and
the measured ambient concentration was subject to ambient meteorological conditions. This would explain the occurrence of
negative NO2 concentrations obtained from CLD measurements as mentioned earlier. These experiments also suggest that
water molecules might not just promote adsorptive or desorptive processes, but participate in the surface allocation themselves
420 and compete with NO. Following this hypothesis, the surface spaces would fill with NO during an NO measurement under dry
conditions and with both, NO and H2 O molecules, under wet conditions. A subsequent instrumental background measurement
under dry conditions would then lead to NO (and possibly H2 O) desorption. For a subsequent instrumental background mea-
surement under humid conditions, H2 O molecules could actively replace NO molecules because of their higher surface affinity,
leading to a temporally longer "leakage" of NO and a slower decrease in the instrumental background signal. The described
17(a) type 1 converter containing contact with porous PTFE (b) type 2 converter containing only contact with quartz
Figure 7. Instrumental background (zero air measurement) when heating the switched off photolytic converter with a heat gun. The small
data gaps are due to prechamber measurements.
425 effect would be highest for a dry NO measurement which gives the maximum NO surface coverage and a wet zero air mea-
surement (yellow), while it would be lowest for the opposite case for which we observed the lowest instrumental background
signal after 250 minutes (green). This hypothesis fits well with the observations during CAFE Africa presented in Section 3.1.3
where we observed a sharp increase in the NO2 signal along with rapid increases in water vapor concentration. H2 O molecules
could replace adsorbed NO molecules (or other atmospheric compounds) which were detected by the CLD as an artifact signal.
430 Because of the conversion efficiency of 24.4 % of the type 1 blue light converter, the signal difference from the NO and the
NOc channel was multiplied by a factor of around four (compare Eq. (4)). Therefore, the resulting NO2 signal was distorted by
four times of the actual desorbed NO explaining the large peaks accompanying altitude descents. As we do not observe these
effects in the NO channel (and the two channels are structurally identical), we can exclude that any of the humidity effects are
caused by components in the instrument other than the photolytic converter.
435 We repeated the same laboratory experiments using the type 2 photolytic converter. The resulting temporal development of the
instrumental background is presented in Figure 6b which shows significant improvements compared to the type 1 converter.
The instrumental background in the NOc channel was many times smaller for the type 2 quartz converter with mixing ratios of
around 10 to 15 pptv and was, most importantly, constant over time. For stationary long-term experiments it could be possible
to measure the instrumental background on the scale of hours. However for aircraft measurements and the accompanying rapid
440 air mass changes due to the high aircraft velocity, it is vital to obtain a reliable instrumental background measurement within
a short time interval, which would be possible with the type 2 converter. Furthermore, changes in humidity did not seem to
18impact the measurement as all four experiments show the same result. This too, suggests the suitability of the type 2 converter
in aircraft measurements or generally field studies which are impacted by high and changing humidities. Performing zero air
measurements after NO2 measurements had a similar outcome for each of the applied converters. The instrumental background
445 measurement in the type 1 blue light converter showed a decreasing trend over time while it was constant and significantly
smaller in the type 2 quartz converter.
Our assumption that the observed effect is - at least partly - associated with NO molecules is supported by an experiment
where we heated the type 1 blue light converter with switched-off LEDs with a heat gun and observed a sharp increase in the
NOc channel during zero air measurement (following NO calibration measurement). The increase in temperature promoted the
450 desorptive process and had to include NO molecules. Otherwise, the CLD would not have detected any increase in the signal
as the converters’ LEDs were switched-off and NO2 could not form NO via the photolytic reaction. We show the result of
the heating experiment in Figure 7a. The converter surface was heated for two minutes (under constant movement of the heat
gun) at a distance of around 10 cm during zero air measurement. We estimate the surface temperature to not have exceeded
200 ◦ C. We observed a peak NO concentration of 2 ppbv (NOc instrumental background was 0 ppbv). In comparison, Figure
455 7b shows the experiment repeated with the type 2 quartz converter which showed a small increase in the NOc signal, too, but
approximately one magnitude smaller compared to the type 1 blue light converter. The qualitative outcome of this experiment
was the same with the LEDs switched-on as well as with preceding NO2 (instead of NO) measurement. Please note that a
direct comparison of experiments regarding adsorptive and desorptive processes with switched-on and -off LEDs is difficult
because the operation of the LEDs increases the temperature within the converter which - as shown above - strongly impacts
460 the surface allocation.
Beyond that, we performed an experiment to investigate how NO calibration measurements affect subsequent zero air mea-
surements in response to different NO concentrations. Figure 8 shows the influence of the preceding NO concentration level
on the following first 5 minutes of zero air measurement. We have performed 30 minute NO calibrations with NO concentra-
tions between 0.25 ppbv and 10 ppbv. Red data points represent the instrumental background of the NO channel and green data
465 points show the instrumental background of the NOc channel. Instrumental background concentrations in the NO channel were
independent of preceding NO concentrations. In contrast for the type 1 blue light converter, instrumental background concen-
trations in the NOc channel increased with increasing NO concentrations and leveled off for high values as shown in Figure
8a. Measured NO concentrations during CAFE Africa were between 0 and 1 ppbv and were therefore situated in the rising
part of the curve. That shows that instrumental background measurements during CAFE Africa were not only too high, but
470 also depended on the preceding NO concentration. We tried to retrospectively correct the NO2 data with a lower instrumental
background as obtained from laboratory investigations after several hours of zero air sampling. However, it was not possible
to quantify the effect of varying, preceding NO levels. Additionally, the impact of humidity had the exact opposite effect on
the NO2 measurements. While the higher than actual instrumental background led to lower than actual NO2 concentrations,
increases in humidity triggered higher than actual NO2 concentrations. Figure 8b shows that the development of the instru-
475 mental background in the NOc channel did not depend on the preceding NO concentrations for the type 2 quartz converter.
The instrumental background was 12 ± 1 pptv and constant over the whole experiment. The detected instrumental background
19(a) type 1 converter containing contact with porous PTFE (b) type 2 converter containing only contact with quartz
Figure 8. Instrumental background in response to different preceding NO concentrations under dry conditions. Each data point shows the
level of the signal of the first 5 minutes of instrumental background measurements after NO calibrations.
signal for the NOc channel disappeared when switching off the light of the UV-LEDs. A possible explanation can be a trace
concentration of NO2 in the utilized synthetic air as mentioned earlier.
While we have shown above that NO and humidity strongly affect the instrumental background measurements in the type
480 1 blue light converter, it is likely that there are other factors contributing to the observed effects, too. When switching off
the LEDs in the type 1 converter, the observed instrumental background decreased rapidly (too rapidly for a sole temperature
effect) which we present in Figure S6a of the Supplement. This suggests that the light of the LEDs impacts the instrumental
background in the NOc channel. Many other compounds can be photolyzed to form NO, such as PAN, ClNO2 or BrONO2 .
However, their absorption cross sections suggest no interference at 397 nm, the spectral output maximum of the LEDs (Reed
485 et al., 2016; Pollack et al., 2010). Only small interference could occur with HONO and NO3 at the edge of the spectral output
and this would require the presence of these compounds in the converter which should not be the case for the described
laboratory investigations, but is conceivable given the memory effect observations. For comparison, Figure S6b shows that the
effect of switching the LEDs on and off during zero air measurement is marginal when using the type 2 quartz converter. We
have performed an uptake experiment for HNO3 (nitric acid) to investigate the adsorptive capacity of the converters. HNO3
490 in zero air (2500 sccm) was first routed through a bypass and after reaching a constant signal, the gas flow was changed to
include the converter. The HNO3 concentration behind the converter was monitored via chemical ionization mass spectrometry
(CIMS). Figure S7a and S7b of the Supplement show the resulting adsorption behavior for the type 1 and the type 2 converter,
respectively. When directing the gas flow through the type 1 converter, the detected HNO3 flux decreased rapidly by around a
20You can also read


