Prey removal in cotton crops next to woodland reveals periodic diurnal and nocturnal invertebrate predation gradients from the crop edge by birds ...
←
→
Page content transcription
If your browser does not render page correctly, please read the page content below
www.nature.com/scientificreports
OPEN Prey removal in cotton crops
next to woodland reveals periodic
diurnal and nocturnal invertebrate
predation gradients from the crop
edge by birds and bats
Heidi L. Kolkert *
, Rhiannon Smith , Romina Rader & Nick Reid
Factors influencing the efficacy of insectivorous vertebrates in providing natural pest control services
inside crops at increasing distances from the crop edge are poorly understood. We investigated
the identity of vertebrate predators (birds and bats) and removal of sentinel prey (mealworms and
beetles) from experimental feeding trays in cotton crops using prey removal trials, camera traps and
observations. More prey was removed during the day than at night, but prey removal was variable
at the crop edge and dependent on the month (reflecting crop growth and cover) and time of day.
Overall, the predation of mealworms and beetles was 1-times and 13-times greater during the day
than night, respectively, with predation on mealworms 3–5 times greater during the day than night
at the crop edge compared to 95 m inside the crop. Camera traps identified many insectivorous birds
and bats over crops near the feeding trays, but there was no evidence of bats or small passerines
removing experimental prey. A predation gradient from the crop edge was evident, but only in some
months. This corresponded to the foraging preferences of open-space generalist predators (magpies)
in low crop cover versus the shrubby habitat preferred by small passerines, likely facilitating foraging
away from the crop edge later in the season. Our results are in line with Optimal Foraging Theory and
suggest that predators trade-off foraging behaviour with predation risk at different distances from
the crop edge and levels of crop cover. Understanding the optimal farm configuration to support
insectivorous bird and bat populations can assist farmers to make informed decisions regarding
in-crop natural pest control and maximise the predation services provided by farm biodiversity.
Finding solutions to reduce pesticide use in crops and enhance the abundance of natural enemies of crop pests
in agroecosystems is a pressing global issue. Worldwide, pests and diseases are responsible for an estimated
20–40% of crop yield losses1. Natural enemies can suppress insect pests below economic thresholds and therefore
provide a viable alternative to pesticide use2,3. Natural enemies of pests, including vertebrate and invertebrate
insectivores (birds, bats and arthropods) and insect parasitoids, provide a service worth billions of dollars to
global agriculture4–6. As such, natural pest control is one of the most important and economically significant
ecosystem services to a griculture7. Yet, many aspects of natural pest control in crops remain unclear. In particular,
the identity of the vertebrate predators providing this service is generally unknown and the efficacy of predation
inside crops at increasing distances from the crop edge is poorly understood. This information is important for
farmers who implement habitat modifications under agri-environmental schemes for natural pest control to
determine how far inside crops the benefits of non-crop habitat may extend.
Insectivorous birds and bats protect crops from pest arthropod damage and are economically important
natural enemies in agricultural s ystems8–14. Maintaining non-crop habitat for these natural enemies of crop pests
can therefore provide both ecological and economic benefits15. Birds and bats have high energetic demands due
to flight, and consume large amounts of prey to fuel high rates of energy expenditure16,17. Globally, 400–500 mil-
lion tonnes of arthropods are consumed by birds annually, with 50% of birds considered insectivorous and an
additional 25% of birds consuming invertebrates o ccasionally18. The efficacy of insectivorous birds in suppressing
Ecosystem Management, School of Environmental and Rural Science, University of New England, Armidale,
NSW 2351, Australia. *email: hkolker2@une.edu.au
Scientific Reports | (2021) 11:5256 | https://doi.org/10.1038/s41598-021-84633-8 1
Vol.:(0123456789)www.nature.com/scientificreports/
arthropods in agricultural and forest systems is well d ocumented19. Bird-mediated reductions in arthropod
abundance in crops typically vary from 20 to 70%12,19–21. For example, insectivorous birds significantly reduced
densities of large arthropods and damage due to foliage-chewing insects by 46% in cacao c rops21, and reduced
infestation of the coffee berry corer (Hypothenemus hampei) by 50%12. Similarly, predation of the corn earworm
by Tadarida brasiliensis (Brazilian free-tailed bat) is estimated to increase corn crop yields by 1.4%, with bats
tracking and exploiting moth irruptions22,23. In inland eastern Australia, agricultural pests comprised 65% of
the identified diet of insectivorous bats in cotton crops and were the six most frequently consumed prey items,
suggesting a significant pest regulation s ervice24.
Much of the work on insect pest control by insectivorous birds and bats has occurred in tropical forest
and agricultural production s ystems13,25–27, with few studies in subtropical or temperate agroecosystems, aside
from cotton crops in Northern America28, macadamia orchards in South Africa and A ustralia29, wheat11,30 and
brassicas31,32. Studies attempting to separate and quantify the insect pest control service provided by birds and
bats use e xclosures12,13,25,33, or plasticine model caterpillars as a proxy for lepidopteran c ontrol34. Although these
studies generally show that birds suppress more arthropods than bats, few link this service to pest consumption
rates and some, but not all, infer insect predation via reduced leaf herbivory and increased y ields34–37. Further-
more, the contribution of small nocturnal mammals to insect pest control is often overlooked, yet a growing
body of evidence suggests that they provide an important pest regulation service38,39.
Diurnal and nocturnal vertebrate predators suppress different groups of arthropods and thus impact trophic
processes (such as leaf herbivory) d ifferently12. Insectivorous bats mostly target soft-bodied Lepidoptera above
crops or glean from leaf s urfaces22,23, whilst small insectivorous passerines forage in the shrub layer from the
ground up and consume mainly ants, wasps, flies and beetles with a mean prey size of around 4–8 mm40–43. Larger
passerines consume a range of small and large invertebrates and provide effective pest control of fossorial scarab
larvae44 and above-ground pests including crickets, grasshoppers and beetles. Yet, remarkably little information
exists about the identity, predation rate or potential pest control service provided by the range of vertebrate fauna
present in any agricultural system.
Crop edge habitats provide a different physical and microclimatic environment compared with crop interiors.
The activity of vertebrate predators is often greater at crop edges than in crop i nteriors45,46, with a concomitant
increase in predation of invertebrates close to the crop e dge47,48. Crop edges provide flyways for foraging birds;
less complex echolocation for bats to navigate, target and catch prey than adjacent non-crop woody vegetation;
access to abundant crop insect prey resources, and reduced predation risk compared to crop interiors. Crop edges
are thus optimal foraging habitat for insectivorous birds and bats in agricultural mosaic landscapes due to access
to prey45,49. Under optimal foraging theory (OFT), foraging decisions made by an animal to maximise energy
consumption in the least amount of time possible are constrained by the detection, handling and capture of their
prey and the risk of predation of the foraging animal i tself50. Thus, foraging over open crops at increasing distance
from the crop edge—woody vegetation interface is a trade-off between flight capabilities, foraging behaviour and
the risk of predation. In terms of bats, echolocation constraints imposed by habitat clutter determine whether they
usually locate and capture prey in narrow or cluttered flyways, at habitat edges, or in open h abitats51,52. Whilst
edge-space bats typically forage along vegetation interfaces in open areas such as inside crops e dges53,54, most
bats show some plasticity in foraging strategy and echolocation behaviour54,55, suggesting the potential adaptive
capability for bats to forage away from the crop edge in the crop interior.
Cotton (Gossypium spp.) is a fibre crop and the most valuable non-food agricultural commodity w orldwide56.
However, cotton is also the second-top global host for arthropod pests, with several cotton pests considered
major pests w orldwide57. Hence, the control of insect pests (particularly Helicoverpa spp., cotton bollworms) is
a major issue. Integrated pest management (IPM) in Australian cotton crops typically includes encouraging a
mix of beneficial arthropods (such as predatory beetles and parasitic wasps)6,58–61, transgenic crop biotechnol-
ogy and minimising pesticide use. The effectiveness of IPM in Australian cotton crops would be enhanced with
information about the diversity of vertebrate predators providing natural pest control. Cotton-growing regions
in northern New South Wales (NSW) and southern Queensland host an abundance of naturally occurring
vertebrate predators more than one-third of all Australian land b irds62,63, over one-quarter of insectivorous bat
species (H. Kolkert et al., unpublished data) and several threatened insectivorous marsupial dasyurids and other
small native rodents—that likely play an integral role in suppressing insects in crops, but are underutilised in
IPM programs. In this study, we identified vertebrate predators and assessed predation rates in cotton crops
across the growing season. We used a combination of prey removal trials and camera traps in cotton crops at
incremental distances from the crop edge as well as bird census, to investigate predation rates of diurnal and
nocturnal vertebrate predators on two types of sentinel prey (live mealworms and dead beetles). Ants interacted
with prey at feeding stations and were identified as possible important predators and were also included in our
analysis. We asked four questions: (1) Which vertebrate taxa are present and remove insect prey in cotton crops?
(2) Is predation greater by day or by night? (3) Does proximity to the crop edge influence prey removal? (4) How
do prey removal rates change over the cotton growing season?
Results
Mealworm removal. Around 11% (1814) of mealworms were removed out of the 16,300 provided, ased on
3260 sampling observations across an Australian summer cotton growing season. Mealworms were 12.5% more
likely to be taken by day than night (Odds Ratio [OR] 0.88, Supplementary Table S2 online). More mealworms
were also removed later in the season (Fig. 1a). In February and March, diurnal mealworm predation doubled,
whilst nocturnal mealworm predation increased five-fold compared to December and January.
Distance from the crop edge significantly affected mealworm predation but depended on month (Fig. 1a) and
time of day (Table 1, Fig. 1c). Over the whole season, 3–5 times more mealworms were removed at the crop edge
Scientific Reports | (2021) 11:5256 | https://doi.org/10.1038/s41598-021-84633-8 2
Vol:.(1234567890)www.nature.com/scientificreports/
Figure 1. Mean number of (a) mealworms and (b) beetles removed, averaged over feeding station and
sampling session by month (with 95% confidence intervals) and (c) predicted removal of mealworms at
increasing distances from the crop edge by time of day (day vs night) and month, showing the 3-way interaction.
Shaded areas represent 95% confidence intervals.
than at 95 m inside the crop during the night and day, respectively (Fig. 1c and Supplementary Table S3 online).
Predation on mealworms did not vary with distance into the crop in December (Fig. 1c and Supplementary
Table S3). In January, predation on mealworms significantly declined with increasing distance from the crop edge
and similarly by night in February (Fig. 1c and Supplementary Table S1). However, at night in March, this trend
reversed and more mealworms were removed in the crop interior than edge (Fig. 1c and Supplementary Table S3).
Scientific Reports | (2021) 11:5256 | https://doi.org/10.1038/s41598-021-84633-8 3
Vol.:(0123456789)www.nature.com/scientificreports/
Mealworm removal Beetle removal
Factors Chisq Df p-value Chisq Df p-value
(Intercept) 40.174 1 0.000 0.459 1 0.498
Time of day 12.926 1 0.000 24.054 1 0.000
Distance 0.019 1 0.890 1.746 1 0.186
Month 7.707 3 0.052 48.702 3 0.000
Time of day: Distance 0.355 1 0.551 0.202 1 0.653
Time of day: Month 14.734 3 0.002 15.210 3 0.002
Distance: Month 10.898 3 0.012 2.316 3 0.509
Time of day: Distance: Month 21.463 3 0.000 1.785 3 0.618
Table 1. Analysis of Deviance Table (Type III Wald chi-squared tests) for mealworm and beetle predation,
showing the chi-squared statistic (Chisq), degrees of freedom (Df) and p-value. Significant probabilities are
shown in bold.
Number of tagged
images Visitation rate Visitation length
Daylight Nocturnal
Daylight Nocturnal AI/h AI/h
Daylight Nocturnal CT/h CT/h (min s) (min s)
Month
December 61 393 0.93 6.34 4.31 0.13
January 2 430 0.03 23.76 0.00 0.24
February 12 48 0.15 0.99 0.42 0.01
March 14 12 0.15 0.14 0.04 4.61
Total 89 883 *0.32 *7.81 *1.19 *1.25
Distance from crop edge by month
Close 55 712 *0.22 *6.88 *0.95 *0.07
December 39 316 0.69 5.14 3.80 0.05
January 2 390 0.03 22.31 0.00 0.22
February 6 6 0.04 0.06 0.00 0.00
March 8 0 0.11 0.00 0.00 0.00
Far 34 171 *0.10 *0.93 *0.24 *1.18
December 22 77 0.25 1.20 0.51 0.08
January 0 40 0.00 1.45 0.00 0.01
February 9 44 0.12 0.93 0.42 0.01
March 3 10 0.04 0.14 0.04 4.61
Total 89 883 *0.16 *3.90 *0.60 *0.62
Table 2. The number of tagged images from camera traps, the visitation rate expressed as camera trap images
per hour (CT/h) and the visitation length expressed as an activity index (AI/h). Average visitation rate and
length denoted with an asterisk. Bold values indicate a significant p-valuewww.nature.com/scientificreports/
(a) Fauna Day Night Total
Aves Dec Jan Feb Mar Dec Jan Feb Mar
Australian magpie (Gymnorhina tibicen) 61 2 – – – – – – 63
Southern boobook (Ninox boobook) – – – – – – – 1 1
Eastern barn owl (Tyto alba) – – – – – – 1 – 1
Pied butcherbird (Cracticus nigrogularis) – – – 6 – – – – 6
Willie wagtail (Rhipidura leucophrys) – – 12 8 – – – – 20
Mammals
Insectivorous bat sp. – – – – 390 430 46 9 875
Other small mammals – – – – 3 – 1 2 6
Total 61 2 12 14 393 430 48 12 972
(b) Fig Morning Evening
Fauna Dec Jan Feb Mar Dec Jan Feb Mar Total
Golden-headed Cisticola (Cisticola exilis) – – 13 13 – 1 9 9 45
Inland thornbill (Acanthiza apicalis) – – 1 10 – – – 7 18
Australian magpie (Gymnorhina tibicen) 10 1 7 2 5 – – 3 28
Nankeen kestrel (Falco cenchroides) 1 – – – – – – – 1
Pied butcherbird (Cracticus nigrogularis) – – – 1 – – – – 1
Red-browed finch (Neochmia temporalis) – – – 9 – – – – 9
Superb fairywren (Malurus cyaneus) – – 12 14 – – 15 13 54
Willie wagtail (Rhipidura leucophrys) – 1 7 – 1 1 3 1 14
Total 11 2 40 49 6 2 27 33 170
Table 3. Fauna species recorded. Number of (a) tagged images by time of day vs night and month (December
to March) recorded by motion-activated cameras (b) fauna species recorded during 20-min observations of the
sampling areas during morning and evening sampling sessions. Columns represent the abundance of species
during the morning and evening sampling and during each month (December to March).
Australian magpie (Gymnorhina tibicen) and pied butcherbird (Cracticus nigrogularis). Nocturnal mammals
could not be confidently identified to species level and were grouped as either insectivorous bats or other small
mammals (Table 3a).
Australian magpies were the main predators during the day (and were the main consumer of beetles, H. Kolk-
ert, pers. obs.) whilst camera traps (CT) revealed that insectivorous bats were the main predator in crops during
the night (Table 3a). However, bats were not captured on camera gleaning experimental prey or landing on the
feeding trays. Rather they were captured foraging above the cotton close to the feeding trays. Insectivorous bats
were present in 10-times more images than diurnal fauna (birds), with most visitations (tagged images) occurring
in December and January. At night, January had the highest visitation rate to feeding trays (~ 24 CT/h; Table 2).
In the day, December had the highest visitation rate and length of visits (measured as an activity index, 0.93
CT/h and 4 m 31 s AI/h; Table 2) with magpies responsible for nearly all the prey items removed from feeding
stations, as indicated by camera trap images. Visitation length at night (in March) was strongly skewed by two
incidents where a small scansorial mammal sat on the feeding station for several hours. During the day, twice
as many visits were recorded close to the cotton edge than inside the crop (Table 2). At night, seven times more
visitations were recorded close to the cotton edge than inside the crop. However, visitation length was the inverse,
skewed by the lengthy small mammal visits. Hence, visitation length was not a reliable predictor of prey removal
in this experiment.
Birds, scats and ant counts. Eight species of bird were recorded in the sampling areas, totalling 170 bird obser-
vations (Table 3b). Mean monthly bird richness, bird abundance, ant abundance and scat abundance during
morning and evening censuses were greatest late in the season (February and March) compared to earlier in the
season (Fig. 2). This pattern reflects the monthly pattern of mealworm predation (Fig. 1a). Potential predators
and climate variables were significantly correlated with patterns of mean total prey removal, mealworm removal
and beetle removal rates, but the relationships were weak (r ≤ 0.16, Table S4). Additional species of small insec-
tivorous bird were noted inside cotton crops, but these were recorded outside the sampling areas (H. Kolkert,
pers. obs.).
Discussion
Understanding the optimal timing and location of beneficial insectivorous birds and bats can support decision-
making to configure farm layout to maximise the insect pest predation services provided by farm biodiversity.
In this study, we identified diurnal and nocturnal vertebrate insectivores that were present or removed experi-
mental prey in a high-value commodity crop. A clear predation gradient from the crop edge was identified, but
the gradient was only evident in some months. The variation in mealworm removal rates likely reflects preda-
tor foraging behaviours in response to crop cover versus open habitat, in-line with O FT64. For example, small
Scientific Reports | (2021) 11:5256 | https://doi.org/10.1038/s41598-021-84633-8 5
Vol.:(0123456789)www.nature.com/scientificreports/
Figure 2. Mean (a) ant abundance, (b) scat abundance, (c) bird species richness and (d) bird abundance per
morning and evening sampling session averaged by month with 95% confidence intervals.
insectivorous passerines (thornbills, cisticolas and fairywrens) are cover-dependent and were present in crops
later in the growing season (Table 3b), when established cotton plants provided greater foliage cover, shelter, and
protection from predators. Mature, shrubby cotton (mainly ~ 150 cm, but up to 200 cm high) facilitated small
bird movement and access inside the crop, and best explained the lack of mealworm predation gradient from
the edge into the crop during March. Increased foraging opportunities for cover-dependent species during Feb-
ruary and March may also explain the higher mealworm removal rate (both by day and by night) than in other
months. The lack of predation gradient in mealworm removal in December may be attributed to the absence of
small birds traversing the sharp interface between crop edge habitat and the open field of young cotton. The low
height and foliage cover of cotton plants (~ 30 cm high) in December also favoured larger birds of open habitat
(Australian magpies) that are less sensitive to foraging away from the crop edge. These results support previous
studies that identify shrubby habitat as a mediating factor for the movement of small birds across contrasting
edge habitats in agricultural and forest systems45,65. It also highlights the importance of sufficient understorey
cover in habitat immediately adjacent to the crop for edge-sensitive insectivorous birds and bats to facilitate
movement and foraging in crops.
The removal of beetles primarily by the Australian magpie and peak beetle removal in December suggest
that generalist predators suited to hunting in open habitat are less sensitive to crop edge proximity (moving
throughout the crop), and explains the lack of an edge predation gradient early in the season. Increased foraging
opportunities that benefit ground-feeding omnivores like Australian magpies occur early when ground cover
is sparse. Therefore, our results suggest that predators favouring open foraging habitat benefit farmers during
the initial stages of crop development (when bare soil is exposed). Small insectivorous birds did not consume
beetles from feeding stations, to our knowledge. The size of the prey items offered may have excluded smaller
predators from the experiment due to differences in prey size and thus availability to predators. This highlights
the importance of maintaining predator functional diversity in farming landscapes in order to suppress different
sized pest species for integrated pest control66,67.
Scientific Reports | (2021) 11:5256 | https://doi.org/10.1038/s41598-021-84633-8 6
Vol:.(1234567890)www.nature.com/scientificreports/
Camera trap images also indicated that more visits occurred closer to the crop edge, by day and night
(Table 2). However, small passerines were not captured on camera traps (Table 3b) and their contribution to prey
removal was uncertain. Whilst more prey items were generally removed from feeding stations during the day, a
greater number of camera images (mainly of insectivorous bats) were tagged at night. Maximum insectivorous
bat activity was recorded in January (which corresponds to young bats becoming volant); yet experimental prey
removed from the feeding stations was least in this month. Newly volant bats may not have removed prey from
feeding stations because the predation risk was too high, due to reduced crop cover. A similar finding by Nelson
and Gillam68 showed that during vulnerable life stages (pregnancy and lactation), bats prefer edge habitat due
to the reduced predation risk. Furthermore, we hypothesise that, like birds69,70, newly volant juvenile bats are at
greater risk of predation than adult bats, and that bold risk-taking behaviour in foraging bats increases with age.
This may explain the high nocturnal mealworm removal in February and March, but not January.
Images of insectivorous bats did not necessarily reflect prey removal, although the presence of bats in the crop
presumably inferred foraging behaviour and it is likely that bats were responsible for some mealworm removal
with gleaning bat species present (Kolkert et al. unpublished data). This highlights the fact that artificial prey
experiments may not accurately reflect the predation service to be estimated. Bats captured on camera were
likely foraging for alternate food resources in the crop i.e. abundant crop insects. This suggested that bats were
selecting a preferred food source inside the crop (i.e. moths), consistent with Optimal Foraging Theory (OFT),
that predicts when prey is abundant (i.e. ~ 450 species of cotton insects) predators become selective with prey
choice. Insectivorous bats in this area are known to consume agricultural arthropods, particularly moths, in cot-
ton crops24. Therefore, bats captured on camera were likely hunting moths. This finding suggests the potential for
camera traps to infer predation rates of crop pests by insectivorous bats in cropping agroecosystems. Further work
is needed to calibrate the number of camera trap images of bats with pest predation and consumption volumes.
Artificial predation experiments are limited as they do not accurately reflect the visual, behavioural or physi-
ological cues relied on to detect p rey71–73. Although we attempted to account for predator cues by using live
mealworms and regionally abundant dead beetles, beetles do not comprise a large component of insectivorous
bat diets in crops in this region (H. Kolkert et al., unpublished data) and are less nutritious than m ealworms74,
which may explain why more mealworms were removed, and why the effects of proximity to crop edge were
stronger with mealworms. For these reasons we suspect mealworms were the preferred food item for other
small insectivorous birds, such as fairywrens, cisticolas and willie wagtails, with larger generalist predators, such
as owls, tawny frogmouths, Australian magpies, also consuming beetles. Prey choice and participation in the
predation experiment for a variety of predators was likely influenced by the abundant and diverse insect supply
in the Bt-cotton61,72. It is possible that that attack rates on experimental prey may be under-inflated due to low
predation pressure72. Nevertheless, we attempted to provide live stimuli and different sized prey to encourage
participation in the experiment by a diversity of insectivore predators.
Future studies should aim to test other prey resources (potentially pest species) to further understand forag-
ing mechanisms and prey selection by whole predator communities at the crop edge. Regardless, our camera
trap and experimental prey removal results suggest that insectivorous predators forage in crops as predicted by
OFT50, where the trade-off between resource maximisation and the risk of predation of the predators increased
away from the crop edge. Whilst this was also true for bats, it is likely that echolocation constraints also con-
tributed to foraging closer to the crop edge. Knowing that fear of predation, rather than food availability drives
the spatial foraging patterns of insectivorous predators close to the crop interface (except for large generalist
open space foragers like Australian magpies) can encourage land managers to provide suitable non-crop habitat
adjacent to crop edges.
In conclusion, our results showed clear patterns between the removal of sentinel insect prey in crops, proxim-
ity to the cotton crop edge and the presence of potential predators. Information should be provided about how
to encourage open space generalist predators early in the growing season and cover-dependent small passerines
later in the season for pest control of different sized insects. Furthermore, information about the predation
gradient from the crop edge and the rate of change in natural pest control with increasing distance into the crop
over the growing season can be used to measure the outcome of biodiversity modifications on farms to benefit
natural pest control. We conclude that optimal natural pest control in cotton at different phenological stages
likely occurs via a diversity of predator functional groups. Maintaining a mix of structural vegetation components
adjacent to the crop edge75 could buffer the variability in predator communities, particularly small passerines
that avoid open habitat.
Methods
Ethics. Animal ethics approval was obtained from the University of New England Animal Ethics Committee
(approval no. AEC13-060) in addition to a New South Wales (NSW) scientific licence (licence no. SL101296)
issued by the NSW Office of Environment and Heritage. All methods were performed in accordance with the
relevant guidelines and regulations.
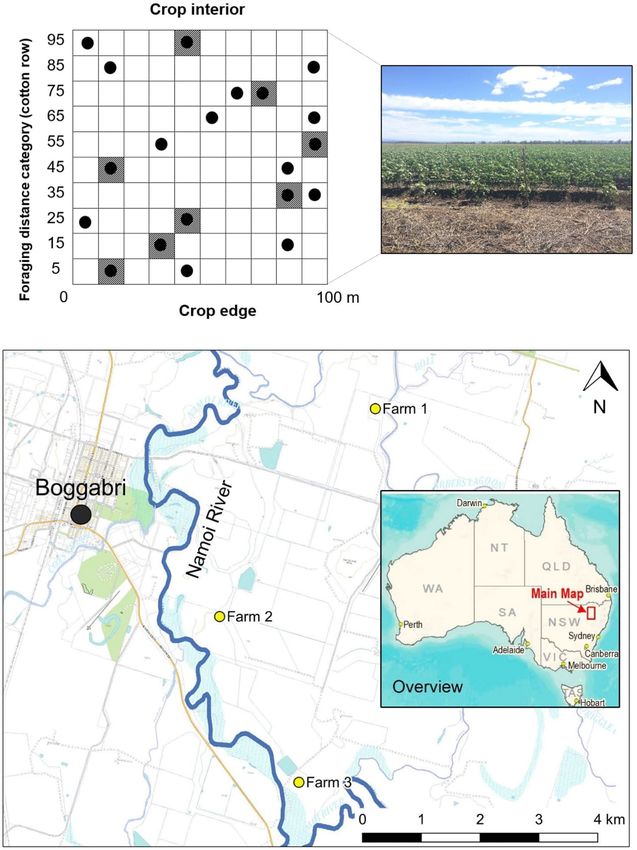
Study sites. This research was conducted during the 2014–15 summer cotton growing season on three irri-
gated cotton farms near Boggabri (30°43′15.4"S 150°04′52.5"E) in northern NSW, Australia (Fig. 3). The com-
bined farm area totalled 1654 ha, with 925 ha dedicated to irrigated cotton, 185 ha to dryland cotton, 335 ha to
grazing and the remainder to houses, outbuildings, roads and irrigation channels. The research took place in
three fields of irrigated cotton (one on each farm): 45 ha, 25 ha and 12 ha in size. The distance between each field
was 4.0 km, 2.5 km and 6.0 km respectively. Cotton was planted in early October 2014 and no insecticide was
applied during the growing season. At these farms (consistent with cotton grown in subtropical zones around
Australia), the cotton flowers around December, cotton bolls develop in January and vegetative growth peaks
Scientific Reports | (2021) 11:5256 | https://doi.org/10.1038/s41598-021-84633-8 7
Vol.:(0123456789)www.nature.com/scientificreports/
Figure 3. Location and example of the trial design at each farm showing a 100 × 100-m sampling area. The
y-axis indicates the foraging distance (cotton row) from the edge of the cotton crop. Circles represent feeding
stations (n = 20) and hatched cells indicate the location of a camera trap (n = 8).
around February. By March the majority of bolls open and crop harvesting occurs between March and April.
Irrigated Bollgard II cotton was grown on these farms, planted in a configuration of one row of cotton per
metre. Bollgard II cotton (Bt-cotton) contains two genes derived from the soil bacterium, Bacillus thuringiensis,
producing toxins that are lethal to the larvae of Lepidoptera. About 10% of the cropping area at each farm was
dedicated to unsprayed refuge crops (non-Bt, cotton and pigeon pea). Refuge crops delay the resistance of moths
to the Bt toxin, by allowing Bt-resistant and Bt-susceptible moths to mate and disperse in crops.
These farms occur in the sub-tropical Brigalow Belt South B ioregion76 on black self-mulching clay alluvial
77
plains adjacent to the Namoi R iver . Remnant vegetation adjacent to each cotton field was predominantly for-
est, floodplain woodland and semi-arid grassland78 most commonly dominated by river red gum (Eucalyptus
camaldulensis) open woodland associated with the Namoi River and adjacent floodplain. Native vegetation
adjacent to each cotton field was unmanaged and extended along the entirety of the Namoi River in the region.
Scientific Reports | (2021) 11:5256 | https://doi.org/10.1038/s41598-021-84633-8 8
Vol:.(1234567890)www.nature.com/scientificreports/
Trial design. At each farm, a 100 × 100 m (1 ha) sampling area of cotton crop was selected adjacent to rem-
nant vegetation. Each 1 ha sampling area was divided into a 10 × 10 m grid with ten successive predation dis-
tances from the crop edge and ten successive bands of cotton, perpendicular to the crop edge. The first predation
distance was 5 m from the edge of the crop (fifth row of cotton) with subsequent predation distances at 10-m
intervals (15, 25 … 95 m; Fig. 3). At each predation distance, random number generation determined in which
band a feeding station was placed. Each feeding station consisted of a plastic green tray (250 × 250 × 40 mm)
nailed to a wooden stake, 1 m above the ground in the cotton row and left in situ for the duration of the experi-
ment (total n = 60, 20 sampling points per site with two stations per distance). The possibility of predators learn-
ing the location of feeding stations and associating them with a food resource was accounted for by leaving the
stations in-situ outside of sampling times.
Previously frozen and thawed Sericesthis geminata (Scarabaeoidea, Coleoptera, collected in Armidale and
Boggabri, NSW) and live mealworms (the larvae of Tenebrio molitor; Pisces Enterprises) were placed on each
feeding station to simulate a prey resource. Experimental trials indicated that live Helicoverpa armigera larvae
(Lepidoptera: Noctuidae, a major pest of cotton) could not withstand the heat of the day (≥ 40˚C) on the feeding
station. This led to the decision to use live mealworms with a hard exoskeleton and beetles to attract a diversity
of predators. Sericesthis geminata are common in Boggabri during the cotton growing season and emerge en
masse and swarm on warm nights. It is plausible that nocturnal fauna including insectivorous bats were attracted
to this prey resource.
Each feeding station had 15 mealworms (15–20 mm long, 3 mm diameter) and 10–15 beetles (11–16 mm
long). The number of beetles was always consistent within a sampling period, between farms. Prey removal was
recorded, and prey replenished every morning and evening within an hour of sunrise and sunset. Prey removal
was measured over the cotton growing season between December and March inclusive. Sampling occurred
over 29 days (8 consecutive days in January; 7 consecutive days in other months) on three farms day and night.
Sampling was missed on eleven occasions due to inclement weather. This resulted in 3260 sampling observations
of feeding stations on the three farms across the season.
Identification of potential predators. Infrared motion-activated trail cameras (ScoutGuard SG550)
were deployed at eight feeding stations per sampling area to record the animals visiting feeding stations. When
motion was detected, one image per second for 3 secs was captured. Cameras were set to record for the duration
of each sampling session and placed in the same position at each subsequent sampling session. Fauna images
were identified to species where possible and categorised as day or night.
Bird species richness and abundance undertaken from the crop edge (point counts) over each sampling area
for a period of 20 min each morning and evening (within an hour of sunrise and sunset) while replenishing
feeding trays (n = 348 sampling events, 29 days by three farms day and night). The order of fields visited for bird
observations was randomised. Scats deposited on trays and ant abundance were recorded at each feeding station
and plates cleared of scats every morning and afternoon. These methods were used to evaluate the potential role
of insectivorous birds and ants as predators of the experimental prey. Climate data from the Bureau of Meteorol-
ogy (station no. 055202) was recorded each day.
Data analysis. Data analysis was performed in R. software (version 4.0.2)79. We used the glmmTMB pack-
age (v1.0.2.1, published 2020–07-01) to fit binomially distributed data using maximum likelihood e stimation80.
To determine the probability of a predation event, the number of prey removed (mealworms or beetles) of the
pre-set number on offer was the response variable. Generalised linear mixed-effects models (GLMMs) were
fitted with a beta-binomial distribution that captured overdispersion in the binomially distributed data and
accounted for varying numbers of prey at feeding stations.
We tested whether the probability of a predation event was affected by the following fixed effects and interac-
tions: time of day (day or night), month (December to March) and foraging distance (i.e. proximity to cotton
edge; 5, 15, 25 … 95 m). Farm (three levels) and feeding stations were treated as random effects. A separate
conditional model was created for each of the two prey resources (mealworms and beetles). A zero-inflation
parameter was applied to the beetle model, where the probability of producing a structural zero was a function
for all observations (ziformula ≃ 1). The zero-inflation parameter described the probability of observing an
extra (i.e. structural) zero that was not generated by the conditional model. Predicted marginal effects (predicted
probabilities for logistic models) of the mealworm removal rate from the crop edge were made using the ‘ggef-
fects’ package (v0.7.0, published 2018–11-17)81, taking random effects into account. Wald-type 95% confidence
intervals for predicted average count were calculated. Residuals and diagnostics of models were checked using the
DHARMa package (v0.2.0, published 2018–06-06), a simulation-based approach for checking model assumptions
and diagnostics82. We identified the best fitting model based on Dharma diagnostics. The EMMEANS package
(v1.5.1) was used to calculate estimated marginal means using the Tukey method to determine which pairwise
differences were s ignificant83.
To derive an estimate of the change in predation risk, we adopted an odds-based approach where odds-ratios
(OR) were calculated by exponentiating the model coefficients (β). Odds-ratios were converted to a percent
and calculated as (1 – exp(β) × 100) where OR ≤ 1, and (exp(β) – 1 × 100) where OR > 1. The resulting OR then
describes the factor by which predation odds change for a 1-unit increase in the corresponding f actor84.
Camera images with an animal present were tagged as a visitation event. Visitation events were quantified
in two ways: (1) counts of visitations at each feeding station (or in the camera field of view for bats) were cal-
culated as camera trap images per hour (CT/h), and (2) the length of time of visitations at each feeding station
was calculated as an activity index (AI/h). Each method was adjusted for the sampling time at each location and
Scientific Reports | (2021) 11:5256 | https://doi.org/10.1038/s41598-021-84633-8 9
Vol.:(0123456789)www.nature.com/scientificreports/
standardised by the number of tagged images (1) or hours of recording (2). Visitation events were then allocated
to a distance from the crop edge (close: 5–45 m; far: 55–95 m).
Bird abundance, bird richness, ant abundance and scat abundance data for every sampling observation and
site were tabulated. Pearson correlation coefficients (r) were calculated between climate data (minimum and
maximum temperature, daily rainfall, daily evaporation, maximum daily wind speed) and the predation rate of
mealworms, beetles and total predation rate (combined mealworm and beetle predation).
Data availability
Should the manuscript be accepted, the data supporting the results will be archived in an appropriate public
repository such as Dryad or Figshare and the data DOI will be included at the end of the article.
Received: 19 April 2020; Accepted: 16 February 2021
References
1. FAO. United Nations Food Agricultural Organisation. High Level Expert Forum (FAO, Rome, 2009).
2. Puig-Montserrat, X. et al. Pest control service provided by bats in Mediterranean rice paddies: Linking agroecosystems structure
to ecological functions. Mamm. Biol. 80, 237–245. https://doi.org/10.1016/j.mambio.2015.03.008 (2015).
3. Cleveland, C. J. et al. Economic value of the pest control service provided by Brazilian free-tailed bats in south-central Texas. Front.
Ecol. Environ. 4, 238–243. https://doi.org/10.1890/1540-9295(2006)004[0238:Evotpc]2.0.Co;2 (2006).
4. Boyles, J. G., Cryan, P. M., McCracken, G. F. & Kunz, T. H. Conservation. Economic importance of bats in agriculture. Science
332, 41–42. https://doi.org/10.1126/science.1201366 (2011).
5. Naylor, R. L. & Ehrlich, P. R. In Nature’s Services: Societal Dependence on Natural Ecosystems (ed. Daily, G. C.) 151–174 (Island
Press, New York, 1997).
6. Losey, J. E. & Vaughan, M. The economic value of ecological services provided by insects. Bioscience 56, 311–323. https://doi.
org/10.1641/0006-3568(2006)56[311:Tevoes]2.0.Co;2 (2006).
7. Power, A. G. Ecosystem services and agriculture: Tradeoffs and synergies. Philos. Trans. R. Soc. Lond. B 365, 2959–2971. https://
doi.org/10.1098/rstb.2010.0143 (2010).
8. Maine, J. J. & Boyles, J. G. Bats initiate vital agroecological interactions in corn. Proc. Natl. Acad. Sci. U.S.A. 112, 12438–12443.
https://doi.org/10.1073/pnas.1505413112 (2015).
9. Tremblay, A., Mineau, P. & Stewart, R. K. Effects of bird predation on some pest insect populations in corn. Agric. Ecosyst. Environ.
83, 143–152. https://doi.org/10.1016/S0167-8809(00)00247-4 (2001).
10. Van Bael, S. A. et al. Birds as predators in tropical agroforestry systems. Ecology 89, 928–934 (2008).
11. Grass, I., Lehmann, K., Thies, C. & Tscharntke, T. Insectivorous birds disrupt biological control of cereal aphids. Ecology 98,
1583–1590. https://doi.org/10.1002/ecy.1814 (2017).
12. Karp, D. S. et al. Forest bolsters bird abundance, pest control and coffee yield. Ecol. Lett. 16, 1339–1347. https://doi.org/10.1111/
ele.12173(2013).
13. Maas, B. et al. Bird and bat predation services in tropical forests and agroforestry landscapes. Biol. Rev. Camb. Philos. Soc. 91,
1081–1101. https://doi.org/10.1111/brv.12211 (2016).
14. Cohen, Y., Bar-David, S., Nielsen, M., Bohmann, K. & Korine, C. An appetite for pests: Synanthropic insectivorous bats exploit
cotton pest irruptions and consume various deleterious arthropods. Mol. Ecol. 29, 1185–1198. https://doi.org/10.1111/mec.15393
(2020).
15. Chaplin-Kramer, R., de Valpine, P., Mills, N. J. & Kremen, C. Detecting pest control services across spatial and temporal scales.
Agric. Ecosyst. Environ. 181, 206–212. https://doi.org/10.1016/j.agee.2013.10.007 (2013).
16. Speakman, J. R. & Thomas, D. W. In Bat ecology (eds Kunz, T. H. & Fenton, M. B.) 430–490 (University of Chicago Press, Chicago,
2003).
17. Norberg, U. M. Avian Energetics and Nutritional Ecology 199–249 (Springer, Berlin, 1996).
18. Nyffeler, M., Şekercioğlu, Ç. H. & Whelan, C. J. Insectivorous birds consume an estimated 400–500 million tons of prey annually.
Sci. Nat. 105, 47. https://doi.org/10.1007/s00114-018-1571-z (2018).
19. Sekercioglu, C. H. Increasing awareness of avian ecological function. Trends Ecol. Evol. 21, 464–471. https://doi.org/10.1016/j.
tree.2006.05.007 (2006).
20. Mols, C. M. M. & Visser, M. E. Great tits can reduce caterpillar damage in apple orchards. J. Appl. Ecol. 39, 888–899. https://doi.
org/10.1046/j.1365-2664.2002.00761.x (2002).
21. Van Bael, S. A., Bichier, P. & Greenberg, R. Bird predation on insects reduces damage to the foliage of cocoa trees (Theobroma
cacao) in western Panama. J. Trop. Ecol. 23, 715–719. https://doi.org/10.1017/s0266467407004440 (2007).
22. Federico, P. et al. Brazilian free-tailed bats as insect pest regulators in transgenic and conventional cotton crops. Ecol. Appl. 18,
826–837. https://doi.org/10.1890/07-0556.1 (2008).
23. McCracken, G. F. et al. Bats track and exploit changes in insect pest populations. PLoS ONE 7, e43839. https://doi.org/10.1371/
journal.pone.0043839 (2012).
24. Kolkert, H., Andrew, R., Smith, R., Rader, R. & Reid, N. Insectivorous bats selectively source moths and eat mostly pest insects on
dryland and irrigated cotton farms. Ecol. Evol. 10, 371–388. https://doi.org/10.1002/ece3.5901 (2020).
25. Maas, B., Clough, Y. & Tscharntke, T. Bats and birds increase crop yield in tropical agroforestry landscapes. Ecol. Lett. 16, 1480–
1487. https://doi.org/10.1111/ele.12194 (2013).
26. Kalka, M. B., Smith, A. R. & Kalko, E. K. Bats limit arthropods and herbivory in a tropical forest. Science 320, 71. https://doi.
org/10.1126/science.1153352 (2008).
27. Williams-Guillen, K., Perfecto, I. & Vandermeer, J. Bats limit insects in a neotropical agroforestry system. Science 320, 70. https://
doi.org/10.1126/science.1152944 (2008).
28. Kunz, T. H., de Torrez, E. B., Bauer, D., Lobova, T. & Fleming, T. H. In Year in Ecology and Conservation Biology (eds Ostfeld, R.
S. & Schlesinger, W. H.) 1–38 (New York Academy of Sciences, New York, 2011).
29. Taylor, P. J., Grass, I., Alberts, A. J., Joubert, E. & Tscharntke, T. Economic value of bat predation services: A review and new
estimates from macadamia orchards. Ecosyst. Serv. 30, 372–381. https://doi.org/10.1016/j.ecoser.2017.11.015 (2018).
30. Redlich, S., Martin Emily, A. & Steffan-Dewenter, I. Landscape-level crop diversity benefits biological pest control. J. Appl. Ecol.
https://doi.org/10.1111/1365-2664.13126 (2018).
31. Hooks, C., Pandey, R. R., & Johnson, M. W. Unlikely guardians of cropping systems: Can birds and spiders protect broccoli from
caterpillar pests? Insect Pests (2007).
32. Martin, E. A., Reineking, B., Seo, B. & Steffan-Dewenter, I. Natural enemy interactions constrain pest control in complex agricul-
tural landscapes. Proc. Natl. Acad. Sci. U.S.A. 110, 5534–5539. https://doi.org/10.1073/pnas.1215725110 (2013).
Scientific Reports | (2021) 11:5256 | https://doi.org/10.1038/s41598-021-84633-8 10
Vol:.(1234567890)www.nature.com/scientificreports/
33. Karp, D. S. & Daily, G. C. Cascading effects of insectivorous birds and bats in tropical coffee plantations. Ecology 95, 1065–1074.
https://doi.org/10.1890/13-1012.1 (2014).
34. Barbaro, L. et al. Avian pest control in vineyards is driven by interactions between bird functional diversity and landscape hetero-
geneity. J. Appl. Ecol. 54, 500–508. https://doi.org/10.1111/1365-2664.12740 (2017).
35. Rey Benayas, J. M., Meltzer, J., de las Heras-Bravo, D. & Cayuela, L. Potential of pest regulation by insectivorous birds in Mediter-
ranean woody crops. PLoS ONE 12, 15. https://doi.org/10.1371/journal.pone.0180702 (2017).
36. Morrison, E. B. & Lindell, C. A. Birds and bats reduce insect biomass and leaf damage in tropical forest restoration sites. Ecol. Appl.
22, 1526–1534 (2012).
37. Ndanganga, P. K., Njoroge, J. B. M. & Vickery, J. Quantifying the contribution of birds to the control of arthropod pests on kale,
Brassica oleracea acephala, a key crop in East African highland farmland. Int. J. Pest Manage. https://doi.org/10.1080/09670
874.2013.820005 (2013).
38. Tschumi, M., Ekroos, J., Hjort, C., Smith, H. G. & Birkhofer, K. Rodents, not birds, dominate predation-related ecosystem services
and disservices in vertebrate communities of agricultural landscapes. Oecologia 188, 863–873. https: //doi.org/10.1007/s00442 -018-
4242-z (2018).
39. Elkinton, J. S., Liebhold, A. M. & Muzika, R.-M. Effects of alternative prey on predation by small mammals on gypsy moth pupae.
Popul. Ecol. 46, 171–178. https://doi.org/10.1007/s10144-004-0175-y (2004).
40. Dyrcz, A. Breeding biology and behaviour of the willie wagtail (Rhipidura leucophrys) in the madang region Papua New Guinea.
Emu 94, 17–26. https://doi.org/10.1071/MU9940017 (1994).
41. Adriano, S. & Calver, M. C. Diet of breeding willie wagtails (Rhipidura leucophrys) in suburban Western Australia. Emu 95, 138–141.
https://doi.org/10.1071/MU9950138 (1995).
42. Razeng, E. & Watson, D. M. What do declining woodland birds eat? A synthesis of dietary records. Emu 112, 149–156. https://
doi.org/10.1071/MU11099 (2012).
43. Brandl, R., Kristín, A. & Leisler, B. Dietary niche breadth in a local community of passerine birds: An analysis using phylogenetic
contrasts. Oecologia 98, 109–116. https://doi.org/10.1007/bf00326096 (1994).
44. Kaplan, G. Australian Magpie: Biology and Behaviour of an Unusual Songbird (CSIRO Publishing, Clayton, 2019).
45. Puckett, H. L., Brandle, J. R. & Johnson, R. J. Avian foraging patterns in crop field edges adjacent to woody habitat. Agric. Ecosyst.
Environ. 131, 9–15 (2009).
46. Best, L. B., Whitmore, R. C. & Booth, G. M. Use of cornfields by birds during the breeding season: the importance of edge habitat.
Am. Midl. Nat. 123, 84–99. https://doi.org/10.2307/2425762 (1990).
47. Hansen, N. A., Sato, C. F., Michael, D. R., Lindenmayer, D. B. & Driscoll, D. A. Predation risk for reptiles is highest at remnant
edges in agricultural landscapes. J. Appl. Ecol. 56, 31–43. https://doi.org/10.1111/1365-2664.13269 (2019).
48. Storch, I., Woitke, E. & Krieger, S. Landscape-scale edge effect in predation risk in forest-farmland mosaics of Central Europe.
Landsc. Ecol. 20, 927–940. https://doi.org/10.1007/s10980-005-7005-2 (2005).
49. Douglas, D. J. T., Vickery, J. A. & Benton, T. G. Improving the value of field margins as foraging habitat for farmland birds. J. Appl.
Ecol. 46, 353–362. https://doi.org/10.1111/j.1365-2664.2009.01613.x (2009).
50. Stephens, D. W. & Krebs, J. R. Foraging Theory (University Press, 1986).
51. Denzinger, A. & Schnitzler, H.-U. Bat guilds, a concept to classify the highly diverse foraging and echolocation behaviors of
microchiropteran bats. Front. Physiol. 4, 164. https://doi.org/10.3389/fphys.2013.00164 (2013).
52. Schnitzler, H.-U. & Kalko, E. K. V. Echolocation by insect-eating bats. Vol. 51 (SPIE, 2001).
53. Neuweiler, G. Foraging, echolocation and audition in bats. Naturwissenschaften 71, 446–455. https://doi.org/10.1007/BF00455897
(1984).
54. Fenton, M. B. The foraging behaviour and ecology of animal-eating bats. Can. J. Zool. 68, 411–422. https: //doi.org/10.1139/z90-061
(1990).
55. Jantzen, M. K. & Fenton, M. B. The depth of edge influence among insectivorous bats at forest–field interfaces. Can. J. Zool. 91,
287–292. https://doi.org/10.1139/cjz-2012-0282 (2013).
56. Estur, G. Cotton Exporter’s Guide. (International Trade Centre UNCTAD/WTO, 2007).
57. RBG In State of the World’s Plants 2017 (ed. Willis, K.) 64–71 (Board of Trustees of the Royal Botanic Gardens, Kew, 2017).
58. Rencken, I. An Investigation of the Importance of Native and Non-Crop Vegetation to Beneficial Generalist Predators in Australian
Cotton Agroecosystems PhD thesis, University of New England (2006).
59. Holloway, J. C., Furlong, M. J. & Bowden, P. I. Management of beneficial invertebrates and their potential role in integrated pest
management for Australian grain systems. Aust. J. Exp. Agric. 48, 1531–1542. https://doi.org/10.1071/EA07424 (2008).
60. Schellhorn, N. A., Bianchi, F. J. & Hsu, C. L. Movement of entomophagous arthropods in agricultural landscapes: Links to pest
suppression. Annu. Rev. Entomol. 59, 559–581. https://doi.org/10.1146/annurev-ento-011613-161952 (2014).
61. Whitehouse, M. E. A., Wilson, L. J. & Fitt, G. P. A comparison of arthropod communities in transgenic Bt and conventional cotton
in Australia. Environ. Entomol. 34, 1224–1241 (2005).
62. Smith, R., Reid, J., Scott-Morales, L., Green, S. & Reid, N. A baseline survey of birds in native vegetation on cotton farms in inland
eastern Australia. Wildl. Res. 46, 304–316. https://doi.org/10.1071/WR18038 (2019).
63. Ford, G. & Thomson, N. Birds on Cotton Farms: A Guide to Common Species and Habitat Management (Cotton Catchment Com-
munities CRC, Boca Raton, 2006).
64. Whelan, C. J., Wenny, D. G. & Marquis, R. J. In Year in Ecology and Conservation Biology (eds Ostfeld, R. S. & Schlesinger, W. H.)
25–60 (Annals of the New York Academy of Sciences, New York, 2008).
65. Rodríguez, A., Andrén, H. & Jansson, G. Habitat-mediated predation risk and decision making of small birds at forest edges. Oikos
95, 383–396 (2001).
66. Sekercioglu, C. H. Bird functional diversity and ecosystem services in tropical forests, agroforests and agricultural areas. J. Ornithol.
153, 153–161. https://doi.org/10.1007/s10336-012-0869-4 (2012).
67. Greenop, A., Woodcock, B. A., Wilby, A., Cook, S. M. & Pywell, R. F. Functional diversity positively affects prey suppression by
invertebrate predators: a meta-analysis. Ecology 99, 1771–1782. https://doi.org/10.1002/ecy.2378 (2018).
68. Nelson, J. J. & Gillam, E. H. Selection of foraging habitat by female little brown bats (Myotis lucifugus). J. Mammal. 98, 222–231.
https://doi.org/10.1093/jmammal/gyw181 (2016).
69. Rohner, C. & Krebs, C. J. Owl predation on snowshoe hares: Consequences of antipredator behaviour. Oecologia 108, 303–310.
https://doi.org/10.1007/bf00334655 (1996).
70. Rockwell, C., Gabriel, P. O. & Black, J. M. Bolder, older, and selective: Factors of individual-specific foraging behaviors in Steller’s
jays. Behav. Ecol. 23, 676–683. https://doi.org/10.1093/beheco/ars015 (2012).
71. Krebs, J. R. In Perspectives in Ethology (eds Bateson, P. P. G. & Klopfer, P. H.) 73–111 (Springer US, Berlin, 1973).
72. Lövei, G. L. & Ferrante, M. A review of the sentinel prey method as a way of quantifying invertebrate predation under field condi-
tions. Insect Sci. 24, 528–542. https://doi.org/10.1111/1744-7917.12405 (2017).
73. Nagy, R. K., Schellhorn, N. A. & Zalucki, M. P. Fresh, frozen or fake: A comparison of predation rates measured by various types
of sentinel prey. J. Appl. Entomol. 144, 407–416. https://doi.org/10.1111/jen.12745 (2020).
74. Ravzanaadii, N., Kim, S.-H., Choi, W. H., Seong-Jin, H. & Kim, N. J. Nutritional value of mealworm, tenebrio molitor as food
source. Int. J. Ind. Ergon. 25, 93–98 (2012).
Scientific Reports | (2021) 11:5256 | https://doi.org/10.1038/s41598-021-84633-8 11
Vol.:(0123456789)www.nature.com/scientificreports/
75. Barbaro, L., Giffard, B., Charbonnier, Y., van Halder, I. & Brockerhoff, E. G. Bird functional diversity enhances insectivory at forest
edges: A transcontinental experiment. Divers. Distrib. 20, 149–159. https://doi.org/10.1111/ddi.12132 (2014).
76. Environment Australia. Revision of the Interim Biogeographic Regionalisation of Australia (IBRA) and Development of Version 5.0:
Summary Report. (Department of Environment and Heritage, Canberra, 2000).
77. OEH. NSW (Mitchell) Landscapes. Vol. version 3.1 (State of New South Wales and Office of Environment and Heritage 2002).
78. Keith, D. A. Ocean Shores to Desert Dunes: The Native Vegetation of NEW South Wales and the ACT(Department of Environment
and Conservation, 2004).
79. R Core Team, R: A language and environment for statistical computing. (R Foundation for Statistical Computing, Vienna, Austria.
https://www.R-project.org/, 2018).
80. Brooks, M. E. et al. glmmTMB balances speed and flexibility among packages for zero-inflated generalized linear mixed modeling.
R J. 9, 400. https://doi.org/10.3929/ethz-b-000240890 (2017).
81. Lüdecke, D. ggeffects: Create Tidy Data Frames of Marginal Effects for ‘ggplot’ from Model Outputs (v0.16.0). https://CRAN.R-proje
ct.org/package=ggeffects. (2017).
82. Hartig, F. DHARMa: Residual Diagnostics for Hierarchical (Multi-level/mixed) Regression Models (v0.3.3). https://CRAN.R-proje
ct.org/package=DHARMa (2017).
83. Lenth, R., Singmann, H., Love, J., Buerkner, P. & Herve, M. Estimated Marginal Means, aka Least-Squares Means (v1.5.3). https://
www.rdocumentation.org/packages/emmeans (2019).
84. Szumilas, M. Explaining odds ratios. J. Can. Acad. Child Adolesc. Psychiatry 19, 227–229 (2010).
Acknowledgements
We would like to thank the Watson family who allowed us to work on their property. Field assistance provided
by Sarah Hartman and Dr Shannon Currie. Camera traps were kindly lent to us by Dr Guy Ballard. This project
was funded by the Holsworth Wildlife Research Endowment – Equity Trustees Charitable Foundation, the
NSW North West Local Land Services (LLS) and the Brigalow-Nandewar Biolinks Project (Australia Govern-
ment Biodiversity Fund – Projects LSP-991865-1429 and LSP-944752-1076) managed by the North West and
Northern Tablelands LLS.
Author contributions
All authors conceived the project and contributed to project design, statistical direction and manuscript revisions.
H.K. collected the data, analysed the data and wrote the first draft of the manuscript.
Competing interests
The authors declare no competing interests.
Additional information
Supplementary Information The online version contains supplementary material available at https://doi.
org/10.1038/s41598-021-84633-8.
Correspondence and requests for materials should be addressed to H.L.K.
Reprints and permissions information is available at www.nature.com/reprints.
Publisher’s note Springer Nature remains neutral with regard to jurisdictional claims in published maps and
institutional affiliations.
Open Access This article is licensed under a Creative Commons Attribution 4.0 International
License, which permits use, sharing, adaptation, distribution and reproduction in any medium or
format, as long as you give appropriate credit to the original author(s) and the source, provide a link to the
Creative Commons licence, and indicate if changes were made. The images or other third party material in this
article are included in the article’s Creative Commons licence, unless indicated otherwise in a credit line to the
material. If material is not included in the article’s Creative Commons licence and your intended use is not
permitted by statutory regulation or exceeds the permitted use, you will need to obtain permission directly from
the copyright holder. To view a copy of this licence, visit http://creativecommons.org/licenses/by/4.0/.
© The Author(s) 2021
Scientific Reports | (2021) 11:5256 | https://doi.org/10.1038/s41598-021-84633-8 12
Vol:.(1234567890)You can also read


