A proposed plan of action for meeting the immediate requirements and future expectations of the New Zealand Honey Industry - Kellogg Rural ...
←
→
Page content transcription
If your browser does not render page correctly, please read the page content below
A proposed plan of action for
meeting the immediate requirements
  and future expectations of the
  New Zealand Honey Industry.

    Kellogg Rural Leadership Programme
             Course 43, 2021
               Kathryn Reid
I wish to thank the Kellogg Programme Investing Partners for their continued support:

Disclaimer
In submitting this report, the Kellogg Scholar has agreed to the publication of this material
in its submitted form.
This report is a product of the learning journey taken by participants during the Kellogg
Rural Leadership Programme, with the purpose of incorporating and developing tools and
skills around research, critical analysis, network generation, synthesis and applying
recommendations to a topic of their choice. The report also provides the background for a
presentation made to colleagues and industry on the topic in the final phase of the
Programme.
Scholars are encouraged to present their report findings in a style and structure that ensures
accessibility and uptake by their target audience. It is not intended as a formal academic
report as only some scholars have had the required background and learning to meet this
standard.
This publication has been produced by the scholar in good faith on the basis of information
available at the date of publication, without any independent verification. On occasions,
data, information, and sources may be hidden or protected to ensure confidentially and that
individuals and organisations cannot be identified.
Readers are responsible for assessing the relevance and accuracy of the content of this
publication & the Programme or the scholar cannot be liable for any costs incurred or
arising by reason of any person using or relying solely on the information in this
publication.
This report is copyright but dissemination of this research is encouraged, providing the
Programme and author are clearly acknowledged.
Scholar contact details may be obtained through the New Zealand Rural Leadership Trust
for media, speaking and research purposes.

Contents
1. Acknowledgments ............................................................................................................. 1
2. Executive Summary ........................................................................................................... 2
3. Introduction ....................................................................................................................... 4
   3.1 Industry worth .............................................................................................................. 4
   3.2 How many beehives are there?..................................................................................... 4
   3.3 Who is keeping the bees? ............................................................................................. 4
   3.4 What are these beekeepers tasked to do? ..................................................................... 4
   3.5 Export honey value and volume ................................................................................... 4
   3.6 Export honey prices ...................................................................................................... 5
   3.7 Prices to beekeepers ..................................................................................................... 5
   3.8 Mānuka is the king of honeys ...................................................................................... 5
   3.9 Factors potentially affecting Mānuka export earnings ................................................. 5
   3.10 The big opportunity .................................................................................................... 6
   3.11 Who will fund the research?....................................................................................... 7
   3.12 Can we sell our honey domestically? ......................................................................... 7
   3.13 Can we sell our honey surplus? .................................................................................. 7
   3.14 Can we use a levy? ..................................................................................................... 7
   3.15 Can we call upon Government? ................................................................................. 7
4. Aim .................................................................................................................................... 8
5. Methodology...................................................................................................................... 8
   5.1 Dialogue themes ........................................................................................................... 8
   5.2 Human psychology lens ............................................................................................... 8
   5.3 Terminology distinctions............................................................................................ 10
   5.4 Respondent recruitment.............................................................................................. 10
   5.5 Data collection............................................................................................................ 11
   5.6 Data analysis .............................................................................................................. 11
6. Literature Review ............................................................................................................ 12
   6.1 Sustainable Livelihood ............................................................................................... 12
      6.1.1 Definition ............................................................................................................. 12
      6.1.2 Observation .......................................................................................................... 12
      6.1.3 Research ............................................................................................................... 12
   6.2 Industry Structure ....................................................................................................... 12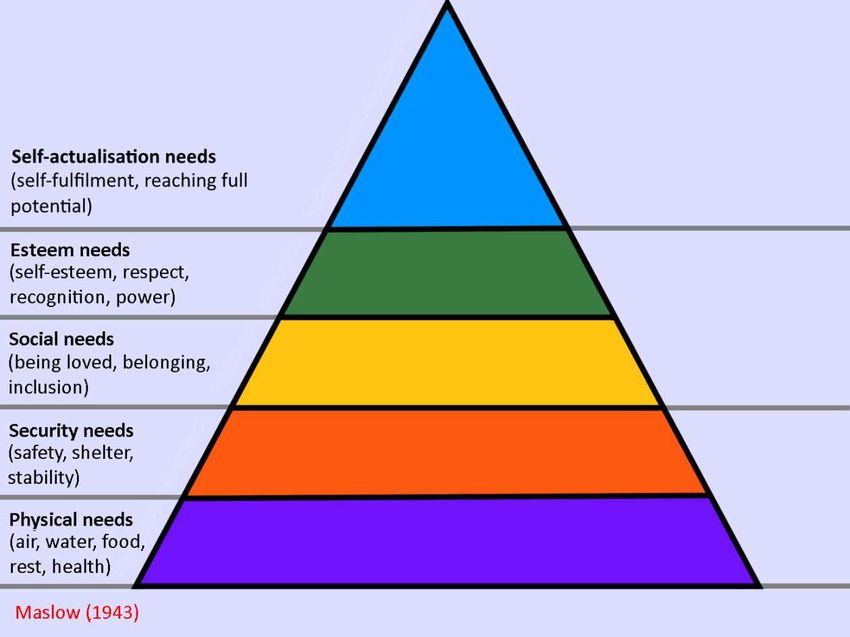
6.2.1 Definition ............................................................................................................. 12
     6.2.2 Observation .......................................................................................................... 12
     6.2.3 Research ............................................................................................................... 12
  6.3 Effective Communication .......................................................................................... 13
     6.3.1 Definition ............................................................................................................. 13
     6.3.2 Observation .......................................................................................................... 13
     6.3.3 Research ............................................................................................................... 13
  6.4 Good Leadership ........................................................................................................ 14
     6.4.1 Definition ............................................................................................................. 14
     6.4.2 Observation .......................................................................................................... 14
     6.4.3 Research ............................................................................................................... 14
  6.5 Clear Vision................................................................................................................ 15
     6.5.1 Definition ............................................................................................................. 15
     6.5.2 Observation .......................................................................................................... 15
     6.5.3 Research ............................................................................................................... 15
  6.6 Self-Fulfilment ........................................................................................................... 16
     6.6.1 Definition ............................................................................................................. 16
     6.6.2 Observation .......................................................................................................... 16
     6.6.3 Research ............................................................................................................... 16
  6.7 Change Management .................................................................................................. 16
     6.7.1 Definition ............................................................................................................. 16
     6.7.2 Observation .......................................................................................................... 16
     6.7.3 Research ............................................................................................................... 17
7. Findings and Discussion .................................................................................................. 17
  7.1 Sustainable Livelihood ............................................................................................... 17
     7.1.1 Decreased prices .................................................................................................. 18
     7.1.2 Increased costs ..................................................................................................... 18
     7.1.3 Mānuka bubble .................................................................................................... 18
     7.1.4 Mānuka market .................................................................................................... 18
     7.1.5 Profitability .......................................................................................................... 19
     7.1.6 Business acumen .................................................................................................. 19
     7.1.7 Discussion ............................................................................................................ 19
  7.2 Industry Structure ....................................................................................................... 19
7.2.1 “We’re stronger together” .................................................................................... 19
   7.2.2 Influencing Government and regulators .............................................................. 20
   7.2.3 Enforcing rules ..................................................................................................... 20
   7.2.4 Not fragmented .................................................................................................... 20
   7.2.5 Captures all opinions ........................................................................................... 20
   7.2.6 Allows personal autonomy .................................................................................. 20
   7.2.7 Discussion ............................................................................................................ 20
7.3 Effective Communication .......................................................................................... 21
   7.3.1 Lack of an accessible national database .............................................................. 21
   7.3.2 Lack of communication ....................................................................................... 21
   7.3.3 Lack of one voice ................................................................................................. 22
   7.3.4 Lack of input ........................................................................................................ 22
   7.3.5 Lack of belief ....................................................................................................... 22
   7.3.6 ApiNZ .................................................................................................................. 22
   7.3.7 Personal networks ................................................................................................ 22
   7.3.8 Discussion ............................................................................................................ 22
7.4 Good Leadership ........................................................................................................ 22
   7.4.1 Lack of courage ................................................................................................... 23
   7.4.2 Lack of listening .................................................................................................. 23
   7.4.3 Putting personal agendas first .............................................................................. 23
   7.4.4 Lack of unified voice ........................................................................................... 23
   7.4.5 Lack of communication ....................................................................................... 23
   7.4.6 Lack of leader visibility ....................................................................................... 24
   7.4.7 Producing results.................................................................................................. 24
   7.4.8 Doing their best .................................................................................................... 24
   7.4.9 Discussion ............................................................................................................ 24
7.5 Clear Vision................................................................................................................ 24
   7.5.1 Lack of a vision.................................................................................................... 25
   7.5.2 ApiNZ .................................................................................................................. 25
   7.5.3 Universal .............................................................................................................. 25
   7.5.4 Discussion ............................................................................................................ 25
7.6 Self-Fulfilment ........................................................................................................... 25
   7.6.1 Bees ...................................................................................................................... 26
7.6.2 Lifestyle ............................................................................................................... 26
      7.6.3 Working in and with nature ................................................................................. 26
      7.6.4 Producing something natural ............................................................................... 26
      7.6.5 Sense of achievement........................................................................................... 26
      7.6.6 Supporting others ................................................................................................. 26
      7.6.7 Survival ................................................................................................................ 26
      7.6.8 Discussion ............................................................................................................ 27
   7.7 Main Findings and Discussion Points ........................................................................ 27
8. Conclusions ..................................................................................................................... 27
9. Recommendations ........................................................................................................... 27
10. References ..................................................................................................................... 29
11. Appendices .................................................................................................................... 34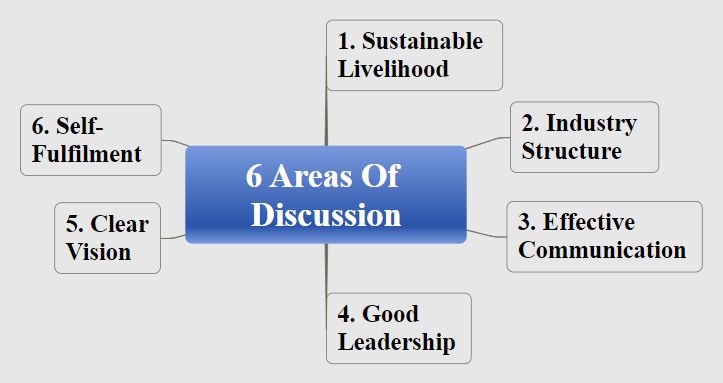
1. Acknowledgments
First, I would like to acknowledge Lisa, Desley, Scott, Patrick and Chris - the amazing
team at The New Zealand Rural Leadership Trust. Thank you for believing in me,
investing in me and for teaching me about leadership and the rural sector. This experience
has been life-changing and each of you has my genuine gratitude.
I could not have done this programme without you Bruce Clow, so thank you for saying
yes and sharing your knowledge with me. It was invaluable.
I would not have done this programme without you Steve Olds and your countless hours
on Skype. Thank you for your thoughts, your insights, your encouragement, your support,
your humour, and for bringing me down off the chandelier many, many times. You have
my undying admiration and respect.
My heartfelt thanks to my family. For Dad’s perseverance through the years nudging me to
apply for Kellogg as he knew how life-changing it was, for Mum’s regular check-in phone
calls and reminders to eat, for my sister’s encouragement and interest, and to Nana for
teaching me to make a difference. With you all, I stand on the shoulders of giants.
To all the people who generously spoke to me, answered questions via email or text, and
for the 57 people who took part in my survey, your insights and candour were invaluable,
and I thank you all for your trust.
To Cohort 43, thanks for sharing the journey with me. I have always got your back.
Thanks to Phil, my unfailingly patient supporter, who as I type this is sitting in front of his
sluggish computer, cursing a computer program called paint.net, creating images for this
report, so I don’t have to.
And finally, to the bees. Thank you for gentle reminders that we are all in this together.
Without you, our world would be empty.

                                                                                      Page 1 of 35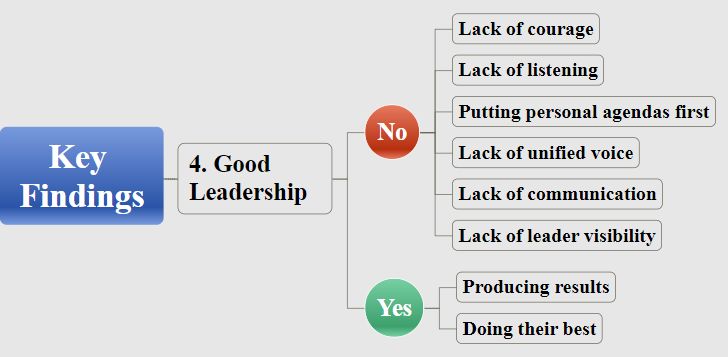
2. Executive Summary
New Zealand relies on bees to pollinate crops and pasture worth at least $5 billion annually
to its economy. In 2019/20, honey export value reached $425 million. In July 2020, the
Government released its Fit for a better world vision. While it did not separate the impact
on the New Zealand honey industry individually, the numbers infer the industry is being
tasked to add $65 million in export earnings cumulatively over the next 10 years. This task
falls to the 935 export registered beekeepers (about 10% of total registered beekeepers) to
supply Mānuka and/or non-Mānuka honey for export. So, how well is the industry set up
to accomplish this task?
Industry members were asked via survey, what was working and not working in the
industry across the six areas below. These areas were selected by applying a human
psychology lens to understand the motivation behind the behaviour within the industry. Of
the 57 respondents, over half indicated they wanted change across five of the six areas.
   1. Sustainable livelihood: 54.4% said the industry was not providing them with a
      sustainable livelihood, primarily because non-Mānuka honey prices have dropped
      below cost of production. They also voiced concerns about the oversupply of
      honey, the overstocking of bees, and the low demand for products like beeswax and
      propolis. Haar et al. (2017) explains income predicts work-life balance and job
      satisfaction, and concerningly, Stats NZ (2020) found average 2020 weekly wage
      and salary earnings in the industry was $1,090 per week, $259 per week less than
      average 2019 weekly expenditure. Respondents who were getting a sustainable
      livelihood from the industry credited Mānuka’s high prices and profitability, and
      their business acumen.
   2. Industry structure: 72.2% said having a more united industry would be an
      advantage. They believe “we are stronger together” and becoming more unified
      would mean more collaboration and agreed priorities, better influence over
      Government and regulators, and greater ability to enforce rules and stop the rogues
      and cowboys. Respondents happy with the industry structure cited having multiple
      organisations kept the others honest, ensured all voices are heard and allowed for
      personal autonomy. However, Coulet (2019) warns there should only be one
      industry body to represent the ‘voice’ of the industry as Government and regulators
      find it easier to talk to an industry body vs. every organisation active in the
      industry, and industry body board members must serve the interest of the whole
      industry (Boleat, 2001).
   3. Effective communication: 57.9% said the industry did not communicate effectively
      with them. They cited lack of an accessible national database, lack of
      communication, lack of one voice, lack of allowing their input, and lack of belief of
      information communicated were pressing issues. Laundry (2019) explains ineffective
      communication means important information can be misinterpreted, causing
      relationships to suffer, and ultimately create barriers that hinder progress.
      Respondents happy with the industry communication said it was because they were a
      member of ApiNZ and/or had built up personal networks which kept them informed.
   4. Good leadership: 61.4% said the industry leaders were not doing a good job. They
      cited lack of leadership courage, lack of listening, putting personal agendas first,
      lack of a unified voice, lack of communication and lack of leader visibility as the
      reasons. Sinek (2006) advises leadership is not about being in charge but about
      taking care of those in your charge and Hogan et al. (2005) asserts leadership

                                                                                  Page 2 of 35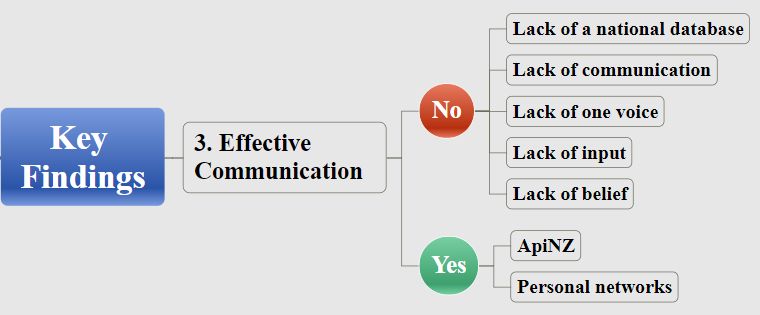
should be viewed by the ability to build and maintain a group, and evaluated by the
performance of the group over time. Respondents happy with the industry
leadership said advocacy at Government level and communication with the
industry is done well, they are producing results with limited resources, and they
are doing their best.
5. Clear vision: 84.2% said the industry did not have a clear vision. They felt no
vision existed as the industry is too fragmented to have a united vision. Sinek
(2018) explains a vision is the starting point, the basic building block. A vision
provides a sense of purpose and direction and when everyone is pulling toward the
same goal, people start trusting each other. Mollenhauer (2015) warns without a
vision the industry is going nowhere, because members are inspired by seeing a
clear vision forward and can align their energies and resources to achieving
progress. Respondents happy with the industry vision cited ApiNZ’s vision of “a
thriving long-term future for New Zealand honey and bee products” and universal
visions of ‘bee aware’ and making good quality honey and caring about the bees.
6. Self-fulfilment: 80.7% said their work in the industry fulfilled them. They love the
bees, the lifestyle and being outdoors in nature, producing something natural, the
sense of achievement from solving problems and supporting others. Respondents
who did not feel fulfilled said they were worried about survival of their business
and the industry. Concerningly, their feelings of fulfilment are lower than New
Zealanders feeling of fulfilment as Stats NZ (Mar 2021 quarter) found 86% of their
respondents reported high life satisfaction.
This research shows respondents are calling out for better returns, a unified industry,
effective communication, strong leadership, clear vision and greater self-fulfilment. So, is
it possible for the industry to create these outcomes? Yes it is, and this report supported by
literature recommends a two-phase plan of action to accomplish it:
Phase 1: What does the industry need to change? This is about finding all industry
members and capturing their voice for change following a three-step process, which looks
like this:
1. Developing a national database.
2. Creating a national communication campaign.
3. Sending out a national survey.
Phase 2: How does the industry change? This is about listening to all industry members
responses and guiding them through change by following Kotter’s (2012) proven eight-
step process of leading change, which looks like this:
1. Creating a sense of urgency.
2. Forming a powerful coalition.
3. Developing the change vision.
4. Communicating the vision.
5. Empowering industry members to act.
6. Creating quick wins.
7. Building on the change.
8. Anchoring the change into industry culture.
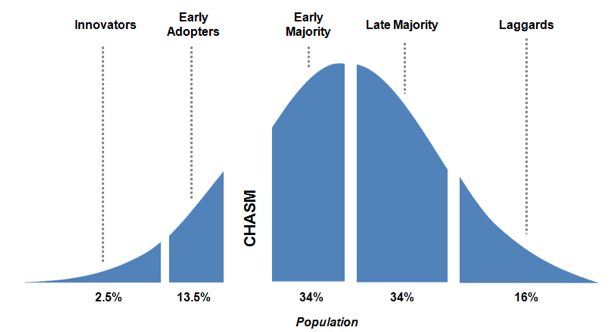
Can this two-phase plan of action work? According to Moore’s (1991) adaptation of the
Law of Diffusion of Innovations it can work if 15%-18% of industry members commit to
creating change in the industry.
Page 3 of 35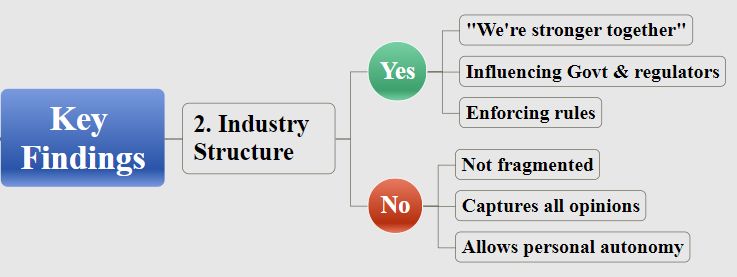
3. Introduction
3.1 Industry worth
The Minister of Primary Industries, Hon. Damien O’Connor says the Apiculture industry
is very important to New Zealand because we rely on bees to pollinate crops worth at least
$5 billion annually to our economy (O’Connor, 2019). This falls across both agriculture
and horticulture and includes pollinating pastoral clover, seed crops, vegetables, berries
and stone fruit.
3.2 How many beehives are there?
In 2020 there were 869,056 registered beehives, down 5% from 2019 (the first recorded
decline in 15 years). and up 92% from 2013 (MPI, 2020). Note: anecdotally it is said the
industry has a seven-year cycle which is why 2013 stats have been included for contrast.
3.3 Who is keeping the bees?
In 2020 there were 9,585 registered beekeeping enterprises, up 3% from 2019, and up
124% from 2013. 87% were hobbyists with 1-50 hives, 9.5% were beekeepers with 51-500
hives and 3.5% were commercial beekeepers with over 501 hives (MPI, 2020).
3.4 What are these beekeepers tasked to do?
The Government's Fit for a better world vision is to add $44 billion in primary sector
export earnings cumulatively over the next 10 years (MPI, Dec 2020). Of the $44 billion,
$500 million is targeted for arable and ‘processed food and other products’ which includes
honey (MPI, Jul 2020).
Of the arable and ‘processed food and other products’ industries, the New Zealand honey
industry contributes 13% of current export earnings. Calculation of 13%: $425 million
(2020 honey exports (MPI, 2020)) / $3,293 million (2020 total arable and ‘processed food
and other products’ export revenue (MPI, Dec 2020)).
This infers the Government's Fit for a better world vision is tasking the New Zealand
honey industry to add $65 million (calculation: 13% of $500 million) in export earnings
cumulatively over the next 10 years. This task falls to the 935 export registered beekeepers
(approximately 10% of all registered beekeepers identified earlier) to supply Mānuka
and/or non-Mānuka honey for export (MPI, Jun 2021).
3.5 Export honey value and volume
For the rest of this report, I applied the 80/20 Principle which states 80% of results come
from 20% of causes (Koch, 1997), and focused on honey as it makes up most of the
industry’s exports.
In 2019/20, honey export value reached $425 million, up 20% from 2019 (and up 193%
from 2013). $290 million (68%) was monofloral Mānuka, $85 million (20%) was
multifloral Mānuka, $48 million (11%) was non-Mānuka and $2 million (1%) was comb
honey and honey dew (MPI, 2020).
Honey export volume reached 10,288 tonnes, up 28% from 2019 (and up 28% from 2013).
5,245 tonnes (51%) was monofloral Mānuka, 2,609 tonnes (25%) was multifloral Mānuka,
2,113 tonnes (21%) was non- Mānuka and 321 tonnes (3%) was comb honey and honey
dew (MPI, 2020).

                                                                                    Page 4 of 35
3.6 Export honey prices
The average export prices in 2019/20 are shown in Table 1.
2019/20
($ per kg)
Non-Mānuka $22.50
Multifloral Mānuka $32.44
Monofloral Mānuka $55.36
Table 1: 2019/20 average export prices. Source MPI 2020 Apiculture Monitoring Report
3.7 Prices to beekeepers
In 2019/20, average prices paid to beekeepers for non-Mānuka honeys dropped by 30% to
50%, and prices for monofloral Mānuka trended toward the lower end of the price range
(MPI, 2020). Non-Mānuka honeys prices have also fallen significantly from prices
averaged over the last six years, and Mānuka was not immune to falling prices at the lower
price range (see Table 2).
Average of last 6 yrs 2019/20
($ per kg) ($ per kg)
Light (clover type) $7.60 - $11.20 $2.50 - $5.50
Light amber $6.50 - $10.15 $2.50 - $4.50
Dark, including honeydew $6.17 - $11.25 $2.50 - $4.00
Mānuka $9.55 - $122.75 $4.50 - $130.00
Table 2: average of 2014-2019 prices paid to beekeepers vs. 2019/20 prices paid to
beekeepers. Source MPI Apiculture Monitoring Reports from June 2014 to June 2020
3.8 Mānuka is the king of honeys
Mānuka especially monofloral Mānuka is the king of honeys, in terms of export prices and
prices paid to beekeepers. So, if Fit for a better world’s vision is tasking the New Zealand
Honey Industry to add $65 million, the 80/20 Principle implies most will be coming from
Mānuka.
3.9 Factors potentially affecting Mānuka export earnings
1. Confusion around active Mānuka honey quality standards. Active Mānuka
honey is sold under multiple quality standards like UMF, MGO, MGS and OMA.
In 1981 Biochemist Peter Molan took a once worthless honey and made it king by
identifying Mānuka honey had significant non-peroxide antimicrobial activity,
meaning it kills antibiotic-resistant bacteria commonly found in chronic wounds,
bed sores and leg ulcers (Van Eaten, 2004). This characteristic is quantifiable and
active Mānuka honey is currently sold under multiple quality standards like UMF,
MGO, MGS and OMA which potentially damages Mānuka’s morality and
confuses consumers.
2. Mānuka honey failing or passing the Ministry for Primary Industries (MPI)
authenticity test. According to Blignaut (2020), Mānuka underwent a massive
Page 5 of 35change in December 2017 with the new definition for Mānuka honey released by
the MPI in response to the growing concerns of fraudulent honey being sold as
Mānuka honey and damaging the brand’s integrity. The change in definition caused
many Northland beekeepers’ Mānuka honey to fail the test. According to industry
member Peter Bray, the change in definition also meant some Mānuka honey can
be blended with as much as 66% clover honey and still pass the test (Phare, 2021).
3. Honey fraud. According to Olmsted (2016) honey is the third most faked food in
the world behind olive oil and milk. Common practices include mislabelling honey
or blending it down using cane sugar, corn syrup or beet sugar. A report issued by
the World Congress of Beekeepers showed the economic damage of honey fraud to
beekeepers who produce authentic honey is approximately $1 billion, as they are
now competing with sellers of low-priced fraudulent honey (Phipps, 2021).
4. The word Mānuka. New Zealand does not have exclusive rights to the word
Mānuka which could cause revenue and demand to fall due to commodification of
Mānuka honey in major markets like the EU, UK, USA and China. The Mānuka
Honey Appellation Society Incorporated has been fighting for years to trademark
the word Mānuka, arguing it is a Māori name inextricably tied to New Zealand,
like the term champagne is to a region in France. According to Rawcliffe (2019) an
additional $2.2 billion of value could be created by 2033 if the term and IP of
Mānuka honey is protected. Protection validates Mānuka honey by demonstrating it
meets the definition of Mānuka, it is from New Zealand, it is unadulterated and it is
produced from Leptospermum scoparium only.
5. Glyphosate testing. Honey exports to Japan last year totalled almost $68 million,
but Japan warns it will stop importing our honey if 5% of honey tested at the
border exceeds its glyphosate limit (Dreaver, 2021) of 0.01mg per kilogram, which
is one tenth of New Zealand’s standard of 0.1mg per kilogram (Rennie, 2021). Will
other countries follow suit? And how will beekeepers keep bees away from
glyphosate, as bees forage at least 3km from the hive and beekeepers don't have
any control over land users in that area (Dreaver, 2021).
6. COVID-19. It created an explosion of exports last year as consumers stocked up
on health and wellbeing products, but demand has returned to pre COVID-19 levels
due to more product being stored in-market (Edmonds, 2021). COVID-19 may also
continue to cause: movement and border controls impacting operational efficiency
and access to air and sea freight (MPI, 2000), contractions in the Mānuka honey
market due to difficulty in supply chains issues (Proudfoot et al. 2020), increases in
online demand, particularly for the higher UMF grades, due to the perception that
Mānuka honey is good for general wellbeing and the immune system (Gray, 2020),
heightened interest among consumers for natural food products (Edmonds, 2021),
decreases in the daigou honey trade in New Zealand due to border closures and
increases in daigou customers in China buying locally through New Zealand
exporters online and store networks due to freight disruptions (Morrison, 2021),
rising costs of air freight due to less capacity and frequency which could be passed
onto consumers (Harris, 2020), and falling household incomes making consumers
less inclined to spend (Jones, 2020).
3.10 The big opportunity
Proudfoot et al. (2020) advises now is the time to connect a food product to a health
benefit in a scientifically valid way. So, is additional research on honey health benefits
Page 6 of 35(including non-Mānuka) the key to increasing export earnings, and keeping non-Mānuka
producers afloat?
3.11 Who will fund the research?
Who has the money and is willing to pay for the research? As honey prices keep dropping,
beekeepers are urgently looking at opportunities to increase revenue and reduce costs.
Non-Mānuka honey producers are struggling to cover costs of production. Some Mānuka
honey producers returns are sliding lower. And all the while export honey producers are
paying to store their honey while they wait for returns to improve!
3.12 Can we sell our honey domestically?
Domestic honey consumption does not mirror export demand (Edmonds, 2021) because an
estimated 5,000 tonnes was consumed locally in 2020 (Phare, 2021). Edmonds (2021)
warns New Zealand honey consumption per person per year is dropping. In 2018 it was
0.45kg per year whereas in 2015 it was 0.57kg per year.
3.13 Can we sell our honey surplus?
New Zealand is potentially producing almost as much in honey surplus annually as it
exports. Phare (2021) says in 2019, 9,640 tonnes of honey was exported leaving a surplus
of more than 8,300 tonnes, which added to the New Zealand stockpile of around 35,000
tonnes (Edmonds, 2021).
3.14 Can we use a levy?
On 1 March 2019, commercial beekeepers voted down the ApiNZ Commodity levy. 76%
voted no, 24% voted yes, and only 61% of eligible voters voted. The levy proposed to fund
issues like research, biosecurity, and industry sustainability. Beekeepers with 26 or more
hives who produced over 750 kg of honey per annum were to be levied at $0.10 per kg of
harvested honey for the first year, raising approximately $2 million per annum (ApiNZ,
2019).
How about including the 87% hobbyists? It could mean a lower levy but more in the kitty?
Some might argue hobbyists are not selling honey so why should they? Others might argue
the levy also funds biosecurity which impacts every beekeeper regardless of how many
hives they have or if they sell their honey? The industry is vulnerable to biosecurity threats
and any outbreak could have catastrophic consequences on the entire industry, not just the
beekeepers selling honey. John F Kennedy said “a rising tide lifts all boats”, and in this
case, a biosecurity breach impacts all beekeepers. Case in point, AFB and varroa.
3.15 Can we call upon Government?
Interestingly, some 2021 anecdotal comments were: if the industry was half as organised
as the bees they’d be great, Government thinks we are a bunch of muppets for not coming
together as an industry, and how can we ask Government to help us when we can’t even
show them we’re prepared to help ourselves?
The Minister of Primary Industries, Hon. Damien O’Connor said he was committed to
protecting the industry’s value and increasing it but there is only one way to do that – and
that is for everyone to work together to protect the long-term viability of the sector and get
more from what we do now. Commercial beekeepers need to start seeing themselves as an
increasingly important contributor to our primary sector. When the primary sectors do
well, New Zealand does well (O’Connor, 2019).
In other words, we are all in this together.
Page 7 of 354. Aim
The aim of this report is to capture voices of the New Zealand honey industry, to provide
an insight into what is working and not working in the industry, and to provide a proposed
plan of action for meeting immediate requirements and future expectations of the industry.
It is not within the scope of this report or the writer’s expertise to find and ‘force’ solutions
onto the industry. Instead, this report aims to discuss the process for the industry to find
the solutions (as its members hold the answers) and implement them.
5. Methodology
The methodology used in this report is a mix of casual conversations to capture dialogue
themes, semi-structured interviews, thematic analysis to compare the different themes
captured in the survey, quantitative analysis of survey responses, and a literature review.
5.1 Dialogue themes
Firstly, casual conversations were undertaken to understand what industry members
thought was working and not working in the industry. I spoke with 22 members,
sometimes more than once, with conversations varying from 30 mins to over two hours to
capture dialogue themes.
5.2 Human psychology lens
Secondly, it became evident from the casual conversations that applying a human
psychology lens was the key to understanding the motivation behind the behaviour within
the industry. The lens was focused first by applying Maslow’s hierarchy of needs (see
Figure 1) as it states humans are motivated to fulfil their needs hierarchically, beginning
with their basic physical needs (of air, water, food, rest and health), before moving up to
security needs (of safety, shelter and stability), then social needs (of being loved,
belonging and inclusion), then esteem needs (of self-esteem, respect, recognition and
power), and finally the ultimate need of self-actualisation (self-fulfilment and reaching full
potential). In short, the bottom tiers focus on what humans need to survive and the top tiers
focus on what humans need to thrive.
Page 8 of 35Figure 1. Maslow’s hierarchy of needs. Source Abraham Maslow’s ‘A theory of human
motivation’
The lens was focused further by applying Hogan’s socioanalytic theory (see Figure 2) as it
states humans have three goals in life, the first goal is to get ahead, the second goal is to
get along and the third goal is to find meaning.
Figure 2. Hogan’s socioanalytic theory. Source Robert Hogan et al. ‘Personality Theory
and The Nature of Human Nature’
Page 9 of 35The lens was fully focused by overlaying the dialogue themes with Maslow’s hierarchical
order of human needs and Hogan’s hierarchical order of human goals (see Figure 3), which
identified these six areas of discussion:
1. Sustainable livelihood
2. Industry structure
3. Effective communication
4. Good leadership
5. Clear vision
6. Self-fulfilment
Figure 3. The 6 areas of discussion
The six areas of discussion covered each tier of the human needs/goals hierarchy. In short,
they created the key to understanding if the industry was meeting member needs/goals, and
the reasons behind member views and behaviour.
5.3 Terminology distinctions
Thirdly, most literature reviewed, and some respondents use terms like ‘company’,
‘organisation’ and ‘business’. For this report these terms are interchangeable with the term
‘industry’. This is because the human psychology aspect, which is the lens applied in this
research, remains constant regardless of the term. Think of it like industry is the family,
and company, organisation and business are the family members.
5.4 Respondent recruitment
Industry members were approached by phone prior to emailing the survey link if they were
known to me or someone in my personal network. If they were not known, the survey link
was emailed via ApiNZ’s (who offered to email it out) and Franklin Beekeepers database
or via NZ Beekeepers+ forum. Recruitment captured a full mix (see Table 3) of years
involved in the industry (with 47.4% majority being 20+ years), of roles within the
industry (with 47.4% majority producing/supplying honey), of geographic locations (with
Page 10 of 3524.6% majority being Northland/Auckland/Hauraki Plains) and of product worked with
(with 38.6% majority being Honey: Non-Mānuka).
Years in the industry 1 year or less
2-4 years
5-9 years
10-14 years
15-19 years
20+ years* (this was the majority at 47.4%)
Role in the industry Hobbyist
Produce/Supply Honey* (this was the majority at 47.4%)
Extract/Process Honey
Pack/Process Honey
Trade Honey
Market Honey
Queen Breeder
Bee Trader
Pollination
Beekeeping supplies
Industry Body
Geographical location Northland/Auckland/Hauraki Plains* (this was the majority at 26.4%)
Waikato/King Country/Taupo
Coromandel/Bay of Plenty/Rotorua/Poverty Bay
Hawke's Bay/Wairarapa/Manawatu/Taranaki/Wellington
Marlborough/Nelson/West Coast
Canterbury/Kaikoura
Otago/Southland
Product they work with Honey: Non-Mānuka* (this was the majority at 38.6%)
Honey: Mānuka
Honey: Multifloral
Bees: Breeding
Bees: Propolis, pollen, royal jelly, wax
People: Beekeepers, farmers/growers, packing plants
Table 3. Respondent demographics
5.5 Data collection
The data was collected online via a Google form. To allow respondents to speak freely the
data was collected anonymously. The survey questions were constructed around the six
areas of discussion and linked back into the research question of what is currently working
and not working in the industry. The survey captured 57 industry member voices and the
survey questions are included in Appendix 1.
5.6 Data analysis
Parts of the data collected was analysed quantitatively using pie charts or qualitatively
using thematic analysis to identify the main themes of the six areas of discussion. Then a
literature review was undertaken to compare what different sources of information said
about the six areas of discussion.
Page 11 of 356. Literature Review
This section reviews previous literature across the six areas of discussion, to gain an
understanding of existing definitions, observations and research relevant to each area.
6.1 Sustainable Livelihood
6.1.1 Definition
Chambers et al. (1992) defines a livelihood as comprising of people, their capabilities and
their means of living, including food, income and assets, while a sustainable livelihood
copes with and recovers from stress and shocks and provides for future generations.
6.1.2 Observation
According to Carr et al. (2017) a decent wage is important to job satisfaction and
influences mental and physical well-being. Haar et al. (2018) echoes this by finding strong
support for income predicting work-life balance and job satisfaction.
6.1.3 Research
Stats NZ (2019) states the average weekly expenditure for New Zealand households was
$1,349 and top weekly expenditure included housing, food, transport, recreation and
culture, health, clothing and footwear. Average weekly wage and salary earnings in 2020
in the Agriculture, Forestry and Fishing industry was $1,090 per week, which is $259 less
than average 2019 weekly expenditure. The industry also earned $119 less per week than
the ‘all industry groups’ average of $1,209 per week (Stats NZ, 2020). Comparing hourly
rates, the industry average is $26.78 per hour, $4.68 above the living wage of $22.10 per
hour (Living Wage, 2021) and $6.78 above the minimum wage of $20 per hour (MBIE,
2020).
6.2 Industry Structure
6.2.1 Definition
According to Thompson et al. (1995) most industries are populated by hundreds, even
thousands, of small and medium-sized companies, many privately held and none with a
substantial share of total industry sales. Porter (1980) defines a fragmented industry as one
with a large number of small or medium size firms where no firm has a significant market
share or strong influence on the industry. He states the main causes of industry
fragmentation include low overall entry barriers, the absence of economies of scale, high
transportation costs, high inventory costs or erratic sales, no advantages of size when
dealing with buyers or suppliers and local regulation.
6.2.2 Observation
Coriolis (2012) observed the New Zealand honey industry was relatively fragmented,
citing reasons like lack of industry cohesion, infighting and multiple Mānuka quality
standards including UMF, MGO, MGS and OMA, and they suggested industry
consolidation as the way forward.
6.2.3 Research
O.C. Tanner Institute (2019) found people want to connect, connections promote a sense
of belonging, connections create a feeling of making a difference, and employees who feel
a sense of belonging within their company are 5.3 times more likely to feel empowered to
perform their best work. Their 2020 study revealed when employees feel connected to
their teams, there is a 55% increase in engagement and an 83% increase in the incidence of
great work. The study also identified two traits of thriving teams: first, a strong sense of
autonomy because when people work together with strong bonds, there is 42% greater
Page 12 of 35odds they feel they have high autonomy, and second, a strong sense of psychological
safety because when people feel emotionally safe, they take risks, innovate and share ideas
without fear of negative consequences (O.C. Tanner Institute, 2020). In addition, Smithson
et al. (2009) found a collective voice can emerge as a result of collaborative arguing
(defined as reasoning together rather than against one another), and Brennan et al. (2015)
found team performance exceeded the efficiency of two individuals working
independently, proving two heads are better than one. Finally, Estlund (2003) explored
how workplace bonds strengthen a diverse democracy. She argues when working together,
co-workers learn about each other’s lives and develop feelings of affection, empathy,
sympathy and loyalty for each other. They also experience friction and conflict but with
everything at stake, they often find ways to work through or around conflicts and to get the
job done in spite of personal differences. So, who consolidates this diverse democracy?
Coulet (2019) says it’s the role of the industry body to consolidate the industry viewpoint,
acting as the main point of contact and speaking on behalf of their members to
Government and regulators, who find it easier talking to an industry body rather than every
group active in the industry. So, who makes up the industry body? Boleat (2001) states the
industry body board should be representative of the industry membership. This means
board members often represent companies that compete, so they have a schizophrenic role
in that they are responsible for governing the industry while at the same time representing
the interests of their companies. But he warns board members must serve the interests of
the whole industry, not just their own.
6.3 Effective Communication
6.3.1 Definition
Covey (1989) defines effective communication as doing all four types of communication
well (reading, writing, speaking and listening). He credits communication as being the
most important skill in life and believes the key to effective communication is first seek to
understand, then to be understood. Sinek (2009) agrees by saying communicating is not
about speaking, it is about listening. He adds communication is not about speaking what
we think, it is about ensuring others hear what we mean (Sinek, 2019).
6.3.2 Observation
Sinek (2009) states people are drawn to leaders who are good at communicating, and
Landry (2019) believes effective communication is vital to gain trust, align efforts in the
pursuit of goals, and inspire positive change. She found when communication is lacking,
important information can be misinterpreted, causing relationships to suffer and,
ultimately, creating barriers that hinder progress.
6.3.3 Research
Baldoni (2010) found companies that communicate effectively had a 47% higher return to
shareholders over a five-year period, and effective internal communications keeps
employees engaged in the business. Furthermore, Patterson et al. (2011) found what made
people great communicators was their ability to stay focused on the purpose of the
communication and listen to the other person’s opinions. Curtin (2019) found when an
employee felt heard, they are 4.6 times more likely to feel empowered to perform to the
best of their abilities. Finally, Plumberg (2018) found miscommunication had a
tremendous impact on the workplace. His study showed 44% said miscommunication
caused a delay or failure to complete projects, 31% said it caused low morale, 25% said it
caused missed performance goals and 18% said it caused lost sales.
Page 13 of 356.4 Good Leadership
6.4.1 Definition
According to Sinek (2014) good leaders always work for the people and put their own
interests aside to protect the people and to pull them into the future. He believes leadership
is not about being in charge, it is about taking care of those in your charge (Sinek, 2016).
He also believes the goal of leadership is to set a culture (which he defines as values +
behaviour) free of danger from each other. The way to do that he explains is by giving
people a sense of belonging, by offering them a strong culture based on a clear set of
human values and beliefs, by giving them the power to make decisions, by offering trust
and empathy, and by creating a ‘Circle of Safety’ around them to reduce the threats they
feel inside the group. He says the more we trust that the people to the left and to the right
of us have our backs, the better equipped we are to face the constant threats from the
outside together, pull together as a unified team, and be better able to survive and thrive
regardless of the conditions outside. He concludes every member of the group plays a role
in maintaining the Circle of Safety, and it is the role of leaders to ensure that they do,
because without a ‘Circle of Safety’ people are forced to spend too much time and energy
protecting themselves from each other (Sinek, 2014).
6.4.2 Observation
In support, Hogan et al. (2005) believes leadership should be viewed by the ability to build
and maintain a group and evaluated by the performance of the group over time. He
believes bad leadership almost always creates disengaged members, individual chicanery,
and eventually industry failure. People who rise to the tops of large organisations he
believes are distinguished by hard work, brains, ambition, political skill, and luck, but not
necessarily by talent for leadership. According to Collin (2001) the thing that sets top
leaders apart is they understand the importance of putting people first and strategy second.
Giles (2021) echoes this by saying leaders’ number one job is providing safety for others
and then creating connection. She found when people feel safe and connected, they can
unleash their innate genius for radical innovation, permanent change and transformational
learning. She also found the five most important leadership competencies are centred
around soft skills and emotional intelligence (Giles, 2016). In addition, Kouzes et al.
(2002) found exemplary leadership always 1) models the way, 2) inspires a vision, 3)
challenges the process, 4) enables others to act, and 5) encourages the heart. Furthermore,
Kotter (2001) reflects what leaders really do is prepare organisations for change and help
them cope as they struggle through it. He believes most organisations are over-managed
and under-led because leadership is about behaviour, vision, people buying in, taking an
organisation into the future, and producing useful change (Kotter, 2013). Finally, Lorigan
(2021) agrees by saying it is leadership, not management, that has the most profound
influence on organisational success.
6.4.3 Research
Studies prove that under competent leadership, people and companies prosper. Joyce et al.
(2003) found CEOs account for about 14% of the variance in firm performance, and
Barrick et al. (1991) found high performers add an additional $25 million in value to an
organisation during their tenure. O.C. Tanner Institute (2020) discovered great leaders
connect employees to three things: purpose, accomplishment, and one another. They found
when leaders connect their people to purpose, employees are 373% more likely to have a
strong sense of purpose, 747% more likely to be highly engaged, and 49% less likely to
burn out. They also found when leaders connect their people to accomplishment, there is a
259% increase in odds an employee will have a strong sense of opportunity, 247% increase
Page 14 of 35in odds an employee will do great work, and they will be 46% less likely to burn out.
Finally, they found when leaders connect their people to one another, there is a 156%
increase in odds that an employee will have a strong sense of wellbeing, a 374% increase
in odds that an employee will feel appreciated, and the employee will be 47% less likely to
burn out.
6.5 Clear Vision
6.5.1 Definition
Ireland et. al. (2009) defines vision as a big picture about desired future status of the
organisation. If the vision is simple, then people can directly identify what they have to do
in the organisation to achieve its goals and objectives. In agreement, Sinek (2018) says a
vision is the starting point, the basic building block. It feeds people’s soul and makes them
feel like their life has value and their work has meaning. When there is a vision, everyone
is pulling toward the same goal and they start trusting each other.
6.5.2 Observation
According to Sinek (2017) a vision paints a clear picture of what the world could look like
if everything goes perfectly. It is an ideal and it is to inspire people to act. He observes
there are two ways to influence human behaviour, you can either manipulate it or inspire it
(Sinek, 2016) so a vision inspires us and gives us a reason to go to work (Sinek, 2014).
Vision he believes is about a cause so just people would willingly sacrifice their time,
money or bandwidth to help advance this cause (Sinek, 2020), and with a vision people
know what they stand against and stand for (Sinek, 2009). In addition, Mollenhauer (2015)
stresses without a vision your company is going nowhere because employees are inspired
by seeing a clear direction forward and can align their energies and resources to achieving
progress. Wictor et al. (2011) adds the vision is like an umbrella and affects many
important parts of the company such as communication and culture. Finally, Thompson et
al. (2010) found that five steps must be followed when implementing corporate vision
namely, 1) developing a strategic vision, 2) setting objectives, 3) crafting a strategy to
achieve the objectives and vision, 4) implementing and executing the strategy, and 5)
monitoring developments, evaluating performance and making corrective adjustments.
6.5.3 Research
Carton et al. (2018) studies found the more concrete a vision statement is, the more
effectively it can inspire employees. In addition, Sherman (2017) researched LEGO,
Starbucks and Apple and found they were examples of companies who achieved success,
then foundered after straying from their core purpose, then were rescued by a CEO who
recommitted the company to its vision. He explains LEGO weakened its core value
proposition by adding excessive product line complexity and pursuing brand-diluting
diversifications including children's wear, watches and theme parks (in response to the
video game and Internet eras). CEO Jørgen Knudstorp entered and restored LEGO’s core
values by thinking “what’s the really compelling reason why we exist as a company?”
Starbucks CEO Howard Schultz returned to the troubled company in 2008 after an eight-
year absence and doubled down on Starbucks’ brand promise “to inspire and nurture the
human spirit - one person, one cup and one neighbourhood at a time.” Apple was in deep
financial trouble and the first thing Steve Jobs did when he returned as CEO in 1997 was
to refocus the company on its founding mission and pronounce Apple’s intent to “do a few
things extraordinarily well, rather than doing lots of mediocre things”.
Page 15 of 35You can also read