Accurate diagnosis of atopic dermatitis by combining transcriptome and microbiota data with supervised machine learning - Nature
←
→
Page content transcription
If your browser does not render page correctly, please read the page content below
www.nature.com/scientificreports
OPEN Accurate diagnosis of atopic
dermatitis by combining
transcriptome and microbiota data
with supervised machine learning
Ziyuan Jiang1,8, Jiajin Li2,8, Nahyun Kong3, Jeong‑Hyun Kim4, Bong‑Soo Kim5, Min‑Jung Lee5,
Yoon Mee Park4, So‑Yeon Lee6, Soo‑Jong Hong6* & Jae Hoon Sul7*
Atopic dermatitis (AD) is a common skin disease in childhood whose diagnosis requires expertise
in dermatology. Recent studies have indicated that host genes–microbial interactions in the gut
contribute to human diseases including AD. We sought to develop an accurate and automated pipeline
for AD diagnosis based on transcriptome and microbiota data. Using these data of 161 subjects
including AD patients and healthy controls, we trained a machine learning classifier to predict the
risk of AD. We found that the classifier could accurately differentiate subjects with AD and healthy
individuals based on the omics data with an average F1-score of 0.84. With this classifier, we also
identified a set of 35 genes and 50 microbiota features that are predictive for AD. Among the selected
features, we discovered at least three genes and three microorganisms directly or indirectly associated
with AD. Although further replications in other cohorts are needed, our findings suggest that these
genes and microbiota features may provide novel biological insights and may be developed into useful
biomarkers of AD prediction.
Atopic dermatitis (AD) is a type of inflammatory skin disease resulting in red, itchy, swollen, cracked, and irri-
tated skin, which is a severe form of e czema1. It is more prevalent in children but can occur at any age. Studies
found that about 15% of children under 15 years of age are affected by AD in the United States2, while only about
7% of adults have A D3. In addition to the discomfort in the skin, children with AD may develop inhalant allergic
diseases such as a sthma4 and allergic r hinitis5 as well as mental disorders such as anxiety and d
epression6. Hence,
AD may impose a high economic burden and have considerable negative effects on life quality7–9, which is a sig-
nificant cost to society. However, there is no cure for this disease except a few treatments to relieve the s ymptoms8
because its causes are complicated10. For decades, treatment of AD has been limited to topical corticosteroids,
topical calcineurin inhibitors, and for those with moderate to severe AD, systemic immunosuppressants11. In
patients with moderate to severe AD, biological therapy such as dupilumab shows good results, but the high
drug cost is a burden on patients with A D10,11.
Recently, the important role of colonic epithelial cells (colonocytes) has been implicated in the host–microbial
interactions, and these gut epithelial cells contribute to the microbiota composition and activities following gut
dysbiosis, affecting many chronic human d iseases12. In addition, integration and correlation analyses of host
genes expression and gut microbiota have emerged as an important opportunity for diagnosis and prediction of
human diseases including AD13,14; for instance, associations between enzyme commission genes and microbiota
in inflammatory bowel diseases15, and also between IL-17 and Streptococcus in AD16. However, there have been
few studies on prediction analysis using machine learning based on the gut transcriptome and microbiota in AD.
1
Department of Automation, Tsinghua University, Beijing 100084, China. 2Department of Human Genetics, David
Geffen School of Medicine, University of California, Los Angeles, Los Angeles, CA 90095, USA. 3Department
of Biological Sciences, Korea Advanced Institute of Science and Technology, Daejeon, Daejeon 34141,
Republic of Korea. 4Department of Medicine, University of Ulsan College of Medicine, Seoul 05505, Republic of
Korea. 5Department of Life Science, Multidisciplinary Genome Institute, Hallym University, Chuncheon 24252,
Republic of Korea. 6Department of Pediatrics, Asan Medical Center, Childhood Asthma Atopy Center, Humidifier
Disinfectant Health Center, University of Ulsan College of Medicine, Seoul 05505, Republic of Korea. 7Department
of Psychiatry and Biobehavioral Sciences, University of California, Los Angeles, Los Angeles, CA 90095,
USA. 8These authors contributed equally: Ziyuan Jiang and Jiajin Li. *email: sjhong@amc.seoul.kr; jaehoonsul@
mednet.ucla.edu
Scientific Reports | (2022) 12:290 | https://doi.org/10.1038/s41598-021-04373-7 1
Vol.:(0123456789)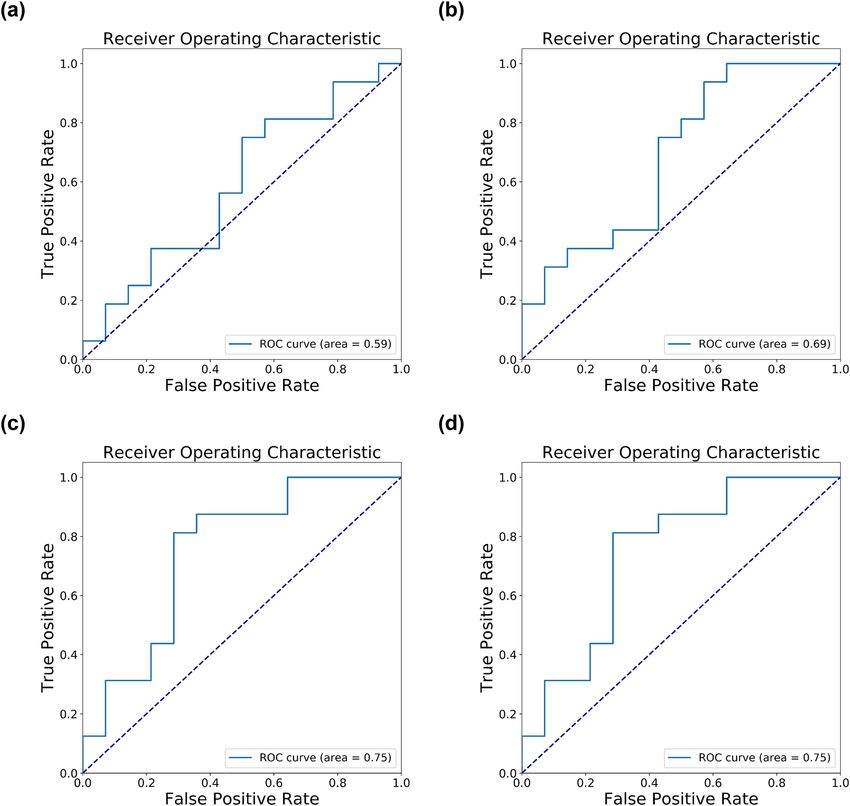
www.nature.com/scientificreports/
It is challenging to diagnose AD because of its variable morphology, distribution, and irregularity. Based on
its main clinical features, diagnostic criteria have been developed and used w orldwide17,18. Besides, the assess-
ment of disease severity is problematic due to the lack of objective and effective m arkers19. This is concerning as
physicians need to make decisions about treatment based on the diagnosis of AD and its severity, which might
be related to the prognosis. Therefore, an accurate and automated diagnosis of AD and an improved set of bio-
markers for it could have a potentially high impact.
In this paper, we develop a machine learning classifier for accurate and automated diagnosis for AD using the
transcriptome of gut epithelial colonocytes and gut microbiota data. A classifier is an algorithm that implements
classification, which maps the input data to specific classes. In our study, an AD classifier takes transcriptome data
and/or microbiota data as input data and outputs the predicted status of AD. Specifically, we use transcriptome
and metagenome data to achieve the comprehensive gene expression and microbiota profiles of individuals with
moderate to severe AD and controls. We develop a robust machine learning pipeline including feature selec-
tion, model selection, cross-validation, classification, and follow-up statistical analyses, which can differentiate
between subjects with and without AD based on the omics data with high accuracy.
Materials and methods
Sample collection and disease diagnosis. In this study, we collected the transcriptome of gut epithe-
lial colonocytes and gut microbiota data of 161 subjects including 88 cases (patients with AD), 73 controls
(healthy individuals). AD subjects were recruited from the Childhood Asthma Atopy Center of Asan Medical
Center, Seoul, Korea, and were diagnosed in accordance with the criteria of Hanifin and Rajka20. All individu-
als are children aged from 6 to 72 months. The SCOring AD (SCORAD) value, as an important AD assessment
index for the extent and severity of AD, was assessed by pediatric allergists based on the guidelines for the
SCORAD index21. Total serum immunoglobulin (IgE) levels in the peripheral blood were measured using the
ImmunoCAP system (Phadia AB, Uppsala, Sweden). The parents and guardians of all children provided written
informed consent for their participation, and this study protocol was approved by the human ethics committee
at Asan Medical Center (Institutional Review Board No. 2008-0616, 2015-1031, and 2017-0923).
Transcriptome and microbiota data. Transcriptome data was obtained from mRNAs extracted the
exfoliated colonocytes of each fecal specimen using the GeneChip Human Gene 2.0 ST Array (Affymetrix, Santa
Clara, CA) under the manufacturer’s protocol. Microbiota data was obtained from the fecal samples using the
Power Microbial RNA/DNA Isolation kit (MO BIO/Qiagen, Carlsbad, CA, USA), polymerase chain reaction
(PCR) amplification based on primers targeting the V1-V3 variable region of 16S rRNA gene, and sequenc-
ing the Roche/454 FLX Titanium system (Roche, Mannheim, Germany) and MiSeq (Illumina, San Diego, CA)
under the manufacturer’s instructions. Since there was the requirement of actual read counts for quality control
and the difficulty in a direct comparison between these two sequencing platforms, we focused on the common
phylum and genus. More detailed information on the sequencing method is provided in our previous studies22,23.
AD machine learning classifier. We built the supervised machine learning pipeline that predicts atopic
dermatitis status using transcriptome and microbiota data. This pipeline includes prepossessing, feature selec-
tion, model selection and improvements, integration of microbiota data, and performance e valuation24. The
pipeline is implemented with Python 3.7 and the scikit-learn package25.
Prepossessing. Initially, there were 161 samples in the transcriptome dataset and the microbiota dataset, respec-
tively. 160 samples existed in both datasets. For one individual with only transcriptome data, we imputed its
microbiota data using a mean values imputation approach that assumes missing values are missing completely
at random (MCAR). For one individual with only microbiota data, we removed this sample as it is difficult to
impute its transcriptome data due to a large number of genes to impute (one hundred times more genes in the
transcriptome data than microorganisms in the microbiota data). At the end of this process, we have the set of
identical 161 samples in both transcriptome and microbiota datasets.
Among the 161 samples, there were 88 AD patients and 73 controls, and we split them into the training set (n
= 131) and the test set (n = 30). As the numbers of cases and controls were different, we used a stratified split to
guarantee that the balance of cases and controls is consistent across training and test sets. We then used min-max
normalization to scale the transcriptome and microbiota data so that the data range from 0 to 1, calculated as:
′ x − min(x)
x =
max(x) − min(x)
where x is a vector of the values of a feature. We use this normalization method because we want to ensure that
the scaled data are positive. We normalize the training and test sets together.
Feature selection. As it is unlikely that a disease is strongly associated with more than 40,000 genes, most of the
genes would be unrelated to the disease or have negligible effects. Therefore, feature selection on the training
dataset is necessary to identify a subset of predictive genes, whose expression data could predict atopic dermati-
tis as accurately as possible. The two main aspects we considered were: (1) the optimal number of features to be
selected in the entire dataset, and (2) the exact features chosen from the original training set.
Typically, there are three types of widely used feature selection methods. They are Filter, Wrapper, and Embed-
ded methods26. We selected three methods from each type: Chi-squared Test, Recursive Feature Elimination
(RFE), and Random Forest Classifier (RFC) because they are efficient and applied in the previous r esearch27.
Scientific Reports | (2022) 12:290 | https://doi.org/10.1038/s41598-021-04373-7 2
Vol:.(1234567890)www.nature.com/scientificreports/
Specifically, RFE requires the results from the models, and hence we chose Logistic Regression (LR), Support
Vector Machine (SVM), and Random Forest Classifier (RFC) as the models in conjunction with RFE. These
combinations are referred to as LR-RFE, SVM-RFE, and RFC-RFE, respectively.
After introducing the specific methods for feature selection, we should then consider the problem of overfit-
ting. It is hard to extract correct features from high-dimensional datasets with small sample sizes.
Cross-validation (CV) is important in preventing overfitting28,29. In our task, we designed two plans (Plans
A and B) for feature selection using cross-validation. Note that we do cross-validation and feature selection on
the training set only so it will not cause data leakage. Plan A: we performed a 5 by 5 nested cross-validation for
feature selection, which consisted of a fivefold inner CV round and a fivefold outer CV round. We used the outer
CV on the entire training set to evaluate the model performance, and the inner CV is applied to the outer CV
training split to select the set of predictive features (Supplementary Fig. S1A). In other words, supposing that
the outer CV training split named D is used for feature selection, we executed a fivefold CV on D (i.e., inner CV)
and determined the optimal number of features to select in D, which could achieve best average performance in
the inner CV. Then we calculated the overlapping features across all training splits of the outer CV. Denote the
number of features in the final set as nA. In a given inner CV training split, all the features are ranked by their
weights (feature importance) assigned by the classification model trained with the inner CV training split. Then
we selected top k features with k starting from 44,608 (all features) and being reduced by 10% in each iteration
until k = 1, and trained models with the inner CV training split and evaluated them with the inner CV test split
(the validation set). The optimal value of k was selected to generate the model with the best performance. In the
outer CV training split, all the features are ranked using the same method as applied to the inner CV training
split. Then we selected k top features to identify the set of predictive features for this outer CV training split, where
k is the optimal number of features determined in the inner CV. The outer CV test set will be used for model
selection and hyper-parameter tuning with the k selected features in the follow-up analysis instead of feature
selection. We then repeated this process over all the five outer CV training splits and yielded five sets of predic-
tive features. Finally, we selected the intersection set of them as the final set of predictive features for the entire
original training set. Plan B: instead of using a nested cross-validation, we only performed one fivefold cross-
validation on the entire training set and directly selected nB top features on its training splits, D (Supplementary
Fig. S1B, S2), where the features are ranked by test scores such as the p values of χ 2 test between the features and
the disease statuses. nB is determined as the value that produces the model with the best average performance
in the outer CV test sets (the validation set). The final set of predictive features are the top nB features chosen in
the entire original training set.
As mentioned before, to decide the two main aspects regarding feature selection, we considered different
feature selection methods and many possible numbers of features based on a set of criteria. We used fivefold
cross-validation to evaluate the performance. In detail, we employed the average F1-scores from outer CV
test sets as metrics. We compared plan A and plan B, combined with five candidate feature selection methods:
RFE-LR, RFE-SVM, RFE-RFC, Chi-square Test, and RFC. Based on the comparison results (see supplementary
methods), we took the following steps to select the best feature number: we first calculated feature importance
in each training split in the outer CV, ranked the features by their average feature importance, and chose the
top n features from the training set whose feature importance was greater than a threshold (Plan B). Finally, we
chose 35 features using the Chi-squared test in the entire original training set.
Model selection and improvements. We trained four different machine learning models, (1) Logistic Regression
(LR), (2) Support Vector Machine (SVM) with linear and rbf kernels, (3) Random Forest Classifier (RFC)30, and
(4) XGBoost31 with the outer CV training splits. XGBoost is a tree boosting method, demonstrated to perform
extremely well in multiple classification tasks. We chose the best model among the four models by comparing
the average F1-scores on outer CV test splits.
Jittering. Jittering is a useful tool to mitigate overfitting32. We added random noises to the training set of the
original data before normalization and feature selection. The noise followed a normal distribution of
s ∼ N(0, σ 2 I)
where I is the intensity of noises and the variance σ 2 = 1. Although jittering might reduce the classification
accuracy of the model on training sets, proper noises could increase the robustness of the algorithm, narrowing
the performance gap between training and test sets, and therefore reducing the possibility of overfitting. Note
that jittering is only performed on the transcriptome data in the training set. It is because the microbiota data
contain many zero values and thus adding noises to it will distort the data.
Thresholding. Moreover, we consider the effect of changing the probability threshold (pt) in prediction. A sam-
ple is predicted to be a case by the model if the predicted probability is greater than a certain threshold (pt) where
the default value is 0.5. Different probability thresholds should be examined to see whether they could further
improve the model performance. For this improvement, we first selected the model with the best performance
using the default probability threshold (0.5). Then we changed the machine learning model such that it generates
the probability (pt) as output. We tested different thresholds and chose the best one based on the outer CV test
split evaluation.
Feature importance. After comparison, we selected the Chi-squared test as our feature selection method. We
used the “SelectedKBest" function in the scikit-learn package25 to implement the Chi-squared test. After iden-
Scientific Reports | (2022) 12:290 | https://doi.org/10.1038/s41598-021-04373-7 3
Vol.:(0123456789)www.nature.com/scientificreports/
tifying k features, we also want to rank the features based on a certain criterion. This function has an attribute
named “scores_", and it returns the scores of features. The Chi-squared test is used to test the independence of
two events.
In our binary classification problem, we have X as the input data with the size of (n_sample, n_feature),
which are the number of samples and features respectively, and also y as the label of each sample with the size
of n_sample. For calculation, we expand the size of y to (n_sample, 2). The first column of y represents the first
class and the second stands for the second class. For each row, the elements will either be (1, 0) or (0, 1), which
indicates that the sample of this row belongs to the first class or the second class.
After that, we calculated the observed result fobs,
fobs = y T X
Next, we calculated the expected result fexp. To do this, first, we acquired feature_count, which is a (1, n_fea-
ture) matrix, and each column is the sum of this feature in each sample. Secondly, we obtained class_prob, which
is a (1, 2) matrix, and each column is the mean of this class. Now we can get fexp,
fexp = class_probT · feature_count
Finally, we calculated the χ 2 value by the following equation,
2
fobs − fexp
χ2 =
fexp
where χ 2 is a (2, n_feature) matrix. We summed up the result along the column and calculated the scores_ vector
of size n_feature. It represents the scores of the features, where column i of scores_ is the score of the i-th feature.
In our task, higher values suggest higher importance of features. Therefore, we could compare each feature
relatively from their feature importance.
Integration of microbiota data. In addition to the transcriptome data, we integrated the microbiota data to
improve the performance of the AD classifier. We tested four methods when incorporating the microbiota data
and evaluated their performance using the outer CV test set:
(1) a method that uses microbiota data only, (2) a method that uses transcriptome data only, (3) a method
that combines transcriptome and microbiota data first, then performs feature selection and trains the model, and
(4) a method that performs feature selection on transcriptome and microbiota data separately, then combines
the two types of data and trains the model. We used similar feature selection methods as described above for
microbiota data. The comparison of these four methods is in Supplementary Table S1.
Performance evaluation. We evaluated the prediction accuracy of the AD classifier using the test set, which
is not used in training. We calculated several performance metrics including accuracy, precision, recall, and
F1-score. In binary classification problems, we calculated those metrics as follows:
Predicted class
Actual class
True False
b (False Nega-
True a (True Positive)
tive)
d (True Nega-
False c (False Positive)
tive)
a a a+d 2pr 2a
Precision = p = , Recall = r = , Accuracy = , F1−score = =
a+c a+b a+b+c+d p+r 2a + b + c
We used F1-score as the main evaluation metric in this paper as it is a harmonic mean of precision and recall,
leading to a more general and reliable assessment of the model performance, especially when classes are imbal-
anced. F1-score ranges from 0 to 1 where the performance is better when the F1-score is closer to 1. In addition
to these metrics, we plotted the Receiver Operating Characteristic (ROC) curve by plotting the true positive rate
(TPR) against the false positive rate (FPR) at different threshold settings. We then calculated the area under the
ROC curve (AUC), which also ranges from 0 to 1 where 1 represents the perfect performance.
Assumptions in experimental settings. In building and testing the AD classifier pipeline, we have several hyper-
parameters such as feature numbers, feature selection methods, and training models. As examining all combina-
tions of hyper-parameters is exponential in the number of hyper-parameters, our experiments are based on the
assumption that every variable or hyper-parameter is weakly correlated to each other. It means that optimizing
a hyper-parameter one at a time yields a similar model when optimizing all hyper-parameters at the same time.
Ethics approval. The parents and guardians of all subjects provided written informed consent for their
participation, and this study protocol was approved by the human ethics committee at Asan Medical Center
Scientific Reports | (2022) 12:290 | https://doi.org/10.1038/s41598-021-04373-7 4
Vol:.(1234567890)www.nature.com/scientificreports/
All Cases (AD) Control (No AD) Cases (AD) vs control (No AD) t test p value
Average age: months 14.21 ± 2.14 17.37 ± 3.48 10.81 ± 2.15 0.001
Sex: female 72 32 40 –
a
SCORAD – 32.86 ± 5.49 – –
Total IgE (IU/ml) 135.191 ± 83.53 243.06 ± 160.21 22.83 ± 9.46 0.004
Table 1. Baseline characteristics of the subjects in this study. a SCORAD: SCOring AD value, an AD
assessment index that is only available for patients.
(a)
: process
: object training set fine-tune by cross
feature selection
(n=131) validation
selected
transcriptome dataset
prepocessing classification evaluation
(n=165, 44608 genes) features
test set
(n=30)
(b) : process
: object
training set fine-tune by cross
feature selection
(n=131) validation
transcriptome dataset
(n=165, 44608 genes)
selected
data intergration prepocessing classification evaluation
features
microbiota dataset
(n=165, 366 genes)
test set
(n=30)
Figure 1. The overview of atopic dermatitis classification pipelines in two settings. (a) Transcriptome dataset
only, and (b) transcriptome and microbiota data.
(Institutional Review Board No. 2008-0616, 2015-1031, and 2017-0923). All research was performed in accord-
ance with relevant guidelines and regulations.
Results
Data description. We acquired the transcriptome profiles and the microbiota data of 161 subjects, who
were recruited from the Cohort for Childhood Origin of Asthma and Allergic Diseases birth cohort and the
Asthma Atopy Center of Asan Medical Center, Seoul, Korea. After preprocessing, there are 88 cases (patients
with AD) and 73 controls (healthy individuals). As summarized in Table 1, the mean age was higher in the AD
patient group than the controls (17.37 ± 3.48 month vs. 10.81 ± 2.15 month, P = 0.001), and the serum total IgE
levels were significantly higher in the AD group (243.06 ± 160.21 IU/ml vs. 22.83 ± 9.46 IU/ml, P = 0.004). On
average, subjects without AD are 3.16 months younger than individuals with the disease. After preprocessing
and normalizing the raw gene expression and the microbiota data, there are 44,608 gene expression probes and
366 taxa of microorganisms used for developing a machine learning pipeline.
Scientific Reports | (2022) 12:290 | https://doi.org/10.1038/s41598-021-04373-7 5
Vol.:(0123456789)www.nature.com/scientificreports/
Feature selection method (number of features) + Classification method F1 score Accuracy Precision Recall
All features (44,608) + SVM (rbf) 0.7272 0.6000 0.5714 1.0000
chi-squared test (35) + SVM (rbf) 0.7647 0.7333 0.7222 0.8125
All features (44,608) + SVM (rbf), with noise (I = 0.001) and probability threshold = 0.3 0.7111 0.5667 0.5517 1.0000
chi-squared test (35) + SVM (rbf), with noise (I = 0.001) and probability threshold = 0.3 0.7647 0.7333 0.7222 0.8125
Table 2. The results on different methods with transcriptome data only. The first method trained the model
on the original training set without feature selection. The second method performed feature selection by
chi-squared test and selected 35 features. For the last two methods, they are similar with the first two methods
respectively while the only difference was that they added the noise and changed the probability threshold. The
random seed of the noise was 21, which was the best result on this intensity (I = 0.001).
Developing atopic dermatitis classifiers. To accurately predict AD incidence, we design two machine
learning classifiers: one using only transcriptome data (Fig.1a) and the other using both transcriptome and
microbiota data (Fig.1b). Both classifiers consist of several computational steps, and we describe each step briefly
here (see “Materials and methods” for details). First, we preprocess the data such as removing duplicates, imput-
ing missing values, splitting the data into training and test sets, and performing normalization. Second, we per-
form feature selection using the training set with the cross-validation to identify the best set of features for pre-
diction (e.g., expression of specific genes or specific taxa) as well as to choose the best machine learning model.
To improve the performance of the classifier, we consider changing a few hyper-parameters such as adding
certain levels of noise to expression data and changing the probability threshold to classify cases and controls.
Lastly, we apply the trained machine learning model and selected features to the test set for classification and
evaluate the performance of the machine learning model. As our dataset consists of a high-dimensional feature
set from a limited sample size, we primarily focus on developing a machine learning classifier that is robust with
the small sample size, prevents overfitting, and prioritizes genes or features for prediction.
Evaluation of transcriptome only classifier. The transcriptome data are available from 161 individuals
whose gene expression profile is measured at 44,608 probes (“features”). As a large number of features have nega-
tive effects on classification performance such as causing overfitting, we perform feature selection to identify a
subset of informative features. We use a fivefold cross-validation approach using a training set (n = 131) and test
several feature selection methods such as recursive feature elimination (RFE), support vector machine (SVM),
and chi-squared test. We measure the performance of feature selection methods using F1 score and find that
the chi-squared test approach selecting about 35 features from the training set has the best performance. So we
decide to select 35 features with feature importance ≥ 0.95 which can achieve the highest performance (Sup-
plementary Fig. S3).
Once we identify the set of best features or genes for prediction, we next seek to identify the best machine
learning model for prediction. We test several machine learning (ML) models such as Logistic Regression (LR),
Support Vector Machine (SVM), Random Forest Classifier (RFC), and XGBoost. We use a 5-fold cross-validation
with a training set and 35 features to evaluate the performance of each ML model and find that SVM with the
rbf kernel has the highest F1 score (Supplementary Table S2). To improve the performance of our ML classifier,
we vary the probability threshold (pt) when making predictions on the case-control status; an individual is pre-
dicted to be a case if the predicted probability is greater than pt and by default, pt = 0.5. Results show that pt = 0.3
generates the best F1 score using 5-fold cross-validation (Supplementary Table S3). Lastly, another improvement
we make to the ML classifier is jittering, which is adding random noises to transcriptome data. With jittering, it
may be difficult for the machine learning models to fit the data, and therefore it may enhance the generalization
ability and reduce the overfitting. We add different levels of noise and observe the highest F1 score with a noise
level of I = 0.001 using SVM on 5-fold cross-validation (Supplementary Table S4).
After we identify the best ML model and features as well as improvements based on the performance using
the training set, we evaluate the AD classifier on the test set (n = 30). We use a variety of metrics such as F1 score,
accuracy, precision, recall, and the area under the curve (AUC) under the receiver operating characteristic (ROC)
curve. In addition to the best AD classifier we identified, we also test classifiers without feature selection and the
improvements to observe their impact on the performance. Specifically, we test four models: (1) SVM with all
features, (2) SVM with the best 35 features, (3) SVM with all features and with jittering and best pt threshold,
and (4) SVM with the best 35 features and with jittering and best pt threshold.
Results show that feature selection improves the performance as expected; both SVM models with feature
selection have higher F1 scores (0.76) than models without feature selection (0.71 and 0.73, Table 2). However,
the impact of feature selection is not dramatic as the F1 score improves by at most 0.05, similar to the enhance-
ment in the training set (from an F1 score of 0.7397 without feature selection to an F1 score of 0.7809 with feature
selection). Also, improvements that include jittering and the best pt threshold do not increase the performance
as the F1 score of the SVM model with those improvements is identical to that without the improvements in the
test set, although we observe higher F1 scores with the improvements in the training set where we observed F1
score of 0.80 with the best pt threshold and F1 score of 0.78 without the improvement. In terms of AUC under the
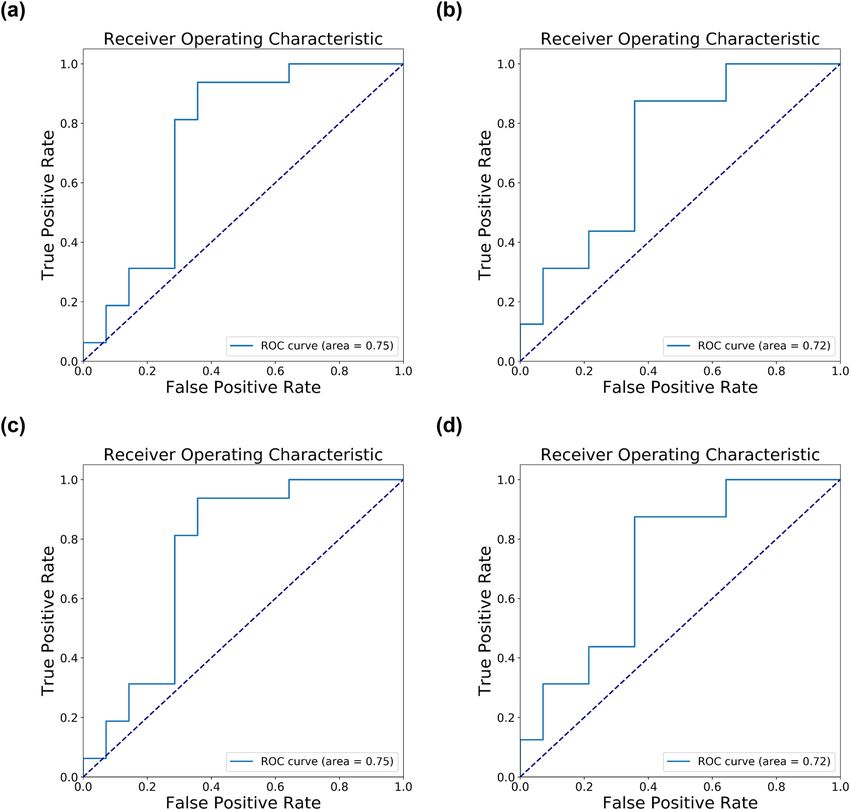
ROC curve, the best AUC is observed when using all features (AUC of 0.75) while the SVM models with feature
selection have slightly lower AUC (0.72, Fig. 2). The modest enhancement in performance by feature selection
and other improvements in the test set may be due to the small sample size of the test set. We also examined the
Scientific Reports | (2022) 12:290 | https://doi.org/10.1038/s41598-021-04373-7 6
Vol:.(1234567890)www.nature.com/scientificreports/
Figure 2. The ROC curve of the test set with transcriptome data only. (a) All features (44,608) + SVM (rbf). (b)
Chi-squared test (35) + SVM (rbf). (c) All features (44,608) + SVM (rbf), with noise (I = 0.001) and probability
threshold = 0.3. (d) Chi-squared test (35) + SVM (rbf), with noise (I = 0.001) and probability threshold = 0.3.
performance of our AD classifier with only 19 of the 35 selected probes, which explicitly represents expressed
genes with gene symbols (Supplementary Table S5). We observed the greatly increased performance of our AD
classifier, which achieved an F1 score of 0.84 (Supplementary Table S6). Interestingly, applying jittering and
thresholding did not further improve its performance. It was probably due to the smaller number of selected
features that were more representative and informative. So the overfitting issue might be mitigated and thus it
is unnecessary to use jittering and thresholding.
Evaluation of the classifier with microbiota data. In addition to the transcriptome data, we have
microbiota data from 161 individuals with 366 phylum and genus features, and we build the ML classifier that
uses both transcriptome and microbiota data (Fig. 1). Similar to the transcriptome-only classifier, we first per-
form feature selection on the microbiota features using a training set (n = 131) with the same cross-validation
approach and feature selection methods. If using microbiota data only, we observe the best performance in terms
of F1 score (0.73) with the SVM approach using 25 microbiota features (Supplementary Table S1). Additionally,
we perform feature selection after combining microbiota and transcriptome data and find that 50 microbiota
and 35 transcriptome features generate higher F1 scores (Supplementary Table S1). As for the other improve-
ments in the ML model, we use the same probability threshold (pt = 0.3) and noise level (I = 0.001) as ones we
used for the transcriptome-only classifier; these thresholds and noise levels also generate the best performance
(Supplementary Table S7, S8).
Next, we evaluate the prediction ability of the microbiota data on AD using six different classifiers with a test
set (n = 30): (1) SVM using all microbiota features, (2) SVM using the best 25 microbiota features, (3) SVM using
the best 50 microbiota and 35 transcriptome features, (4) the first, (5) the second, and (6) the third models with
pt and jittering improvements. Results show that the classifiers that combine microbiota and transcriptome data
Scientific Reports | (2022) 12:290 | https://doi.org/10.1038/s41598-021-04373-7 7
Vol.:(0123456789)www.nature.com/scientificreports/
Feature selection method (number of features) + Classification method F1 score Accuracy Precision Recall
All features (366) + SVM (rbf) 0.7111 0.5667 0.5517 1.0000
chi-squared test (25) + SVM (rbf) 0.7442 0.6333 0.5926 1.0000
chi-squared test (85) + SVM (rbf) 0.7778 0.7333 0.7000 0.8750
All features (366) + SVM (rbf), with probability threshold = 0.3 0.6957 0.5333 0.5333 1.0000
chi-squared test (25) + SVM (rbf), with probability threshold = 0.3 0.7111 0.5667 0.5517 1.0000
chi-squared test (85) + SVM (rbf), with noise (I = 0.001) and probability threshold = 0.3 0.7778 0.7333 0.7000 0.8750
Table 3. The first and second methods used microbiota data only. The first method trained the model on the
original training set without feature selection. The second method did feature selection by chi-squared test
and selected 25 features, while the third method used both transcriptome and microbiota data, and integrated
the data using the fourth plan mentioned above, and selected 85 features (35 for transcriptome and 50 for
microbiota). For the last three methods, they are similar with the first three methods respectively. The only
difference was that they changed the threshold and added noises.
(the third and sixth models) are most accurate in predicting AD, achieving an F1 score of 0.78 (Table 3). The
classifiers that use only microbiota data generally have lower accuracy (F1 scores between 0.69 and 0.74) than
ones that use both microbiota and transcriptome data. Compared to the previous transcriptome-only classifiers
that have the best F1 score of 0.76, the microbiota data marginally improve the classifier performance to an F1
score of 0.78. In terms of area under the ROC curve (AUC), the microbiota data does not improve the perfor-
mance compared to the transcriptome-only classifiers as the best AUC is identical (0.75) between the classifier
that combines microbiota and transcriptome data and the transcriptome-only classifier (Fig. 3). Additionally,
we selected 19 transcriptomic features with gene names and 50 microbiota features to train our AD classifier.
We found that it did not perform better than using all 35 selected transcriptome features and 50 microbiota
features, where it achieved an F1 score of 0.7273 initially and 0.7778 after applying jittering and thresholding
(Supplemental Table S9).
Top genes selected in the AD classifier. Our feature selection algorithm using the transcriptome data
identifies 35 features or probes (Fig. 4) that span over 19 unique genes. These genes are selected as they are most
informative in predicting AD, which suggests they may be implicated in AD. Hence, we perform a literature
search for these 19 genes to examine whether they are known to be related to AD and find a few cases. First,
we find that GRP1 (Probe ID: 16907572) is associated with a type of scaffold protein (Grasp) that potentially
influences p53-mediated apoptotic responses in the skin33. It is known that apoptosis is a crucial process in the
development of AD34,35. Second, another gene called CCL22 (Probe ID: 16819478) is known to play an important
role in AD pathogenesis. It encodes chemokine (C–C motif) ligand 22, which is involved in the immunoregula-
tory and inflammatory processes of T cells. Additionally, CCL22 is found to be one of the important biomark-
ers of severity in infantile AD according to a study involving 34 p atients36. This gene has also been reported to
be significantly up-regulated with AD in a high-throughput proteomic assay37 and a transcriptomic analysis38.
Association studies and functional studies further suggest that the mutations in CCL22 affect the susceptibility
to AD in a gain-of-function m anner39. Lastly, according to a genome-wide association study, four SNPs associ-
ated with Alopecia are mapped to our selected gene, TTC27 (Probe ID: 16878890)40. A previous study found that
patients with Alopecia have a higher risk for A D41. Overall, these examples demonstrate the clinical importance
of our selected genes.
Top microorganisms in microbiota selected in the AD classifier. Our feature selection algorithm
using the microbiota data and transcriptome data identifies 50 microbiota features (Fig. 5). These microorgan-
isms are chosen to be top predictors for AD, so they may be involved in AD. To validate our findings, we perform
a literature search for these 50 kinds of bacteria to look for related studies and supporting evidence. Here are
some examples. First, Akkermanisia has the highest feature importance in our AD classifier, indicating that the
amounts of Akkermanisia can affect our prediction the most. A recent study found that the amounts of Akker-
manisia are high in transient AD patients but low in children with persistent AD42. So Akkermanisia can be a
crucial microbiota indicator for AD. Second, a metagenomic analysis of microbe-derived extracellular vesicles
discovered that Verrucomicrobia, the bacteria with the second highest feature importance in our AD classifier,
had significantly different relative abundances between the AD and control groups and could be used as a novel
biomarker for AD diagnosis43. Lastly, Propionibacterium is ranked the sixth most important microorganism
in our AD classifier. It was reported that the relative abundance of Propionibacterium is usually reduced and
the abundance of Staphylococcus aureus is elevated in the skin of AD patients44, leading to dysbiosis. Another
study observed a dysbiotic status characterized by a reduction of Propionibacterium in the gut microbiota of
AD patients45. And dysbiosis is considered to be an essential driving factor of AD46,47. Hence, the selected 50
microbiota features demonstrate the close relationship between gut microbiota and the pathogenesis of A D48.
Scientific Reports | (2022) 12:290 | https://doi.org/10.1038/s41598-021-04373-7 8
Vol:.(1234567890)www.nature.com/scientificreports/
Figure 3. The ROC curve of the test set with microbiota data. (a) All features (366) + SVM (rbf). (b) Chi-
squared test (25) + SVM (rbf). (c) Chi-squared test (85) + SVM (rbf). (d) Chi-squared test (85) + SVM (rbf), with
noise (I = 0.001) and probability threshold = 0.3. For panel (a,b), we only use microbiota data, while for (c,d) we
also include transcriptome data.
Discussion
AD is a paradigmatic chronic inflammatory skin disease characterized by complex pathophysiology and a wide
spectrum of clinical phenotypes. In particular, the phenotype of AD in early childhood may be influenced by
genetic factors and gut microbiota. The purpose of this study was to predict the phenotype of atopic dermatitis
in early childhood with transcriptome and microbiota data. Therefore, to understand this diversity, efforts to
find new AD endotypes by ML technique using these multi-omics are needed. In this study, we integrated and
took the advantage of one of the largest transcriptomic and microbial profiles for AD patients to the best of our
knowledge. We developed an AD classifier solely based on transcriptome and microbiota data, which accurately
distinguished subjects with AD from healthy individuals. The most accurate classifier selected 35 genes and 50
microbial features (4 phyla and 46 genera) interpreted via a support vector machine classifier, which can auto-
matically classify AD with high precision (0.70) and recall (0.88). Also, among the selected genes/probes used
in the AD classifier, we discovered that at least three genes are reported to be directly or indirectly associated
with AD. In summary, our classifier represents the first step toward a precise, automated diagnosis of AD and
provides important biological insights into the development of the biomarkers of this disease.
Recently, our colleagues have developed an estimated prediction model by multi-omics analyses and real-
ized the importance of transcriptome d ata49; therefore, this study performed the extended analyses with a larger
sample size and a different machine learning model for a more precise prediction. Our AD classifier is the first
machine learning classifier for this disease based on the transcriptomic and microbial profiles of patients. To
diagnose AD, clinicians typically rely on the clinical features of A D50. However, the lack of robust objective
measures might have negative effects on the assessment of A D17–19,51,52. To overcome these challenges, previ-
ous studies developed machine learning classifiers for AD diagnosis or severity evaluation based on electronic
Scientific Reports | (2022) 12:290 | https://doi.org/10.1038/s41598-021-04373-7 9
Vol.:(0123456789)www.nature.com/scientificreports/
Figure 4. The average feature importance of the top 35 selected probes/genes. See more detailed annotation
information in Supplementary Table S5.
health records (EHR)53, camera photos54, or multiphoton t omography55. While these approaches may provide
an unbiased diagnosis of AD, they are either not highly accurate, achieving F1 scores of 0.67 using EHR53 and F1
scores of 0.69 using camera p hotos54, or it may be more inconvenient or expensive to obtain these kinds of data
for the ML classifier. With the development of high-throughput microarray and sequencing technologies, it may
be and is likely to be cheaper in near future to obtain transcriptome and microbiota data. Another advantage of
our ML classifier is that it does not require patients to be present in the testing sites or hospitals as they can send
their samples to the labs to generate transcriptome and microbiota data and our classifier can predict the risk of
AD based on the data. Thus, our classifier enables the convenient, efficient, and cost-effective diagnosis of AD
as well as improving the accessibility of medical resources for patients.
In further enrichment analysis using Enrichr (https://maayanlab.cloud/Enrichr/)56 based on the featured
genes, interleukin-7 (IL-7) interactions in the immune response pathway (P = 0.032, Supplementary Table S10)
was enriched. IL-7 is a critical cytokine for the development of the group 2 innate lymphoid cells (ILC2s),
which are involved in allergic diseases including A D57. In addition, several inflammation-related processes (for
instance, lymphocyte, chemokine, neutrophil, P < 0.05) were enriched in gene ontology observation. Inflamma-
tory responses associated with lymphocyte, chemokine, and neutrophil are important in AD mediated by CD4+
T cells58. These results suggest that featured genes in this study might be potentially valuable for AD diagnosis.
There are a few study limitations. First, the sample size of our dataset is relatively small. As we only used 161
samples recruited from the birth cohort follow-up group and outpatients group, it could cause overfitting and
biases when training the ML classifier. To address this issue, we applied nested cross-validation to perform fea-
ture selection and model training. We also introduced jittering to add a small amount of artificial noise into the
data to reduce overfitting. We showed that we successfully controlled the biases and overfitting as our classifier
performed well on the independent test set. Our study also had the limited ability to assess the benefits of adding
microbiota data to the ML classifier as we observed the marginal improvement in prediction accuracy, possibly
due to the small sample size of the test set when we combined transcriptome and microbiota data. Second, since
our subjects from the birth cohort follow-up group are general population and usually considered to have mild
severity of AD, there is a possibility that the results may differ from those in the severe patient group. Therefore,
to validate and improve the ML classifier and to more accurately assess its performance, further studies in a larger
sample size and in an independent cohort are required. Third, age should be considered as a confounding factor
to affect the gene expression and gut microbiota in infants through developmental stages. Fourth, it is known that
Scientific Reports | (2022) 12:290 | https://doi.org/10.1038/s41598-021-04373-7 10
Vol:.(1234567890)www.nature.com/scientificreports/
Figure 5. The average feature importance of the top 50 selected microorganisms from the microbiota dataset.
the gut microbiota in infancy is largely unstable, but gradually stabilize as it grows during c hildhood59. However,
this study analyzed the gut microbiota in infants at ages from 6 to 72 months, without serial microbiome data
of the subjects, for the prediction of AD. Therefore, further studies, including a replication study in serial paired
subjects, are needed to resolve the differences or changes of the prediction during aging. The strengths of our
study could be an application of non-invasive gut epithelial cells from fecal specimens and a possibility to apply
to early prediction for AD patients with mild severity and the general population. In addition, to address the issue
of no validation, we created an independent test set from the original dataset and demonstrated the accuracy of
our classifier, which could serve as the independent cohort.
In this study, we developed an accurate and automated machine learning pipeline for atopic dermatitis
classification. This pipeline can not only be used to predict this skin disease but also be generalized to classify
other diseases based on transcriptome and microbiota data. It could assist clinicians in diagnosing and assessing
diseases and providing timely treatment to patients. It could also provide new endotypes by performing further
research. In addition, we demonstrated the utility of combining genomics and cutting-edge artificial intelligence
(AI) technologies like machine learning to detect diseases or identify biomarkers. We expect that the increasing
availability of genomics and AI technologies would improve the effectiveness and efficiency of medical diagnosis.
Data availability
The data supporting the findings of this study are included within the article.
Received: 7 October 2021; Accepted: 14 December 2021
References
1. Maliyar, K., Sibbald, C., Pope, E. & GarySibbald, R. Diagnosis and management of atopic dermatitis: A review. Adv. Skin Wound
Care 31, 538–550 (2018).
2. McKenzie, C. & Silverberg, J. I. The prevalence and persistence of atopic dermatitis in urban United States children. Ann. Allergy
Asthma Immunol. 20, 20 (2019).
3. Chiesa Fuxench, Z. C. et al. Atopic Dermatitis in America Study: A cross-sectional study examining the prevalence and disease
burden of atopic dermatitis in the US adult population. J. Invest. Dermatol. 139, 583–590 (2019).
4. Ravnborg, N. et al. Prevalence of asthma in patients with atopic dermatitis: A systematic review and meta-analysis. J. Am. Acad.
Dermatol. 84, 471–478 (2021).
5. Pedersen, C. J., Uddin, M. J., Saha, S. K. & Darmstadt, G. L. Prevalence of atopic dermatitis, asthma and rhinitis from infancy
through adulthood in rural Bangladesh: A population-based, cross-sectional survey. BMJ Open 10, e042380 (2020).
Scientific Reports | (2022) 12:290 | https://doi.org/10.1038/s41598-021-04373-7 11
Vol.:(0123456789)www.nature.com/scientificreports/
6. Silverberg, J. I. et al. Symptoms and diagnosis of anxiety and depression in atopic dermatitis in US adults. Br. J. Dermatol. 181,
554–565 (2019).
7. Silverberg, J. I. Public health burden and epidemiology of atopic dermatitis. Dermatol. Clin. 35, 283–289 (2017).
8. Reed, B. & Blaiss, M. S. The burden of atopic dermatitis. Allergy Asthma Proc. 39, 406–410 (2018).
9. Silverberg, J. I. et al. Patient burden and quality of life in atopic dermatitis in US adults: A population-based cross-sectional study.
Ann. Allergy Asthma Immunol. 121, 340–347 (2018).
10. DavidBoothe, W., Tarbox, J. A. & Tarbox, M. B. Atopic dermatitis: Pathophysiology. In Management of Atopic Dermatitis: Methods
and Challenges (eds Fortson, E. A. et al.) 21–37 (Springer, 2017).
11. Yang, E. J., Sekhon, S., Sanchez, I. M., Beck, K. M. & Bhutani, T. Recent developments in atopic dermatitis. Pediatrics 142, 25 (2018).
12. Litvak, Y., Byndloss, M. X. & Bäumler, A. J. Colonocyte metabolism shapes the gut microbiota. Science 362, 25 (2018).
13. Ghosh, D., Bernstein, J. A., Khurana Hershey, G. K., Rothenberg, M. E. & Mersha, T. B. Leveraging multilayered ‘omics’ data for
atopic dermatitis: A road map to precision medicine. Front. Immunol. 9, 2727 (2018).
14. Sacco, K. A. & Milner, J. D. Gene–environment interactions in primary atopic disorders. Curr. Opin. Immunol. 60, 148–155 (2019).
15. Lloyd-Price, J. et al. Multi-omics of the gut microbial ecosystem in inflammatory bowel diseases. Nature 569, 655–662 (2019).
16. Kang, M. J. et al. Interactions between IL-17 variants and Streptococcus in the gut contribute to the development of atopic der-
matitis in infancy. Allergy Asthma Immunol. Res. 13, 404–419 (2021).
17. Vakharia, P. P., Chopra, R. & Silverberg, J. I. Systematic review of diagnostic criteria used in atopic dermatitis randomized controlled
trials. Am. J. Clin. Dermatol. 19, 15–22 (2018).
18. Akan, A., Dibek-Mısırlıoğlu, E., Civelek, E., Vezir, E. & Kocabaş, C. N. Diagnosis of atopic dermatitis in children: Comparison of
the Hanifin-Rajka and the United Kingdom Working Party criteria. Allergol. Immunopathol. 48, 175–181 (2020).
19. Renert-Yuval, Y. et al. Biomarkers in atopic dermatitis—a review on behalf of the International Eczema Council. J. Allergy Clin.
Immunol.ogy 147, 1174-1190.e1 (2021).
20. Hanifin, J. M. Diagnostic features of atopic dermatitis. Acta Derm. Venereol. 92, 44–47 (1980).
21. Kunz, B. et al. Clinical validation and guidelines for the SCORAD index: Consensus report of the European Task Force on Atopic
Dermatitis. Dermatology 195, 10–19 (1997).
22. Lee, M.-J. et al. Perturbations of gut microbiome genes in infants with atopic dermatitis according to feeding type. J. Allergy Clin.
Immunol. 141, 1310–1319 (2018).
23. Park, J.-U. et al. Influence of microbiota on diabetic foot wound in comparison with adjacent normal skin based on the clinical
features. Biomed Res. Int. 2019, 7459236 (2019).
24. Libbrecht, M. W. & Noble, W. S. Machine learning applications in genetics and genomics. Nat. Rev. Genet. 16, 321–332 (2015).
25. Pedregosa, F. et al. Scikit-learn: Machine learning in python. J. Mach. Learn. Res. 12, 2825–2830 (2011).
26. Miao, J. & Niu, L. A survey on feature selection. Proced. Comput. Sci. 91, 919–926 (2016).
27. Pandey, G. et al. A nasal brush-based classifier of asthma identified by machine learning analysis of nasal RNA sequence data. Sci.
Rep. 8, 8826 (2018).
28. Jia, Z. Controlling the overfitting of heritability in genomic selection through cross validation. Sci. Rep. 7, 13678 (2017).
29. Santos, M. S., Soares, J. P., Abreu, P. H., Araujo, H. & Santos, J. Cross-validation for imbalanced datasets: Avoiding overoptimistic
and overfitting approaches [Research Frontier]. IEEE Comput. Intell. Mag. 13, 59–76 (2018).
30. Breiman, L. Random forests. Mach. Learn. 45, 5–32 (2001).
31. Chen, T. & Guestrin, C. XGBoost: A scalable tree boosting system. in Proceedings of the 22nd ACM SIGKDD International Confer-
ence on Knowledge Discovery and Data Mining 785–794 (Association for Computing Machinery, 2016).
32. Loughrey, J. & Cunningham, P. Overfitting in wrapper-based feature subset selection: The harder you try the worse it gets. in
Research and Development in Intelligent Systems XXI 33–43 (Springer London, 2005).
33. Venkataraman, A. et al. Grp1-associated scaffold protein regulates skin homeostasis after ultraviolet irradiation. Photochem.
Photobiol. Sci. 13, 531–540 (2014).
34. Trautmann, A., Akdis, M., Blaser, K. & Akdis, C. A. Role of dysregulated apoptosis in atopic dermatitis. Apoptosis 5, 425–429
(2000).
35. Rebane, A. et al. Mechanisms of IFN-γ-induced apoptosis of human skin keratinocytes in patients with atopic dermatitis. J. Allergy
Clin. Immunol. 129, 1297–1306 (2012).
36. Nakazato, J. et al. Serum levels of Th2 chemokines, CCL17, CCL22, and CCL27, were the important markers of severity in infantile
atopic dermatitis. Pediatr. Allergy Immunol. 19, 605–613 (2008).
37. Brunner, P. M. et al. The atopic dermatitis blood signature is characterized by increases in inflammatory and cardiovascular risk
proteins. Sci. Rep. 7, 8707 (2017).
38. Brunner, P. M. et al. Distinct transcriptomic profiles of early-onset atopic dermatitis in blood and skin of pediatric patients. Ann.
Allergy Asthma Immunol. 122, 318-330.e3 (2019).
39. Hirota, T. et al. Variants of C-C motif chemokine 22 (CCL22) are associated with susceptibility to atopic dermatitis: Case–control
studies. PLoS ONE 6, e26987 (2011).
40. Hagenaars, S. P. et al. Genetic prediction of male pattern baldness. PLoS Genet. 13, e1006594 (2017).
41. Mohan, G. C. & Silverberg, J. I. Association of vitiligo and alopecia areata with atopic dermatitis. JAMA Dermatol. 151, 522 (2015).
42. Park, Y. M. et al. Imbalance of gut streptococcus, clostridium, and Akkermansia determines the natural course of atopic dermatitis
in infant. Allergy Asthma Immunol. Res. 12, 322–337 (2020).
43. Yang, J. et al. Diagnostic models for atopic dermatitis based on serum microbial extracellular vesicle metagenomic analysis: A pilot
study. Allergy Asthma Immunol. Res. 12, 792–805 (2020).
44. Bjerre, R. D., Bandier, J., Skov, L., Engstrand, L. & Johansen, J. D. The role of the skin microbiome in atopic dermatitis: A systematic
review. Br. J. Dermatol. 177, 1272–1278 (2017).
45. Reddel, S. et al. Gut microbiota profile in children affected by atopic dermatitis and evaluation of intestinal persistence of a probiotic
mixture. Sci. Rep. 9, 4996 (2019).
46. Kobayashi, T. et al. Dysbiosis and Staphylococcus aureus colonization drives inflammation in atopic dermatitis. Immunity 42,
756–766 (2015).
47. Dainichi, T. et al. The epithelial immune microenvironment (EIME) in atopic dermatitis and psoriasis. Nat. Immunol. 19, 1286–
1298 (2018).
48. Edslev, S. M., Agner, T. & Andersen, P. S. Skin microbiome in atopic dermatitis. Acta Derm. Venereol. 100, adv00164 (2020).
49. Park, J. et al. Multi-omics analyses implicate EARS2 in the pathogenesis of atopic dermatitis. Allergy https://doi.org/10.1111/all.
14837 (2021).
50. Eichenfield, L. F. et al. Guidelines of care for the management of atopic dermatitis: Section 1 Diagnosis and assessment of atopic
dermatitis. J. Am. Acad. Dermatol. 70, 338–351 (2014).
51. Yew, Y. W., Thyssen, J. P. & Silverberg, J. I. A systematic review and meta-analysis of the regional and age-related differences in
atopic dermatitis clinical characteristics. J. Am. Acad. Dermatol. 80, 390–401 (2019).
52. Chopra, R., Vakharia, P. P., Simpson, E. L., Paller, A. S. & Silverberg, J. I. Severity assessments used for inclusion criteria and baseline
severity evaluation in atopic dermatitis clinical trials: A systematic review. J. Eur. Acad. Dermatol. Venereol. 31, 1890–1899 (2017).
Scientific Reports | (2022) 12:290 | https://doi.org/10.1038/s41598-021-04373-7 12
Vol:.(1234567890)www.nature.com/scientificreports/
53. Gustafson, E., Pacheco, J., Wehbe, F., Silverberg, J. & Thompson, W. A Machine Learning Algorithm for Identifying Atopic Der-
matitis in Adults from Electronic Health Records. in 2017 IEEE International Conference on Healthcare Informatics (ICHI) 83–90
(2017).
54. Pan, K., Hurault, G., Arulkumaran, K., Williams, H. C. & Tanaka, R. J. EczemaNet: Automating detection and severity assessment
of atopic dermatitis. In Machine Learning in Medical Imaging (ed. Sad, D.) 220–230 (Springer, 2020).
55. Guimarães, P., Batista, A., Zieger, M., Kaatz, M. & Koenig, K. Artificial intelligence in multiphoton tomography: Atopic dermatitis
diagnosis. Sci. Rep. 10, 7968 (2020).
56. Kuleshov, M. V. et al. Enrichr: A comprehensive gene set enrichment analysis web server 2016 update. Nucleic Acids Res. 44,
W90–W97 (2016).
57. Kabata, H., Moro, K. & Koyasu, S. The group 2 innate lymphoid cell (ILC2) regulatory network and its underlying mechanisms.
Immunol. Rev. 286, 37–52 (2018).
58. Bień, K. et al. Involvement of Fas/FasL pathway in the murine model of atopic dermatitis. Inflamm. Res. 66, 679–690 (2017).
59. Stewart, C. J. et al. Temporal development of the gut microbiome in early childhood from the TEDDY study. Nature 562, 583–588
(2018).
Acknowledgements
This work was supported by the National Institute of Environmental Health Sciences (NIEHS) [K01 ES028064];
the National Science Foundation Grant [#1705197]; the National Institute of Neurological Disorders and
Stroke (NINDS) [R01 NS102371]; and NINDS [R03 HL150604]; and the Bio & Medical Technology Devel-
opment Program of the National Research Foundation (NRF) funded by the Korean Government (MSIT)
(2017M3A9F3043834). These sponsors had no involvement in this study.
Author contributions
J.H.S. and J.L. conceived the study and designed the experiments, Z.J. and J.L. designed the machine learning
pipeline and classifiers, Z.J. implemented the pipeline and classifiers, Z.J. conducted the experiments and analyzed
the results, N.K. analyzed the top genes selected in the AD classifier, Z.J., J.L., N.K., J.H.K, S.J.H., and J.H.S. wrote
the manuscript. J.H.K. performed transcriptome analysis. Y.M.P. and B.S.K. performed microbiota analysis. S.Y.L.
and S.J.H. contributed subjects and clinical data. All authors reviewed the manuscript.
Competing interests
The authors declare no competing interests.
Additional information
Supplementary Information The online version contains supplementary material available at https://doi.org/
10.1038/s41598-021-04373-7.
Correspondence and requests for materials should be addressed to S.-J.H. or J.S.
Reprints and permissions information is available at www.nature.com/reprints.
Publisher’s note Springer Nature remains neutral with regard to jurisdictional claims in published maps and
institutional affiliations.
Open Access This article is licensed under a Creative Commons Attribution 4.0 International
License, which permits use, sharing, adaptation, distribution and reproduction in any medium or
format, as long as you give appropriate credit to the original author(s) and the source, provide a link to the
Creative Commons licence, and indicate if changes were made. The images or other third party material in this
article are included in the article’s Creative Commons licence, unless indicated otherwise in a credit line to the
material. If material is not included in the article’s Creative Commons licence and your intended use is not
permitted by statutory regulation or exceeds the permitted use, you will need to obtain permission directly from
the copyright holder. To view a copy of this licence, visit http://creativecommons.org/licenses/by/4.0/.
© The Author(s) 2022
Scientific Reports | (2022) 12:290 | https://doi.org/10.1038/s41598-021-04373-7 13
Vol.:(0123456789)You can also read


