Digital Transformation and a Net Zero Emissions Europe - The role of cloud computing and data centres in achieving power sector emissions ...
←
→
Page content transcription
If your browser does not render page correctly, please read the page content below
Digital Transformation and a Net Zero Emissions Europe
The role of cloud computing and data centres in achieving power sector emissions
reductions in Europe

An Aurora Energy Research white paper, sponsored by VMware

March 2021
Contents
 Contents ............................................................................................................................................................ 2
 Foreword by VMware ................................................................................................................................... 3
 1. Executive Summary .................................................................................................................................. 4
 2. Introduction ................................................................................................................................................ 5
 3. Embracing virtualisation leads to carbon emissions reductions in the IT sector .............. 7
 3.1 The growth of computing demand and emergence of the cloud ...........................................7
 3.2 The energy and emissions impact of computing demand ........................................................8
 3.3 The potential for further carbon emissions savings in computing demand..................... 11
 4. Data centre best practices for supporting the integration of renewables into power
 grids across Europe.................................................................................................................................... 14
 4.1 Challenges facing a high-renewables Europe ............................................................................ 15
 4.2 Data centres’ potential in supporting the integration of renewables on the grid .......... 16
 5. Methodology ........................................................................................................................................... 18
 6. Further information ............................................................................................................................... 23

Digital Transformation and a Net Zero Emissions Europe / Aurora Energy Research Ltd P a g e |2
Foreword by VMware
 In 2020, life seemed to change overnight. With the world in the grips of the Covid-19
 pandemic, everyday tasks—going to work, connecting with family, attending school—were
 suddenly ushered into a new era. For many organisations, the pandemic has proven to be a
 watershed moment for the way they do business, accelerating ongoing digital transformations
 to ensure continuity of their work—and driving greater dependence on the data centre as a
 result. This “new normal” has led to tremendous decreases in carbon emissions from
 commuting. But this increasing reliance on digital technologies such as mobile, edge and
 private/public cloud computing has further accelerated the enormous energy consumption by
 data centres, and therefore, the urgency to act to decarbonise.

 Despite the pandemic, business leaders and policy makers have not lost sight of aggressive
 sustainability and carbon emissions goals to help mitigate climate change. These twin
 missions—accelerating digital transformation and reducing carbon emissions—can go hand-in-
 hand. Technologies like data centre virtualisation and an embrace of a hybrid cloud model can
 help organisations track, manage, and reduce their carbon emissions as their digital
 transformation proceeds.

 At VMware, our goal is to empower our customers with the resources and tools they need to
 ultimately reduce environmental impact across our vast partner ecosystem.

 Sustainability has long been a core value for VMware, which powers the world’s complex
 digital infrastructure. The company has set standards for itself internally, having achieved
 100% renewable energy and carbon neutrality goals ahead of schedule. Beyond these
 ambitious goals for its own business practices, VMware also aims to incorporate sustainability
 features into its products, to offer solutions that help customers positively impact the
 environment and society, as well as provide customers and partners with data that enable
 informed choices around cleaner technology. Since 2003, our product portfolio has helped
 our customers avoid over 1.2 billion tonnes of CO2.

 The total emissions avoided through VMware virtualisation in 2019 are equivalent to
 removing nearly 33 million cars from the road and the avoidance of over 378 billion miles
 driven using averages for U.S. vehicles. With the total power consumption avoided in 2019
 by using VMware’s virtualisation, a 2019 Tesla Model S Long Range electric car could be
 driven back and forth to Mars more than 4,000 times. With the cumulative power
 consumption avoided since 2003, this electric car could be driven back and forth to Mars more
 than 28,000 times1.

 This report demonstrates how VMware’s transformative software can enable partners to
 reduce their carbon emissions and intends to make recommendations to policy makers on
 how they can incentivise sustainable digital transformations as they work towards climate
 change and green policy goals.

 1
 VMware Global Impact Report 2020
 https://www.vmware.com/content/dam/digitalmarketing/vmware/en/pdf/microsites/vmware-
 global-impact-report.pdf

Digital Transformation and a Net Zero Emissions Europe / Aurora Energy Research Ltd P a g e |3
VMware is committed to investing in the health of our environment and our communities,
 which are critical for the long-term sustainability of our business, and we hope that this report
 will serve as a valuable resource to our partners who are committed to doing the same.

 1. Executive Summary
 Virtualisation software allows for substantially more computation to be done with significantly
 less IT hardware. Its use, along with improved management and optimisation of operations
 and hardware upgrades, enables productivity and energy efficiency improvements in IT
 operations. Coupled with the increased usage of renewable energy to fulfil electricity
 requirements, these energy efficiency gains can help IT operations in Europe to substantially
 decrease their carbon footprint. This is especially important as more and more enterprises are
 engaging with digitised information to transform their business operations, leading to
 continued exponential growth in computing demand.

 This report examines future scenarios of European computing demand and its impact on
 European electricity consumption and emissions. A ‘Zero Progress’ scenario has been
 developed to understand what computing emissions level would result in a world where
 current technological progress surrounding virtualisation software and its penetration remains
 stagnant through to the year 2040. This is then compared to a ’Continual Improvement’
 scenario that applies reasonable trends to these factors to assess the potential impact of
 virtualisation in abating future emissions from European computing demand.

 Our analysis suggests European computing emissions would grow 250% over the next 20
 years in a Zero Progress scenario. But continued improvements in virtualisation technology
 and its penetration, underlying the Continual Improvement scenario, can enable a cumulative
 energy efficiency-sourced CO2 reduction of 454 million tonnes by 2040, a 55% reduction
 compared to the baseline. While a Zero Progress scenario is improbable, this scenario
 highlights the importance of continued innovation in computing and its impact on carbon
 emissions. Consequently, policy initiatives that stifle a continuation of the pace of innovation
 seen historically in the sector can have a direct impact on emissions.

 Further, this report assesses two possible levers to further mitigate the carbon footprint of
 European computing demand: 1) increasing the virtualisation rate of public cloud data centres
 and on-premises IT operations and 2) increasing the number of renewable-energy powered
 data centres and shifting computing demand to locations of lower power grid carbon intensity.

 Lastly, this report provides an overview of how data centres can play a role in helping integrate
 renewable grids across Europe. The intermittency of renewable energy sources like wind or
 solar present some challenges to increasing their penetration on power grids. Addressing
 these challenges requires sources of flexibility to help balance the grid. Data centres can help
 integrate renewables into the grid by:
 • Utilising their backup/emergency battery storage to help balance supply and demand
 on the grid;
 • Optimising the cooling of IT infrastructure to provide flexibility to the grid; and

Digital Transformation and a Net Zero Emissions Europe / Aurora Energy Research Ltd P a g e |4
• Engaging in demand response by reducing data centre power consumption to better
 match the current local supply of renewables.
 While this report quantifies the possible impact of technical developments in both the
 computing and electricity sectors in Europe, a standardised and coherent policy on data centre
 operations and computing procurement policies would enable the industry to identify and
 implement critical initiatives to support the decarbonisation of the sector.

 The new European Commission (EC), the EU’s Executive Branch which took office in
 November 2019, indicated two of its main priorities are to lead on the digital and green
 transformation of the European Union. 2 Included in this effort is the EC’s intention to
 implement a "Green Public Procurement policy"—a voluntary instrument intended to nudge
 purchasing power towards environmentally friendly goods, services and works.3 Additionally,
 the EC identified the need to reduce the digital sector’s carbon emissions. In particular, data
 centres will need to become more energy efficient, reuse waste energy and use more
 renewable energy sources with the aim of becoming climate neutral by 2030.4

 2. Introduction
 Many countries have recently legislated net zero carbon emissions targets by 2050 or before.5
 In fact, in the European Union, only a handful of countries were reluctant to pass net zero
 laws. The European Commission has recently proposed legislation for the 27 member states
 to become climate-neutral by 2050 as part of the European Green Deal.6

 A key component of achieving climate neutrality involves greening the electricity system.
 Today, the 27 European Union Member States (and the United Kingdom), account for almost
 10% of global energy-related CO2 emissions.7 Considering the magnitude of EU emissions, it
 is imperative that the EU works diligently to reduce its electricity emissions intensity. This
 challenge will become increasingly important as more and more aspects of the economy and
 life are electrified and digitised.

 As many enterprises are undergoing their digital transformation to upgrade their business
 operations, including through the adoption of computing-intensive revolutionary technologies
 such as blockchain, virtual reality, edge computing, machine learning and artificial intelligence,
 their requisite computing demand is expected to grow exponentially over the next couple of
 decades. Without further investment in technology and climate stewardship, this increase in

 2
 European Commission, “6 Commission priorities for 2019-24”, Accessed 26 June 2020. URL:
 https://ec.europa.eu/info/strategy/priorities-2019-2024_en
 3
 European Commission, “Green Public Procurement”, 11 June 2020. URL:
 https://ec.europa.eu/environment/gpp/index_en.htm
 4
 European Commission, “Shaping EU’s Digital Future”, 19 February 2020. URL:
 https://ec.europa.eu/info/sites/info/files/communication-shaping-europes-digital-future-feb2020_en_4.pdf
 5
 Megan Darby, Climate Home News, “Which countries have a net zero carbon goal?”, 14 June 2019.
 URL: https://www.climatechangenews.com/2019/06/14/countries-net-zero-climate-goal/
 6
 Mehreen Khan, Financial Times, “EU begins arduous path to net zero climate emissions”, 3 May
 2020. URL: https://www.ft.com/content/ff7094e0-5dcb-11ea-b0ab-339c2307bcd4
 7
 IEA, “Net-zero carbon or GHG emissions reduction announcements”, 10 March 2020. URL:
 https://www.iea.org/data-and-statistics/charts/net-zero-carbon-or-ghg-emissions-reduction-announcements (10 Mar 2020)

Digital Transformation and a Net Zero Emissions Europe / Aurora Energy Research Ltd P a g e |5
computing demand would result in a similarly significant rise in electricity consumption and
 emissions. However, this need not be the case. Providers of computing services have an
 opportunity to assist in building a net zero emissions Europe with the goal to support the EU’s
 productive computing while decarbonising that activity through energy and infrastructure
 efficiencies and renewable energy.

 Virtualisation software allows for much more computation to be done with significantly less
 IT hardware. Combined with improved management and optimisation of operations and
 hardware upgrades, its use enables substantial productivity and energy efficiency
 improvements in IT operations. Coupled with the increased usage of renewable energy to
 fulfil electricity requirements, these energy efficiency gains can help IT operations in Europe
 to substantially decrease their carbon footprint. In addition, the computation of digitised
 information is being increasingly moved to the cloud where, among other things:
 1) energy efficiency is generally higher than for on-premises operations;
 2) the physical location of computing infrastructure can be optimised to cooler and/or
 less carbon-intensive electricity regions; and
 3) electricity demand flexibility can be provided to help integrate higher percentages
 of renewables into power grids across Europe.

 Underpinning the capabilities of many cloud-based services is a technological process called
 virtualisation. Virtualisation is the utilisation of software to simulate hardware functionality
 and create multiple virtual computer systems, or virtual machines, on a single physical server.
 This technology, in aggregate, allows for much more computation to be done with significantly
 less IT hardware and commensurately less data centre infrastructure, and consequently, less
 energy. Among the dozen major players in the virtualisation product market, VMware holds
 the highest market share, followed by IBM and Huawei.8

 A previous VMware-sponsored white paper by IDC estimated that VMware’s virtualisation
 products have led to the avoidance of over 142 million physical servers, 2,500 TWh of
 electricity usage, and the emission of 1.2 billion tonnes of CO2 worldwide from 2003–2019.9
 While it has been previously argued that virtualisation has led to significant CO2 reduction in
 the past several years, this paper will explore a probable future trajectory of emissions from
 European computing demand and how virtualisation, cloud computing and data centres can
 further reduce emissions.

 8
 Gary Chen, IDC, “Worldwide Virtual Machine Software Market Shares, 2017: Virtualization Still
 Showing Positive Growth”, December 2018. URL:
 https://www.vmware.com/content/dam/digitalmarketing/vmware/en/pdf/products/vmware-idc-virtual-machine-market-
 shares-2017.pdf
 9
 Sriram Subramanian, Brad Casemore, IDC, “Enabling More Agile and Sustainable Business Through
 Carbon-Efficient Digital Transformations”, August 2020. URL:
 https://www.vmware.com/content/dam/digitalmarketing/vmware/en/pdf/company/vmware-idc-whitepaper-2020.pdf

Digital Transformation and a Net Zero Emissions Europe / Aurora Energy Research Ltd P a g e |6
3. Embracing virtualisation leads to carbon
emissions reductions in the IT sector
3.1 The growth of computing demand and emergence of the
cloud
Computing demand, including data processing, storage and networking, has grown
tremendously over the past couple of decades. This growth has been driven predominantly
by the digital transformation of businesses and processes, as well as the emergence of online
entertainment, the Internet-of-Things, fog/edge computing, blockchain, AI/ML, virtual reality
and the rising demand for anytime, anywhere access to information.
The form of this computing demand has also changed drastically. At first, European computing
demand was met by servers and storage arrays distributed about an individual company’s
premises. Enterprises then began realising efficiency gains and cost reductions by
consolidating their IT infrastructure into data centres. The advent of cloud computing enabled
further consolidation of computing resources, even enabling enterprises to shed some of their
traditional capital expenditures in maintaining on-premises IT systems and software purchases.
By 2010, the digital transformation was well underway with Amazon Web Services and Elastic
Cloud providing early, virtualised, shared public ("multi-tenant") cloud services (2002, 2006),
followed by Google App Engine (2008), and Microsoft Azure (2010), among others. This
revolution in the digital age has enabled many innovative software-as-a-service (SaaS)
businesses to be created like Spotify, Netflix, Microsoft 365, Salesforce, Zoom and Uber.
Currently, 75% of European computing demand is handled in cloud data centres. 10 These
cloud data centres include private (dedicated, virtualised hosts either in private enterprise or
public cloud environments), public, both hyperscaler and non-hyperscaler (multi-tenant,
virtualised hosts in public cloud environments), and hybrid (primarily using private cloud
infrastructure, and relying on public cloud to handle additional demand during peak periods).
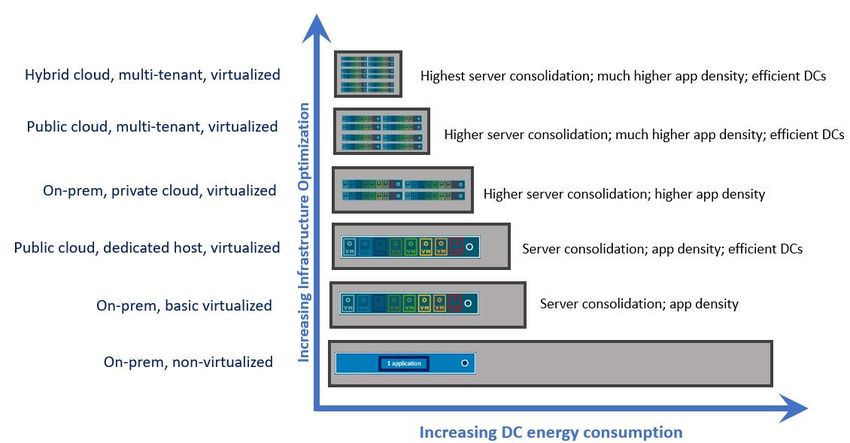
The progression of increasing energy and infrastructure efficiency is shown in Figure 1.
Digital Transformation and a Net Zero Emissions Europe / Aurora Energy Research Ltd P a g e |7Figure 1: Illustrative progression of energy and data centre infrastructure efficiency across data centre environments VMware has been at the centre of this transition, leading the way in helping its customers transform their IT infrastructure to capitalise on the flexibility, scalability and performance of private and hybrid clouds. Its technologies help to bring together previously isolated infrastructure silos to manage them as a single entity and bring cloud-like capabilities back to an on-premises environment. By combining these once disparate elements into a holistic, software-defined and integrated platform, customers realise a wide range of benefits, including reduced complexity, cost control, agility and notably, the ability to monitor and manage carbon emissions. 3.2 The energy and emissions impact of computing demand The impact of virtualisation on computing emissions To construct a forecast for European computing emissions, it is necessary to quantify the likely evolution of key computing demand and emissions drivers. Given the inherent uncertainty of how this fast-moving sector will evolve, it makes sense to explore multiple scenarios. Our approach to constructing these projections, including assumptions and supporting data, is outlined in the methodology section, but the section below outlines our key findings. Our analysis shows that the extent to which virtualisation technologies advance and penetrate the market is one of the key determinants of the expected carbon footprint of European computing. Consider the ‘Zero Progress’ scenario and ‘Continual Improvement’ scenario presented in Figure 2. Digital Transformation and a Net Zero Emissions Europe / Aurora Energy Research Ltd P a g e |8
Figure 2: Projected emissions from European computing demand (2020–2040)

 Our analysis shows that with the expected exponential growth of computing demand
 (measured in terms of computing workloads), and no further increase in the current
 virtualisation rate11 and VM density12, European computing emissions could grow 250% over
 the next 20 years. This is shown as the Zero Progress scenario.

 However, virtualisation rates and VM densities have been increasing steadily over the past
 decade, and that trend is expected to continue. Assuming the same Zero Progress scenario
 computing demand projection but with a 0.5% and 5.7% CAGR in virtualisation rates for public
 cloud and on-premise data centres, respectively, and 7.6% CAGR in VM densities (consistent
 with historic trends), European computing emissions could decrease moderately, 19%, by
 2040 in the Continual Improvement scenario.13 This is because increasing VM density and
 virtualisation rates lead to a higher number of workloads per physical server, which in turn
 leads to much lower power consumption and associated emissions per unit of physical IT
 infrastructure.

 It is important to note that while the Continual Improvement scenario is based on expected
 growth rates in virtualisation and VM densities based on the technical and economic potential
 of these technologies, market forces and public policy will dictate their deployment and
 widespread adoption. In addition to this, future emissions are also sensitive to other factors,
 such as computing demand and expected hardware efficiency gains. These sensitivities
 provide an upper and lower bound for the Continual Improvement scenario, as shown in
 Figure 2.

 11
 Virtualisation Rate refers to the percentage of physical servers that are virtualised across Europe.
 12
 Virtual Machine Density gives the average number of virtual machines in a virtualised server (host).
 Typically, each application runs in its own VM. So, the higher the density the more applications are
 running on host.
 13
 Our assumptions and approach are detailed in the Methodology Section.

Digital Transformation and a Net Zero Emissions Europe / Aurora Energy Research Ltd P a g e |9
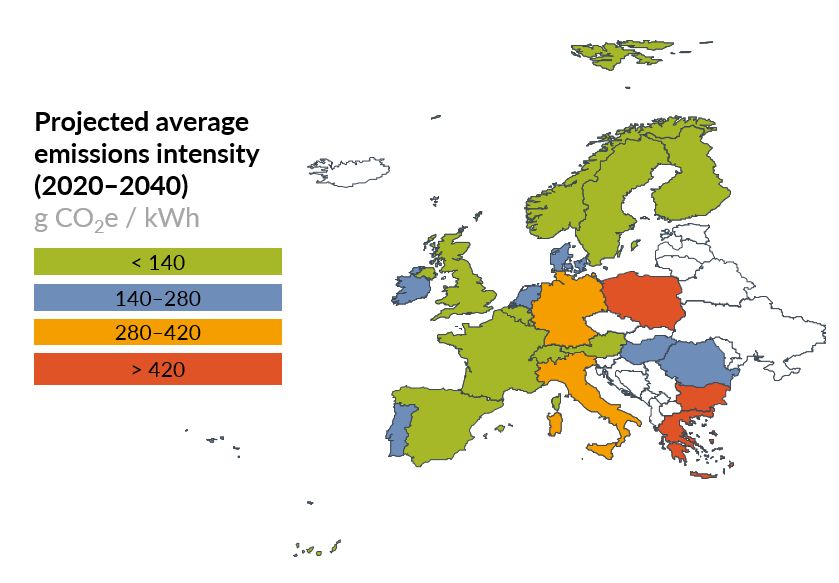
By 2040, based on the growth trajectories in virtualisation rates and VM density assumed in
 the Continual Improvement scenario, European computing emissions could represent
 between 2% and 5% of total European power sector emissions.14 This compares to 12% of
 total European power sector emissions in the Zero Progress scenario and amounts to 54
 million fewer tonnes of CO2 being emitted annually by 2040.

 Carbon intensity of European power grids
 Computing demand and its associated electricity consumption is geographically dispersed
 throughout Europe, where power grids have varying levels of carbon intensity (shown in
 Figure 3).

 Figure 3: Projected Average Emissions Intensity (2020–2040) in g CO2 / kWh (excluding Turkey,
 Monaco, Malta, and Gibraltar).

 As the share of renewables in the power system grows and coal generation is phased out, the
 CO2 emissions intensity of power grids across Europe is expected to fall. This trend is
 highlighted by an expected 43% reduction in emissions intensity in the UK over the next two
 decades, as well as a 64% reduction in Ireland, 56% reduction in Germany, and 60% reduction
 in Spain.15

 The effect of declining power sector emissions is important; even as total European electricity
 consumption increases, net CO2 emissions are expected to fall over time. In both the Zero
 Progress and the Continual Improvement scenarios, we assumed the total electricity
 consumption from European computing demand in 2020 was about 81 TWh, which accounts

 14
 European Commission, “Energy-efficient Cloud Computing Technologies and Policies for an Eco-
 friendly Cloud Market”, 9 November 2020.
 15
 Based on Aurora’s long-term forecasts of these power markets.

Digital Transformation and a Net Zero Emissions Europe / Aurora Energy Research Ltd P a g e | 10
for almost 2.5% of Europe’s total electricity consumption.16 In the Continual Improvement
 scenario this grows to almost 115 TWh in 2040. However, in the same scenario, total
 projected carbon emissions from increased computation demand and commensurate data
 centre infrastructure growth are estimated to be about 20 million tonnes in 2020, and 16
 million tonnes in 2040 (shown in Figure 2). This equates to 2.8% of Europe’s carbon emissions
 in 2020 and 3% in 2040. Thus, although we estimate a 40% increase in the electricity
 consumption of European IT over the next twenty years, we expect emissions to decrease by
 19%. This is due to the increasingly less carbon-intensive outlook for European power systems.

 Minimising the impact of computing demand on carbon emissions will, therefore, also depend
 on the ability to optimise the location of data centres. The impact of the geographic
 optimisation of computing demand is explored further in the next section.

 3.3 The potential for further carbon emissions savings in
 computing demand
 Some larger changes in computing macro-trends could further reduce the emissions impact
 of European computing demand. For instance, as illustrated in Figure 4 and explained in
 further detail in the sub-sections below, a 10-percentage point increase in the penetration of
 virtualisation technology could lead to a cumulative 37 million tonne decrease in emissions
 over the next two decades. Further, the geographic optimisation of 14% off-premises data
 centres based on computing emissions intensity could lead to a cumulative 35 million tonne
 decrease in emissions over the same period.

 Accelerated adoption of recent innovations in virtualisation of storage, networking, load
 balancing, GPU (e.g., AI, ML, blockchain, virtual reality) technologies further expand the scope
 of workloads that can be virtualised with commensurate reductions in data centre
 infrastructure and energy consumption.

 It should be noted that these results represent our assessment of what is technically feasible
 in the industry. Greater public policy and regulatory efforts may be needed to help overcome
 market failures to achieve these positive benefits on CO2 emissions.

 16
 European Commission, “Energy-efficient Cloud Computing Technologies and Policies for an Eco-
 friendly Cloud Market”, 9 November 2020.

Digital Transformation and a Net Zero Emissions Europe / Aurora Energy Research Ltd P a g e | 11
Figure 4: Possible reductions in cumulative emissions from European Data Centres from 2020 to
 2040

 Carbon savings from increasing data centre virtualisation
 As previously mentioned, by increasing the utilisation of IT infrastructure, virtualisation allows
 for the same amount of computation to be done on less hardware. The impact of this on
 cumulative emissions is highlighted by the 55% drop between the Zero Progress and
 Continual Improvement scenarios. In the Continual Improvement scenario, we have assumed
 that the percentage of servers in public, private and hybrid cloud data centres that are
 virtualised across Europe increases from about 79% in 2020 to about 87% in 2040, and on-
 premises server virtualisation increases from 17% in 2020 to about 53% by 2040.

 In other words, the Continual Improvement scenario assumes that 13% of cloud data centres
 and 47% of on-premises operations are expected to not be virtualised by 2040, leaving greater
 emissions reductions potential by increasing the penetration of virtualisation in data centres.
 A further 10-percentage point increase in the virtualisation of servers in cloud data centres
 and on-premises operations (97% and 63% virtualisation by 2040, respectively) would further
 reduce total electricity consumption, reducing cumulative emissions 10% by 2040.

 While there are various reasons why a cloud services provider may not completely virtualise
 their servers (e.g., certain workloads may need to run directly on a physical server for
 performance reasons or the overhead costs of virtualisation may not justify the benefit of
 virtualisation), policy incentives to virtualise and a favourable European regulatory framework
 are needed to support the sector’s ability to limit CO2 emissions.17

 17
 Ingram Micro, “The Impact of Virtualization on a Data Center’s Infrastructure”, 09 June 2017. URL:
 https://imaginenext.ingrammicro.com/data-center/the-impact-of-virtualization-on-a-data-center-s-infrastructure

Digital Transformation and a Net Zero Emissions Europe / Aurora Energy Research Ltd P a g e | 12
Carbon savings from shifting computing demand to different locations
 Many European nations including the UK, Germany, Spain and France are pursuing high
 renewable energy penetration by 2040 (this is changing very rapidly, however, with the UK
 and Germany having already seen 80+% renewable energy peak generation at times). This
 increase in renewables will lead to massive decarbonisation of their electric grids relative to
 other countries with less ambitious targets. Thus, shifting cloud data centre computing
 demand to countries with lower average carbon intensity can be pivotal in achieving emissions
 reductions. Gradually shifting even 14% of total off-premises computing demand from
 countries with high grid emissions intensity like Poland, Greece, Turkey and Bulgaria to
 countries with low electricity emissions intensity like Norway, Sweden and Switzerland can
 result in an additional 11% decrease in cumulative emissions from computing demand by 2040.
 This act could also provide a strong incentive for those low-renewable penetration countries
 to develop renewable energy strategies.

 Of course, the entire computing demand of a country will not be shifted to other countries
 for many reasons, including data security, application latency and logistics restrictions. But
 enabling this locational flexibility can allow for similar intra-country shifts to areas with excess
 renewable generation, providing a benefit for renewables (by ensuring their cost-effective
 utilisation) but also for emission intensity of computing demand.

 This shift may occur naturally, considering off-premises data centre operators will be
 increasingly incentivised to locate in countries with low emissions intensity due to increasing
 carbon prices and reduced electricity prices from high renewables penetration. However, this
 incentive signal is often distorted by a patchwork of regulatory structures, taxes, and tax
 exemptions. For example, in the Scandinavian countries, Ireland, the Netherlands and France,
 data centres are categorised as “energy-intensive” industries, thus qualifying for minimum
 taxes and levies in the EU minimum energy tax. The difference can mean paying as much as
 73% less for energy.18 To the extent that regulatory or financial incentives do not align with
 the environmental impact, the environmentally optimal solution will be distorted.

 A pan-European approach to incentivising reductions in carbon emissions is therefore much
 needed since measures to promote both the location of data centres in more energy-
 efficient locations, as well the use of technologies that enable management of data centre
 energy usage, can only be effective and successful if done at EU level. Green public
 procurement policy, which the EU is planning to implement soon as part of the “Greening
 ICT” initiative, can help to lead the way. Cloud procurement regulations in many countries
 already incorporate cost-control, flexibility, and security requirements; the addition of
 sustainability and carbon-emissions requirements can help drive broader adoption of
 carbon-emissions management as a key factor in digital transformation and hybrid cloud
 adoption.

 18
 Koronen, C., Åhman, M. & Nilsson, L.J. “Data centres in future European energy systems—energy
 efficiency, integration and policy”. Energy Efficiency 13, 129–144 (2020). URL:
 https://doi.org/10.1007/s12053-019-09833-8

Digital Transformation and a Net Zero Emissions Europe / Aurora Energy Research Ltd P a g e | 13
4. Data centre best practices for supporting
 the integration of renewables into power
 grids across Europe
 An integral component of Europe’s climate targets involves a future energy grid system
 predominantly powered by renewable and low-carbon technologies. This has become
 apparent as the average cost of wind power has declined by 70% and solar PV by 86% over
 the past decade. In some countries, solar and wind power are already cost-competitive with
 conventional fossil fuel generation sources without subsidies.19 Also, considering expected
 trends, these renewables will similarly become cost-competitive in many other countries in
 the near future.20 However, to accommodate these renewables, the power system needs to
 be completely transformed in order to maintain the levels of resource adequacy and reliability
 in the electricity system to which we all have grown accustomed.

 Figure 5: Gross electricity generation by technology in EU 27 (incl. Norway, Switzerland and the
 United Kingdom) (Source: Energy Brainpool, “Energy, transport and GHG emissions Trends to 2050 –
 Reference Scenario 2016” [1], “TYNDP 2018” [4])

 19
 William Mathis, Bloomberg, “Offshore wind prices plunge in latest UK auction”, 09 December
 2019. URL: https://www.renewableenergyworld.com/2019/09/12/offshore-wind-prices-plunge-in-latest-uk-auction/
 20
 Lazard, “Lazard’s Levelized Cost of Energy Analysis—Version 13. 0”, November 2019. URL:
 https://www.lazard.com/media/451086/lazards-levelized-cost-of-energy-version-130-vf.pdf

Digital Transformation and a Net Zero Emissions Europe / Aurora Energy Research Ltd P a g e | 14
4.1 Challenges facing a high-renewables Europe
 The emergence of renewable energies like wind or solar present some challenges. Wind and
 solar power are intermittent. Solar energy is only available during daylight and can be easily
 dampened by cloud cover, and wind generation can swing rapidly from one hour to the next.

 Addressing these challenges requires different forms of flexibility to fulfil residual demand
 requirements21. The primary need is the shifting of renewable energy from times when more
 is being generated than can be consumed to periods to where there is not enough low-cost
 renewable generation to meet demand, requiring higher-cost, typically fossil-based
 generation to fill the gap. This can be achieved through grid-level technologies like storage
 and flexible demand.

 Figure 6: Demand-supply matching: as we approach 2050, flexibility and storage becomes necessary
 for the proper utilisation of renewables. (Source: Aurora Energy Research)
 When storing excess generation is not possible because of limited storage availability,
 increasing demand when renewable generation rises and responding conversely when it falls
 can support the integration of renewables into the grid. This demand and supply balancing
 increases revenues for renewable generators by reducing curtailment—turning off generation
 due to a glut on the system or grid constraints prohibiting supply to reach demand centres.
 This strategy not only improves the overall economics of renewables and resiliency of
 electricity supply, but also can economically provide other crucial grid services like inertia,
 frequency response, voltage support, etc.

 21
 Residual demand is the amount of electricity demand unmet by low marginal cost resources such as
 wind and solar power. This demand must be met by other sources in order to meet consumer
 demand and maintain grid stability.

Digital Transformation and a Net Zero Emissions Europe / Aurora Energy Research Ltd P a g e | 15
4.2 Data centres’ potential in supporting the integration of
 renewables on the grid

 Data centres can engage in demand response by reducing their power consumption
 to better match the current local supply of renewables
 Data centres are suitable candidates for demand response with minimal infrastructure
 investments since they are fitted with components that already monitor and respond to
 control signals. Some immediate opportunities include:

 • Workload scheduling to run low priority/batchable workloads when renewable energy
 is high; and
 • Moving a fraction of workloads to a different power grid location.
 A previous study by Koronen et al estimated the maximum theoretical potential for demand
 response for data centres to be in the range of 38 to 80% of the installed power demand in
 2030. 22 Of course, there are limits to the degree of demand respond data centres can
 contribute. Depending on the type of workload handled by the data centre, the duration of
 applicable demand response is typically in the range of minutes to hours. However, it may
 only require small amounts of workload curtailment or shifting across regional data centres to
 achieve the needed demand response. VMware vSphere, industry-leading compute
 virtualisation platform, enables companies to easily and dynamically manage workload
 placement and run times, and even power cycle hosts machines where workloads have been
 vacated to maximise low-risk curtailment capacity.

 Exciting early work is underway to leverage geographically disparate cloud environments and
 virtualised workload management capabilities to enable carbon-aware and carbon-efficient
 computing, 23 , 24 , 25 facilitating time- and/or geographic-shifting of workloads to periods or
 locations of low electricity carbon-intensity.

 If able to provide all this flexibility, data centres could become an important component of
 future European energy systems. Many jurisdictions are procuring a wide array of specific
 services to help integrate renewables and build a net zero emissions Europe. This includes an
 increasingly large capacity of batteries and demand side response from individual commercial
 and industrial entities, as well as aggregators. Data centres are in a unique position to provide
 these services as an add-on to their main functionality without having to make costly
 investments in search of high returns. This brings not only a financial benefit to data centres,
 but also valuable support to the integration of renewables in European power grids.

 22
 Koronen, C., Åhman, M. & Nilsson, L.J. “Data centres in future European energy systems—energy
 efficiency, integration and policy”. Energy Efficiency 13, 129–144 (2020). URL:
 https://doi.org/10.1007/s12053-019-09833-8
 23
 Zoha Usmani, Shailendra Singh, “A Survey of Virtual Machine Placement Techniques in a Cloud
 Data Centre”, Procedia Computer Science, Vol 78, 2016, pp 491-498.
 24
 Girish Ghatikar, Venkata Ganti, Nance Matson, Mary Ann Piette, “Demand Response Opportunities
 and Enabling Technologies for Data Centers: Findings From Field Studies”; 2012.
 25
 https://www.zdnet.com/article/green-tech-google-shifts-data-center-workloads-to-follow-the-sun-and-the-wind/

Digital Transformation and a Net Zero Emissions Europe / Aurora Energy Research Ltd P a g e | 16
Data centres can utilise their backup/emergency battery storage to help provide
 flexibility to the grid
 Typically, data centres have battery energy storage systems (BESS) to assist in securing an
 uninterruptible power supply sized to the peak power demand of the data centre. If a data
 centre requires 5 MW of electricity during its peak over the course of an average day, the
 site will also have a 5 MW BESS. These systems typically do not have much energy capacity
 though, providing power to the data centre for 5–30 minutes, long enough for back-up
 generators to become fully operational.26

 This storage can be utilised to charge when renewable generation on the grid is high and
 discharge when it is not. Operating the BESS in such a way can provide benefits to the data
 centre operators beyond altruistically helping the business case for renewables. Operators
 can actively shave their peak electricity consumption from the grid by using energy from
 their battery. This enables operators to reduce the portion of their energy bill, often referred
 to as the peak demand charge, which is based on the highest grid electricity demand of the
 data centre over a 15 to 30 minute period. Depending on the structure of the respective
 electricity market, this flexibility could enable a data centre to take advantage of time-of-use
 electricity price tariffs—using energy from a battery charged when electricity prices were
 lower instead of buying electricity from the grid during high-price periods.

 If the battery storage system is managed with enough reserve to serve its emergency
 purpose as well, it may also provide useful grid services and balancing. However, the more a
 data centre operator uses its BESS in energy markets, the faster the system will degrade,
 requiring replacement. Thus, an operator will have to optimise the operation of the BESS to
 maximise the financial benefit.

 Data centre operators can also optimise the cooling of the data centre to provide
 flexibility to the grid
 The use of pre-cooling, within limits, can also be utilised to temporally shift demand for
 server cooling without damaging equipment. According to the American Society of Heating,
 Refrigerating and Air-Conditioning Engineers, the recommended operating temperature for
 data centres is between 15° C and 40° C, depending on the configuration of the data centre
 and the workload demand. Data centre operators can look to pre-cool the data centres even
 by 0.5° C during periods of high renewable generation (likely responding to time-of-use
 tariffs). This virtually creates a thermal buffer, allowing for cooling demand to be reduced
 during periods of low renewables generation.

 Depending on the data centre’s size and architecture, it could take as little as five minutes to
 pre-cool a facility. 27 Similarly to the use of BESS to provide flexibility, peak demand charge
 reduction potential and time-of-use tariffs can adequately incentivise data centres to be
 operated to financially benefit while also helping to integrate renewables into the grid.

 26
 Y. Shi, B. Xu, D. Wang and B. Zhang, "Using Battery Storage for Peak Shaving and Frequency
 Regulation: Joint Optimization for Superlinear Gains," in IEEE Transactions on Power Systems, vol.
 33, no. 3, pp. 2882-2894, May 2018, doi: 10.1109/TPWRS.2017.2749512.
 27
 Basmadjian, Robert. (2019). “Flexibility-Based Energy and Demand Management in Data Centers: A
 Case Study for Cloud Computing”. Energies. 12. 3301. 10.3390/en12173301.

Digital Transformation and a Net Zero Emissions Europe / Aurora Energy Research Ltd P a g e | 17
5. Methodology
 In Section 4 of this report, we provide projections for energy consumption and resulting CO 2
 emissions from the European Computing sector out to 2040. The assumptions used in the
 analysis are estimates based on publicly available data. Forecasting trends in European-wide
 computing is a challenge, as the computing industry is rapidly evolving, opaque and highly
 heterogeneous. In this methodology section, we break down the steps taken to arrive at our
 final projections, highlighting the key areas of uncertainty in our assumptions.

 We will begin with the assumptions and calculations underlying the Continual Improvement
 scenario for European Computing Emissions, followed by an brief explanation of the differing
 factors behind the Zero Progress scenario, then an explanation of the additional waterfall
 steps in Figure 4, and then finally we will outline the sensitivities explored to reach the ‘high’
 and ‘low’ scenario projections (i.e. Continual Improvement scenario upper and lower bound).

 Computing Emissions Projections – Continual Improvement scenario

 The overall logical flow of calculations is summarised in Figure M1. Throughout the process,
 we maintain the distinction between on-premises and off-premises (cloud) computing. We
 begin on the left-hand side with metrics for computing demand and virtualisation that are
 combined to produce a forecast of the number of servers. We then factor in data on energy
 consumption related to IT and cooling to obtain total electricity consumption, which then
 leads to final forecast of emissions from the European computing sector.

 Figure M1: Flow chart outlining overall methodology.

Digital Transformation and a Net Zero Emissions Europe / Aurora Energy Research Ltd P a g e | 18
Computing Demand: The starting point for our calculations is our forecast of European
 computing workloads, based on the Cisco Global Cloud Index (GCI) 28 . Cisco defines the
 workload & compute instance (WCI) as a “a virtual or physical set of computer resources,
 including storage, that are assigned to run a specific application or provide computing services
 for one to many users”. It serves as a “general measurement used to describe many different
 applications”. Cisco published WCI estimates for both on-premises traditional computing and
 off-premises cloud computing for the years 2016-2021. Cisco’s estimates indicate that while
 cloud computing workloads will grow exponentially, the demand for traditional computing is
 dropping. We projected these trends out to 2040 using a linearly decreasing compound
 annual growth rate (CAGR), to reflect a likely slowing down of the boom in off-premises cloud
 computing adoption and the retention of on-premises computing for large players in the
 digital technology industry. The final Continual Improvement scenario for WCIs goes from
 96.5 million in 2020 to 2.4 billion in 2040 for off-premises computing and from 8.8 million to
 5.6 million for on-premises. Total WCI projections for the Continual Improvement scenario
 are shown in Figure M3.

 Virtualisation metrics: The next step in our analysis is forecasting trends of virtual machine
 (VM) density and virtualisation rate. VM density is the average number of virtual machines per
 virtualised server and is a measure of the sophistication of virtualisation technology, 29
 whereas virtualisation rate is the percentage of physical servers that are virtualised and is
 related to the penetration of virtualisation technology. The final assumed trajectories for VM
 density and virtualisation rate were given a sigmoidal (following along the exponential growth
 phase) and exponential (CAGR) shape, respectively. They were calibrated using WCI Density
 data (number of WCIs per server) and the formula below from Cisco, whilst being anchored
 to values independently published in literature30 and anecdotal views from industry experts.

 = × ( − 1) + 1
 ′ ′

 We assumed the same VM density trajectory for both off-premises and on-premises
 computing, growing from 15.5 in 2020 to 67.0 in 2040, while the Virtualisation Rates for on-
 premises and off-premises computing increase from 79% to 87% and 18% to 53%,
 respectively.

 These quantities are difficult to estimate, both at present and looking forward, due to industry
 practices being both technically and strategically opaque. Therefore, these assumed

 28
 Cisco, “Global Cloud Index: Forecast and Methodology, 2016–2021 White Paper”, 19 November
 2018
 29
 Evidence suggest that “VM density” to increase dramatically in the future with the rise of
 containerisation. For this analysis, we suggest containers to be a continuation of virtual machines
 rather than a separate entity. In application, containers and virtual machines are two different
 entities. Each virtual machine requires that a virtual server be run on a physical server, running its
 own operating system along with the various libraries required to host an application. Containers
 avoid the need for this duplication by running applications directly on the physical server on a single
 shared instance of the operating system. This frees up a lot of memory, bandwidth, and storage,
 leading to an increased number of workloads possible to run on a physical server.
 30
 For example, Stephan Belanger, Brad Casemore, IDC, “Exploring the Impact of Infrastructure
 Virtualization on Digital Transformation Strategies and Carbon Emissions”, August 2019. URL:
 https://www.vmware.com/content/dam/digitalmarketing/vmware/en/pdf/company/vmware-exploring-impact-of-
 infrastructure-virtualization-on-digital-transformation-strategies-and-carbon-emissions-whitepaper.pdf

Digital Transformation and a Net Zero Emissions Europe / Aurora Energy Research Ltd P a g e | 19
trajectories serve as estimations of European-wide averages and are not necessarily
 representative of the virtualisation rate and VM density of a particular data centre/cloud
 provider operation, due to the wide range in possible operational configurations.

 Projecting physical infrastructure: Using our forecasts for VM density and virtualisation rate,
 we projected WCI densities for cloud and on-premises computing. We then divided our
 projection for the number of WCI by the WCI density to obtain the number of physical servers
 required to sustain future computing demand.

 IT Energy Use per server: A recent estimate of total data centre energy usage in 2020 (81
 TWh) from the European Commission31 was divided by their quoted average PUE32 of 2 and
 Cisco’s33 estimated number of physical servers for that year, giving an average IT energy usage
 of approximately 4.9 MWh per “server” per year. This metric includes power used by an
 average server and its accompanying storage and network infrastructure but does not include
 cooling. Using a linearly decreasing CAGR, informed by literature on year-on-year efficiency
 gains due to technology advancements, we project this to decrease year-on-year from 4.9 in
 2020 to 2.2 MWh per “server” per year in 2040. Multiplying this projection for IT energy
 usage with our projection for the number of servers yields a timeline of annual data centre IT
 energy usage out to 2040.

 Geographic distribution of servers: Our projected number of physical servers were
 distributed amongst European countries based on a directory of off-premises and on-premises
 data centres34 for the application of country specific average PUE35 and emissions intensity
 timelines. The geographic distribution of data centres is assumed not to change over time.
 Aurora Energy Research used proprietary models to forecast the power market evolution and
 grid emissions intensity of several European countries. Where not available, CAGR-based
 projections of historical emissions intensity data are used. 36 A selection of these grid
 emissions intensity projections are shown in Figure M2. Multiplying projections for IT energy
 usage by these PUE and emissions intensity forecasts yields country-specific CO2 emission
 timelines, which are aggregated to give total European computing emissions, presented in
 Figure 2: Projected emissions from European computing demand (2020–2040) of the report.

 31
 European Commission, “Energy-efficient Cloud Computing Technologies and Policies for an Eco-
 friendly Cloud Market”, 9 November 2020.
 32
 The PUE of a data centre is defined as the ratio of total energy usage to IT energy usage.
 Avgerinou, M.; Bertoldi, P.; Castellazzi, L. “Trends in Data Centre Energy Consumption under the
 European Code of Conduct for Data Centre Energy Efficiency”. Energies 2017, 10, 1470.
 33
 Cisco, “Global Cloud Index: Forecast and Methodology, 2016–2021 White Paper”, 19 November
 2018
 34
 Data Center Research. URL: https://www.datacentermap.com/cloud.html
 35
 Avgerinou, M.; Bertoldi, P.; Castellazzi, L. “Trends in Data Centre Energy Consumption under the
 European Code of Conduct for Data Centre Energy Efficiency”. Energies 2017, 10, 1470.
 36
 European Environment Agency, “CO2 emission intensity”, 17 September 2018. URL:
 https://www.eea.europa.eu/data-and-maps/daviz/co2-emission-intensity-5#tab-
 googlechartid_chart_11_filters=%7B%22rowFilters%22%3A%7B%7D%3B%22columnFilters%22%3A%7B%22pre_config_ug
 eo%22%3A%5B%22European%20Union%20(current%20composition)%22%5D%7D%7D

Digital Transformation and a Net Zero Emissions Europe / Aurora Energy Research Ltd P a g e | 20
Figure M2: Emissions intensity timelines for select modelled European countries (2020—2040)

 Zero Progress scenario—changes to assumptions

 The Zero Progress scenario follows the same approach as the Continual Improvement
 scenario except the assumed virtualisation rate and VM density are constant throughout the
 projection, maintaining 2020 levels.

 Continual Improvement scenario—adjustments for the waterfall chart

 The steps in Figure 4 of the main report are calculated by cumulatively altering the certain
 inputs of the workflow outlined above.

 The first step results from assuming an increase in our virtualisation rate projections for both
 on-premises and off-premises computing. The change builds up linearly from +0 %p in 2020
 to +10 %p in 2040.

 The third step comes from revising the timeline of off-premises data centre distribution based
 on a ranking of countries in terms of their average forecasted carbon emissions intensity per
 server. All the off-premises computing demand from the worst ranked countries (Bulgaria,
 Malta, Greece, Turkey and Poland) is gradually shifted to the three best ranked countries
 (Norway, Sweden and Switzerland). This is meant to capture the potential effect of data
 centres being strategically located away from computing demand centres to minimise
 emissions.

Digital Transformation and a Net Zero Emissions Europe / Aurora Energy Research Ltd P a g e | 21
High and Low scenarios—changes to assumptions

 We acknowledge our forecasts are based on assumptions that carry significant uncertainty;
 this reflects the lack of transparency and inherent unpredictability of the rapidly advancing
 computing industry. Of these assumptions, our results are particularly sensitive to projections
 for WCI and IT energy usage efficiency gains. We flexed these inputs to provide reasonable
 upper and lower bounds for our forecasted computing emissions. The assumed projections
 for WCI are shown in Figure M3. The high scenario is characterised by high computing
 demand and low efficiency gains and the converse applies to the low scenario.

 Figure M3: Projected European computing demand (WCI) for the Central (Continual Improvement
 scenario), High, and Low scenarios (2020–2040)

Digital Transformation and a Net Zero Emissions Europe / Aurora Energy Research Ltd P a g e | 22
6. Further information
 For any questions related to the analysis in this report, please contact
 ana.barillas@auroraer.com, christian.miller@auroraer.com or
 sahasrajit.ramesh@auroraer.com.
 General disclaimer
 This document is provided “as is” for your information only, and no representation or warranty,
 express or implied, is given by Aurora Energy Research Limited (“Aurora”), its directors,
 employees, agents or affiliates (together its “Associates”) as to its accuracy, reliability, or
 completeness. Aurora and its Associates assume no responsibility, and accept no liability for,
 any loss arising out of your use of this document. This document is not to be relied upon for
 any purpose or used in substitution for your own independent investigations and sound
 judgement. The information contained in this document reflects our beliefs, assumptions,
 intentions, and expectations as of the date of this document and is subject to change. Aurora
 assumes no obligation, and does not intend, to update this information.

 Forward looking statements
 This document contains forward-looking statements and information that reflect Aurora’s
 current view about future events and financial performance. When used in this document, the
 words “believes”, “expects”, “plans”, “may”, “will”, “would”, “could”, “should”, “anticipates”,
 “estimates”, “project”, “intend”, or “outlook” or other variations of these words or other similar
 expressions are intended to identify forward-looking statements and information. Actual
 results may differ materially from the expectations expressed or implied in the forward-
 looking statements as a result of known and unknown risks and uncertainties. Known risks
 and uncertainties include but are not limited to risks associated with commodity markets,
 technology, contractual risks, creditworthiness of customers, performance of suppliers and
 management of plant and personnel; risk associated with financial factors such as volatility in
 exchange rates, increases in interest rates, restrictions on access to capital, and swings in
 global financial markets; risks associated with domestic and foreign government regulation,
 including export controls and economic sanctions; and other risks, including litigation. This list
 of important factors is not exhaustive.

 Copyright
 This document and its content (including, but not limited to, the text, images, graphics, and
 illustrations) is the copyrighted material of Aurora, unless otherwise stated. No part of this
 document may be copied, reproduced, distributed, or in any way used for commercial
 purposes without the prior written consent of Aurora.

 ©
 2021 Aurora Energy Research Ltd. Ref: DIRV1-0216
 Aurora Energy Research Ltd.
 2-3 Cambridge Terrace
 Oxford OX1 1TP
 United Kingdom
 +44 (0)845 299 3569
 auroraer.com

Digital Transformation and a Net Zero Emissions Europe / Aurora Energy Research Ltd P a g e | 23
You can also read