American Homes 4 Rent - Investor Highlights June 2021
←
→
Page content transcription
If your browser does not render page correctly, please read the page content below

American Homes
4 Rent
Investor Highlights
June 2021
Legal Disclosures
Forward-Looking Statements
Various statements contained in this presentation, including those that express a belief, expectation or intention, as well as those that are not statements of historical fact, are forward-
looking statements. These forward-looking statements may include projections and estimates concerning the timing and success of our strategies, plans or intentions. Forward-looking
statements are generally accompanied by words such as “estimate,” “project,” “predict,” “believe,” “expect,” “intend,” “anticipate,” “potential,” “plan,” “goal,” “guidance,” “outlook” or other
words that convey the uncertainty of future events or outcomes. Examples of forward-looking statements contained in this presentation include, among others, our 2021 Guidance, our
expectations with respect to the impacts of the COVID-19 pandemic, our belief that our acquisition and homebuilding programs will result in continued growth and the estimated timing and
volume of our development deliveries. We have based these forward-looking statements on our current expectations and assumptions about future events. These assumptions include,
among others, our projections and expectations regarding: market trends in the single-family home rental industry and in the local markets where we operate, our ability to institutionalize a
historically fragmented business model, our business strengths, our ideal tenant profile, the quality and location of our properties in attractive neighborhoods, the scale advantage of our
national platform and the superiority of our operational infrastructure, the effectiveness of our investment philosophy and diversified acquisition strategy, our ability to expand our
development program, our ability to grow our portfolio and to create a cash flow opportunity with attractive current yields and upside from increasing rents and cost efficiencies and our
understanding of our competition and general economic, demographic, regulatory and real estate conditions that may impact our business. While we consider these expectations and
assumptions to be reasonable, they are inherently subject to significant business, economic, competitive, regulatory and other risks, contingencies and uncertainties, most of which are
difficult to predict and many of which are beyond our control and could cause actual results to differ materially from any future results, performance or achievements expressed or implied by
these forward-looking statements. Investors should not place undue reliance on these forward-looking statements, which speak only as of the date of this presentation, June 7, 2021. We
undertake no obligation to update any forward-looking statements to conform to actual results or changes in our expectations, unless required by applicable law. Currently, one of the most
significant factors that could cause actual outcomes to differ materially from our forward-looking statements is the adverse effect of the COVID-19 pandemic on us, our tenants, the
economy and financial markets. The extent to which the COVID- 19 pandemic continues to impact us and our tenants will depend on future developments, which are highly uncertain and
cannot be predicted with confidence, including the scope, severity and duration of the pandemic, including resurgences, new variants or strains, impact of government regulations, the speed
and effectiveness of vaccine distribution, vaccine adoption rates and the direct and indirect economic effects of the pandemic and containment measures, among others. For a further
description of the risks and uncertainties that could cause actual results to differ from those expressed in these forward-looking statements, as well as risks relating to the business of the
Company in general, see the “Risk Factors” disclosed in the Company’s Annual Report on Form 10-K for the year ended December 31, 2020, Quarterly Report on Form 10-Q for the quarter
ended March 31, 2021, and in the Company’s subsequent filings with the Securities and Exchange Commission.

Non-GAAP Financial Measures
This presentation includes certain financial measures that were not prepared in accordance with U.S. generally accepted accounting principles (GAAP) because we believe they help investors
understand our performance. Any non-GAAP financial measures presented are not, and should not be viewed as, substitutes for financial measures required by U.S. GAAP and may not be
comparable to the calculation of similar measures of other companies. Definitions of these non-GAAP financial measures and a reconciliation of these measures to GAAP is included in the
Defined Terms and Non-GAAP Reconciliations section of this presentation, as well as the 1Q21 Supplemental Information Package available on our website at www.americanhomes4rent.com
under “For Investors.”

About American Homes 4 Rent
American Homes 4 Rent (NYSE: AMH) is a leader in the single-family home rental industry and “American Homes 4 Rent” is fast becoming a nationally recognized brand for rental homes,
known for high-quality, good value and tenant satisfaction. We are an internally managed Maryland real estate investment trust, or REIT, focused on acquiring, developing, renovating,
leasing, and operating attractive, single-family homes as rental properties. As of March 31, 2021 we owned 53,984 single-family properties in selected submarkets in 22 states.

Contacts
American Homes 4 Rent Investor Relations              American Homes 4 Rent Media Relations
Phone: (855) 794-2447 / Email: investors@ah4r.com     Phone: (805) 413-5088 / Email: media@ah4r.com

                                                                                                                                                                                              2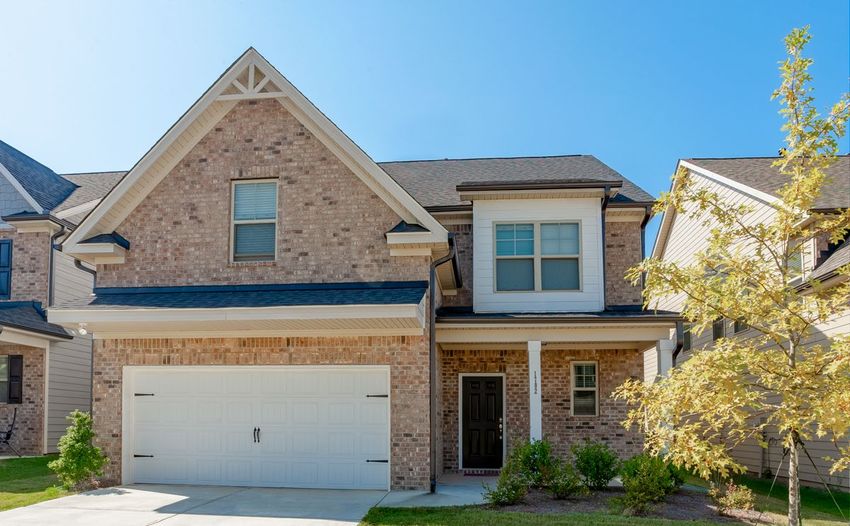
AMH At A Glance
Peer-Leading Growth Industry Leading First-of-its-Kind Built-
& Balance Sheet Operating Platform For-Rent Platform
2021 Guidance of 9.5% Core 53,984 high-quality properties Largest Builder of Single-Family
FFO Growth at Midpoint in 22 states with ~ 200,000 Homes For Rent with more
residents(1) than 2,000 Deliveries Expected
Highest 2020 Core FFO Growth in 2021
Among Residential REIT Peers
Same-Home 1Q21 Average 11,000 Unit Land Pipeline to
Occupied Days of 97.3% Fuel Further Acceleration
Highly successful ~$690 million
Equity Offering with 70%
Highest-Quality Product and
Issued on Forward Minimizing Best-in-Class Operating
Superior Investment Returns
Dilution Platform with Proprietary
Technology & Call Center
Three-Pronged External Growth
Net Debt and Preferred Shares Strategy Drives Consistent
to Adjusted EBITDAre of 6.0x(1) Growth in all Cycles
Unhindered Operational
Execution Through Pandemic
$16.1 Billion Total Market 4,050 Total Inventory Additions
Capitalization(1) Expected in 2021
Note: Refer to Defined Terms and Non-GAAP Reconciliations, as well as the 1Q21 Supplemental Information Package, for defined metrics and reconciliations to GAAP.
(1) As of March 31, 2021 3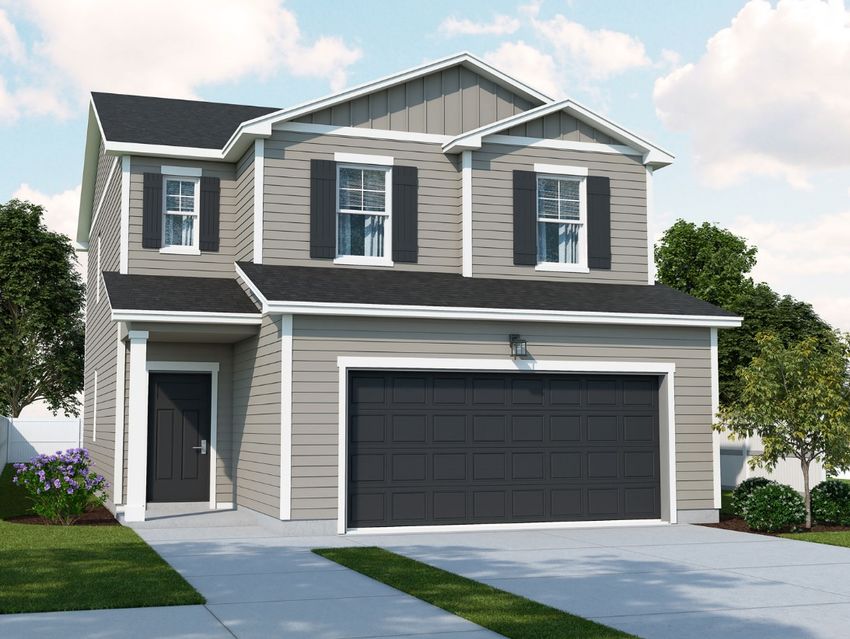
AMH Recent Highlights & FY 2021 Guidance

                     Record-high leasing trends and robust momentum continuing in 2Q21
                       • Leasing activity continues to accelerate into 2Q21                                           May 2021 Common Equity Offering
                                                               QTD          QTD           YoY
                                                  1Q21        May-20       May-21        ∆ bps        • Highly successful and oversubscribed common equity
Record High                                                                                             offering, raising ~$690 million gross proceeds
Occupancy &             Avg. Occupied Days       97.3%         95.2%        97.8%        + 260
                                                                                                      • ~70% of transaction issued on forward sale agreement to
 Rental Rate            New Lease Spreads        10.0%         4.0%         12.7%        + 870
                                                                                                        minimize dilution during capital deployment
  Growth(1)
                        Renewal Spreads           5.1%         2.0%         5.3%         + 330        • Strategically enables preferred share refinancing and
                        Blended Spreads           6.9%         2.7%         7.6%         + 490          incremental 2H21 acquisition opportunities, while
                                                                                                        maintaining best in class investment grade balance sheet
                       • ~24% YoY increase in 2021 total expected AMH
                         Development deliveries                                                                                      2021 Guidance(2)

                       • Acquisition team identifying increased 2H21 traditional                                                                         Range           Midpoint
                         channel opportunities
   Strategic                                                                                           Core FFO per share and unit                   $1.24 - $1.30        $1.27
                         • Now expect $400 million to $600 million 2021
Priority: Grow,
                            traditional channel acquisitions, a $200 million
 Grow, Grow                 increase from prior midpoint expectations
                                                                                                       Core FFO per share and unit growth            6.9% - 12.1%          9.5%

                       • 2021 capital deployment plan increased to $1.4B -
                         $1.8B, including wholly-owned and gross joint venture                         Same-Home Portfolio:
                         investments
                                                                                                       Core revenues growth                          3.75% - 4.75%        4.25%
                       • Achieved 1Q21 Core FFO / sh growth of 8.5% (without
Outsized Core            adjustment for COVID bad debt headwind)                                       Core property operating expenses growth       4.00% - 5.50%        4.75%
FFO per share
   Growth              • Expect 2021 Core FFO / sh growth of 9.5% at guidance                             Core NOI growth                            3.25% - 4.75%        4.00%
                         midpoint

     Note: Refer to Defined Terms and Non-GAAP Reconciliations, as well as the 1Q21 Supplemental Information Package, for defined metrics and reconciliations to GAAP.
                                                                                                                                                                                  4
     (1) Tabular data presented for the 2021 Same Home pool.
     (2) Refer to slide 27 for 2021 Outlook disclosure.
AMH Today

The Market Opportunity

Differentiated Growth Strategy: AMH Development

Strong Governance Practices

                                              5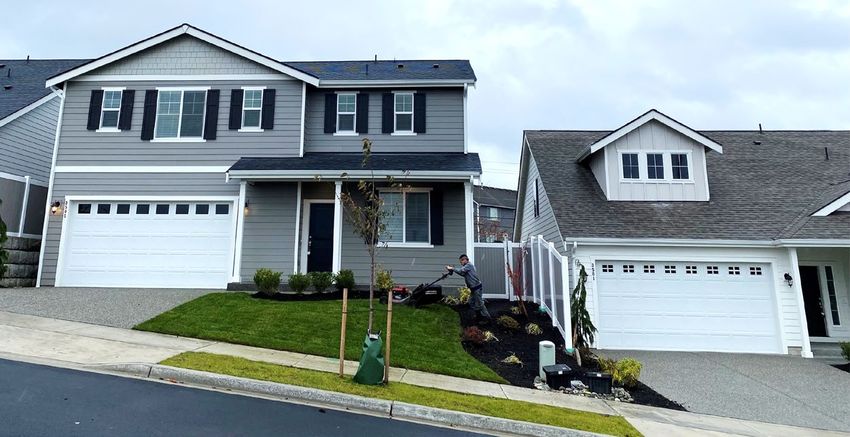
AMH Strategic Priority: Grow, Grow, Grow
                           Three-Pronged Growth Strategy Positions AMH for Opportunistic
                             Capital Allocation and Consistent Growth Throughout a Cycle
                                AMH Development                                                                                                4,050
                                                                                         4,000         Total Inventory Additions(1)
•   Early-mover advantage on built-for-rental strategy, which has                                                                               300
    potential to revolutionize the industry, made possible by the
    strength of our balance sheet                                                        3,500
•   Barriers to entry as AMH is only rental-home builder with
    complementary and highly efficient property management platform                      3,000
                                                                                                                                               1,700
•   AMH Development is consistently delivering new home                                                                         2,592
    communities with more than 60 communities opened inception to                        2,500     2,351
    date                                                                                                                         381
                                                                                                    408
                        AMH Development:                                                 2,000                                   564
      Superior Investment Return & Best Rental-Home Product                                                                                    2,050

                           National Builder Program                                      1,500                  1,379           1,647
•   Network of relationships with national home builders provides                                               148
                                                                                                   1,552
    acquisition access to new construction homes, which is a growth                                              286
                                                                                         1,000
    supplement to our AMH Development program
                                                                                                                 945
                                Traditional Channel
                                                                                          500
•   Seasoned, in-market acquisition teams sharp-shoot existing                                      391
    inventory opportunities, adding additional market scale and density
                                                                                            0
•   Experienced AMH rehab personnel create additional value through
    initial renovation process                                                                     2018         2019            2020           2021E
                                                                                            AMH Development   Traditional Acquisitions   National Builder

    (1) Includes inventory additions to our wholly owned and joint venture portfolios.
                                                                                                                                                       6
AMH Development - A Scalable and Differentiated
Driver of Earnings Growth
  4,000   1Q16: A Pioneering In-
          House Built-to-Rent
          Development Program is
  3,500   Conceived

                                                                       3,000 +
  3,000             3Q16: The First Land
                    Lots are Purchased and
                    the Team Begins to
  2,500             Come Together

                                                             2,050
  2,000
                                                    1,647
  1,500

                                             945
  1,000

                                                            Guidance
                                                            Midpoint
   500                             391

              0         19
     0
            2016       2017        2018      2019   2020     2021      2023

                                                                                 7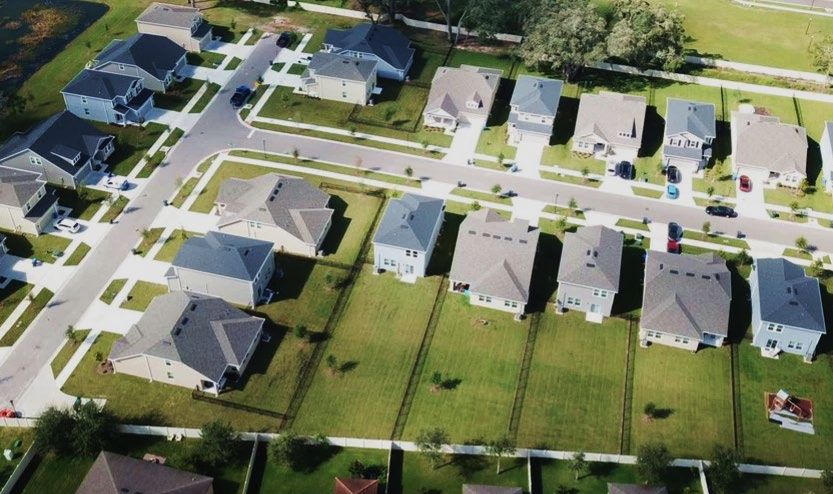
AMH Core FFO Bridge
$1.35

$1.30                                                                      $0.13    $0.01
        Three-Pronged External Investment Approach Gaining in                               $0.01
               Momentum, Driven by AMH Development

$1.25                                                                                               $1.27
        Strong Execution and Robust Fundamentals Continue to
                     Drive Strong Organic Growth

$1.20
                      $0.07          $0.01
                                                    $0.01

$1.15                                                           $1.16

$1.10   $1.11

$1.05

$1.00

                                              Same-Home NOI     Non Same-Home NOI

                                                                                                            8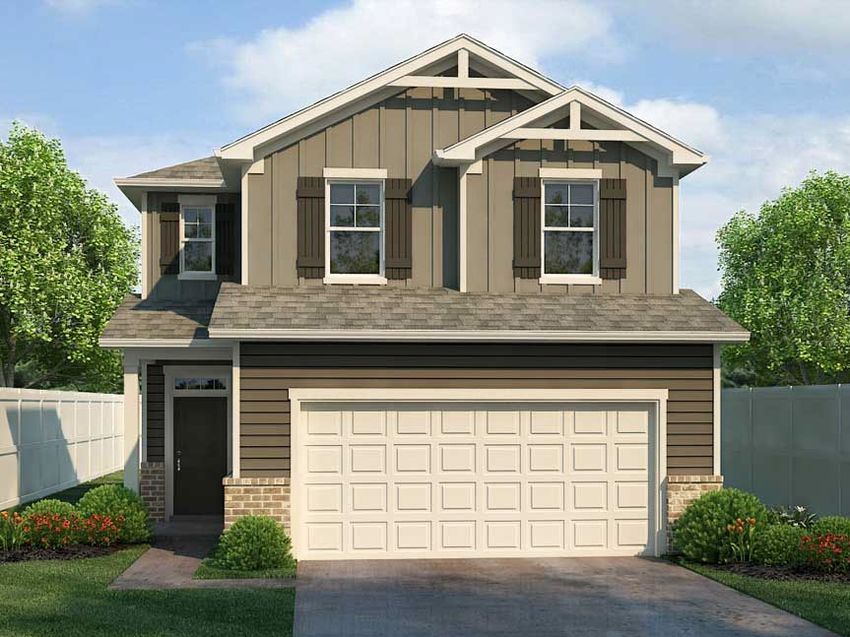
AMH vs. the Peer Set
                    2020 – YTD 2021 Total Shareholder Return(1)                                                                                 YoY Population Growth Rates(3)
         AMH         MAA          CPT         INVH        UDR          AVB         ESS         EQR                          AMH          MAA      INVH   CPT    UDR    ESS       EQR     AVB
                                                                                                                             1.3%        1.3%
60.00%

50.00%
         48.4%
                                                                                                                                                  1.0%

                                                                                                                                                         0.8%
40.00%

                     31.7%
30.00%                           27.3%       27.1%                                                                                                              0.6%

20.00%

                                                         10.9%
10.00%

                                                                      6.2%         6.1%
                                                                                               2.6%
                                                                                                                                                                       0.0%      0.0%   -0.1%
 0.00%

                             March YoY Job Loss Statistics(2)
         MAA          AMH          CPT        INVH         UDR         ESS         AVB          EQR

         -3.7%       -4.1%
                                 -5.1%
                                              -5.9%
                                                          -6.6%
                                                                      -7.3%
                                                                                  -7.9%        -7.9%
                             Multi-family National          Multi-family Coastal
          (1)    Source: S&P Global Market Intelligence. Total Return % YTD through June 4, 2021, with the inclusion of distributions.
          (2)    Source: Bureau of Labor Statistics, March 2021.
          (3)    Source: JBREC April 2021 YoY population growth rate.                                                                                                                           9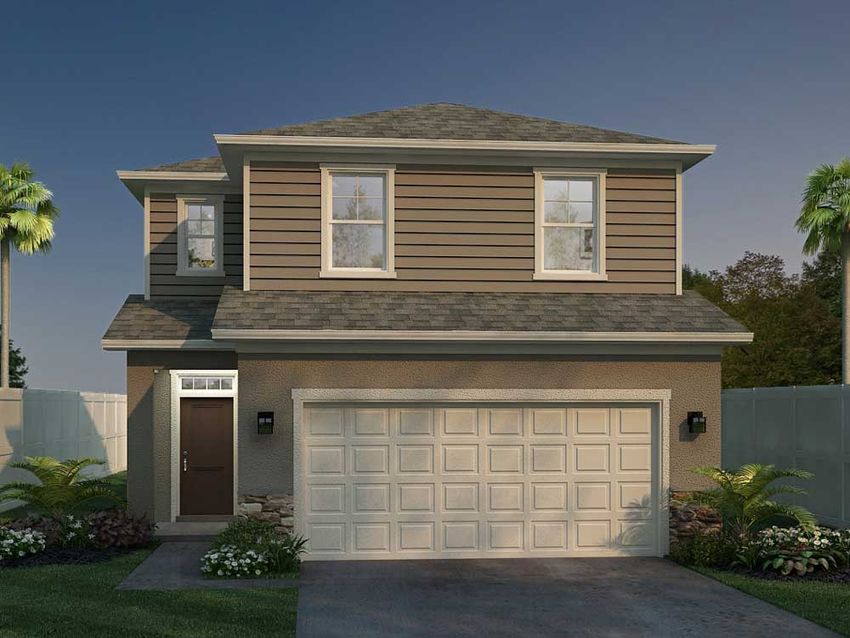
Investment Grade Balance Sheet to Drive Growth
Capital Structure(1) Debt Maturity Schedule(1)(2)(3)
Pro forma
Fixed Rate Debt liquidity(4)
17.7% $1,245
$1,250
Common Shares
& OP Units
$954
Floating Rate 76.3%
$1,050
$870
Debt
0.5% $850
$650
$510
Preferred $410
Shares $450
5.5%
$250
$90
$16 $21 $21 $10 $10 $10
$50
$(150)
Principal Amortization Unsecured Senior Notes
Revolving Credit Facility Liquidity - cash and cash equivalents
Asset-backed Securitizations Liquidity - undrawn revolving credit facility
Credit Ratings & Ratios(1) Balance Sheet Philosophy
Moody’s Investor Service Baa3 / (Stable) Maintain flexible investment grade Continue optimizing capital stack
S&P Global Ratings BBB- / (Stable) balance sheet with diverse access and utilize investment grade rating
to capital to reduce cost of capital
Net Debt to Adjusted EBITDAre 4.5 x Expand sources of available capital Prudent retention of operating cash
Net Debt and Preferred Shares to Adjusted EBITDAre 6.0 x as the Company and the SFR sector flow
Fixed Charge Coverage 3.3 x evolves and matures
Unencumbered Core NOI Percentage 67.0%
(1) As of March 31, 2021.
(2) As of March 31, 2021, reflects maturity of entire principal balance at the fully extended maturity date inclusive of regular scheduled amortization.
(3) The unsecured senior notes have maturity dates in 2028 and 2029, and the asset-backed securitizations maturing in 2045 on a fully extended basis have anticipated repayment dates in 2025. 10
(4) Pro forma liquidity represents the sum of $75 million of unrestricted cash on balance sheet and $1,170 million of undrawn capacity under the revolving credit facility. The Revolving Credit Facility was amended on April 15, 2021, to
expand the borrowing capacity to $1.25B and extend the maturity date to April 2026.AMH Today
The Market Opportunity
Differentiated Growth Strategy: AMH Development
Strong Governance Practices
11Multi-Year Demand Tailwind and Record-Low Supply
Millennials Likely to Enter Prime Single-Family Living Years Single-Family Propensity Increases with Parenthood / Age
Projected Population Growth(1) Share of Single-Family Housing by Age Cohort(2)
2.0%
1.5%
74% 75% 76%
1.0% 69% 71%
0.5% 53%
0.0% 32%
(0.5%) Ages 20-34 Ages 34-50
(1.0%)
2020
2022
2024
2026
2028
2030
2020
2022
2024
2026
2028
2030
Under 25 25-34 35-44 45-54 55-64 65-74 75+
Mortgage Tax Savings No Longer There
Existing Single-Family Home Inventory at Lows
for Entry-Level Home Buyers
TTM Average National Existing Home Inventory (MM) Mortgage Interest and Property Taxes in Excess of Standard Tax Deduction(4)
3.5
3.0
2.5
2.0
1.5
Existing Home Inventory 47% Below
Long-Term Average Levels as of Apr-2021
1.0
Sep-91
Sep-96
Sep-01
Sep-06
Sep-11
Sep-16
Jan-90
Jan-95
Jan-00
Jan-05
Jan-10
Jan-15
Jan-20
May-93
May-98
May-03
May-08
May-13
May-18
(1) Sources: U.S. Census Bureau; AMH Research
(2) Sources: U.S. Census Bureau; John Burns Real Estate Consulting, LLC
(3) Sources: NAR; John Burns Real Estate Consulting, LLC 12
(4) Source: Source: John Burns Real Estate Consulting, LLC (Data: 2020, updated quarterly) Pub: Mar-21. Assumes a married couple with a mortgage equal to 95% of median home price and a 1.5% property tax
rate.Ideal AMH Footprint: Migration Trends Existing
Even Prior to Pandemic
US Census Migration Data 2018 - 2019
• Observable 2018 - 2019 trends of out-bound migration from coastal urban centers to higher quality of life markets
• Trends continue into 2020 as the pandemic reinforced the advantages of suburban living such as extra living space, private yards, high
quality schools and a sense of neighborhood community resulting in record breaking demand
• AMH 1Q21 application data supports these trends with a 21% increase in applicants coming from states outside of AMH footprint over PY
Sources: U.S. Census Bureau; AMH Research, John Burns Real Estate Consulting, LLC (Data: YoY Change from July 2018-July 2019) Pub: Oct-20.
13AMH Today
The Market Opportunity
Differentiated Growth Strategy: AMH Development
Strong Governance Practices
14AMH Development – Revolutionizing the Industry
Data driven insights from AMH’s years of
experience formulate blueprint for the optimal
rental home – made possible by AMH’s unique
full lifecycle development capabilities and
management platform.
The AMH Developed Home
Desirable Durable Efficient
• Existing AMH submarkets with • Designed for durability and long- • Value engineering = superior
proven strong demand term efficient maintenance: quality at significant discount to
• “Neighborhood feel” and / or • Hard surface flooring market retail value:
community amenities designed to • Solid surface countertops • Standardized floorplans based
create emotional attachment • HVAC equipment & design on resident feedback and
• Designed for today’s home construction efficiency
• Cementitious siding
shopper: • Square footage optimized to
• Durability proven appliances
• Designer finishes & colors bed / bath count
• LED lighting
• Open floor plans • Standardized finishes & SKUs
• Pet friendly features for efficient construction &
long-term maintenance
Translates Into Premium Yield and Margin Enhancement
15AMH Development in Highly Desirable
Neighborhoods Within Current Footprint
Represents states in which we have active AMH Development markets
Bolstering Existing Markets
• Continued investment into existing AMH markets
• On-the-ground operating intelligence enables land
acquisition “sharp shooting”
• Active development teams in 16 markets provides geographic
diversity
16Building the Ideal Rental Home
First Floor Overview
1 Open Concept
• Designed to current lifestyle preferences
2 First Floor Laundry
• Facilitate easier washer/dryer move-in and move-out
• Minimize potential washer leaks to first floor
3 2 or 3 Car Garage
1
• Ample storage space to appeal to resident preferences
and promote long term retention
2
3
17Building the Ideal Rental Home
Second Floor Overview
1 Wider Staircase
• Facilitate easier move in / move out
• Reduces potential nicks and scuffs on walls
2 HVAC in Conditioned Space 3
• Improves energy efficiency, extends system life,
and easier access for maintenance and filter
changes
2
3 Large Walk-in Closets & Extra Storage
• Ample storage space to appeal to resident
preferences and promote long term retention
1
3 3
3
Data Driven Decisions for Long Term Durability
• Hard surface countertops
• Stainless steel appliances
• Tile backsplashes and shower surrounds 3
• Luxury vinyl plank throughout, including stair treads
• Soft close cabinet doors
• Standardized SKUs throughout home facilitates efficient
long-term maintenance
• Towel hooks instead of towel bars
18Exterior Home Features
Standardized Floor Plans –
Multiple Exteriors
TAMPA Provide construction efficiency
CHARLESTON
across the portfolio
JACKSONVILLE ORLANDO
19Pocket Office
Adaptable Design
• AMH has control over full development
lifecycle
• Enables data driven decision execution such
as incorporation of work from home pocket
office
20AMH Development Communities
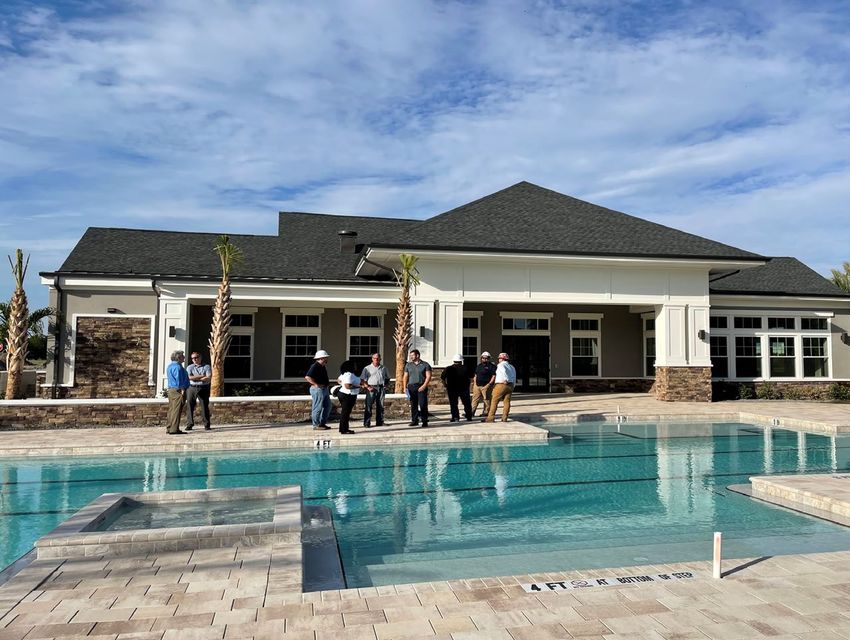
Amenity Centers Create a Community Feel Additional Benefits
• AMH leasing office • Lawn care
• On-site and convenient access for better resident • Priced into monthly rent driving additional revenues
experience • AMH control over pristine curb appeal
• Club room & casual kitchen • Eases maintenance for residents
• Facilitates social gatherings and neighborhood events • Fenced yards
• Conference rooms and co-working spaces • Privacy and safety for pets and kids
• Allows for personal meetings • Connected communities unlock future opportunities
• Provides alternative remote work environment • Smart home and broadband ancillary revenue
• Fitness center & pool • Individually platted lots
• Reduces resident need for gym membership • Increases longer term exit optionality
• Large pool designed for relaxation and enjoyment
21AMH Development – Construction Sustainability
AMH Develops Homes That Are Environmentally Friendly
Development & Construction Sustainability
Aim to minimize our carbon footprint in our development:
• We conserve natural resources and reduce waste while focusing on
building new single-family homes that are desirable to families
To reduce our energy consumption:
We include tree planting plans as part of
community design.
• We adhere to the most recent upgraded standards in energy efficiency
and construction methodology
• We select finishes that are both desirable and durable to reduce the waste
generated by home turnover from one resident to another
To help improve the community:
• We build neighborhoods, not just homes, and we include green space or
natural areas and tree planting plans as part of the design
Granite countertops, hard surface luxury vinyl plank
(LVP) flooring and LED lighting are all designed to
last for many years without repairs or replacement.
22AMH Today
The Market Opportunity
Differentiated Growth Strategy: AMH Development
Strong Governance Practices
23Corporate Governance Highlights
• AMH is governed by a 13‐member board of trustees
Independent &
Accountable • Independent Chairman of the Board
Stewardship • Annual election of trustees
• Majority voting standard (plurality carve‐out voting standard only in contested elections)
• Continual process to refresh and strengthen board composition
• The average tenure of the Board is ~5 years
• 6 new independent trustees added in the past 4 years
Continued Focus on • Michelle Kerrick joined the Board in September 2020, adding deep experience in corporate governance,
Board Refreshment financial and strategic planning, operational effectiveness and digital transformation
• Lynn Swann joined the Board in August 2020, adding extensive public company board experience as well as
considerable expertise in business, marketing and civic engagement
• Matthew Zaist joined the Board in February 2020, adding homebuilding experience, a critical element given
importance of the Company’s development program to drive value
• Commitment to sound environmental, social responsibility and corporate governance practices is the
foundation to help us provide a superior experience for our residents
• These efforts can enhance shareholder value both by reducing our costs and by creating more desirable
ESG Focus
homes and communities that appeal to our current and future residents
• When developing or renovating properties, we look for ways to reduce water and energy usage costs as well as
using materials that are both durable and sustainable
• Cash and equity incentive compensation includes annual and multi-year performance periods tied to absolute
Performance-Based and relative peer group metrics
Compensation
• Robust stock ownership requirements (6x for CEO, 5x for Trustees)
Practices
• Align shareholders and management through standard vesting period
24ESG Principles That Guide Us
Sound environmental, social responsibility and corporate governance practices not only make good
business sense, they uphold our obligation to employees, residents, communities and shareholders.
Develop new homes and residential Contribute to the well-being of the Invest in our employees with health and
communities that meet the latest energy communities in which we operate through wellness programs and diversity initiatives,
efficiency requirements and include energy- direct investments to rehabilitate, improve and provide opportunities for education,
and water-saving technologies and develop our homes and advancement, training and competitive
that lower operating costs and benefit the residential communities. benefits.
environment.
Educate our employees, residents and Continue to monitor and evaluate our
Build and operate homes efficiently at scale business partners regarding home energy corporate governance in light of prevailing
that are both durable, and desirable to our conservation and environmental practices.
residents, with a goal to limit future costs. sustainability.
Report at least annually on our ESG practices
Encourage our employees to participate in Reduce our cost of operations by ongoing and initiatives.
community service and philanthropic service evaluation and improvement of our energy
to support local initiatives in our efficiency requirements and include energy-
communities. and water-saving technologies that lower
operating costs and benefit the environment.
Yards feature efficient irrigation systems that are designed Kitchens are designed with superior finishes and materials Employees participate in local community volunteer events
to use less water. that are both durable and attractive. such as this program at Manna Food Bank.
25Appendix
26Defined Terms and Non-GAAP Reconciliations
2021 Guidance
The Company does not provide guidance for the most comparable GAAP financial measures of net income or loss, rents and other single-family
property revenues and property operating expenses, or a reconciliation of the forward-looking non-GAAP financial measures to the comparable GAAP
financial measures because we are unable to reasonably predict certain items contained in the GAAP measures, including non-recurring and infrequent
items that are not indicative of the Company’s ongoing operations. Such items include, but are not limited to, net gain or loss on sales and impairment
of single-family properties, casualty loss, Non-Same-Home revenues and Non-Same-Home property operating expenses. These items are uncertain,
depend on various factors and could have a material impact on our GAAP results for the guidance period.
Average Occupied Days Percentage
The number of days a property is occupied in the period divided by the total number of days the property is owned during the same period after
initially being placed in-service. This calculation excludes properties classified as held for sale.
Core Net Operating Income ("Core NOI“)
Core NOI, which we also present separately for our Same-Home, unencumbered and encumbered portfolios, is a supplemental non-GAAP financial
measure that we define as core revenues, which is calculated as rents and other single-family property revenues, excluding expenses reimbursed by
tenant charge-backs, less core property operating expenses, which is calculated as property operating and property management expenses, excluding
noncash share-based compensation expense and expenses reimbursed by tenant charge-backs.
Core NOI also excludes (1) gain or loss on early extinguishment of debt, (2) hurricane-related charges, net, which result in material charges to the
impacted single-family properties, (3) gains and losses from sales or impairments of single-family properties and other, (4) depreciation and
amortization, (5) acquisition and other transaction costs incurred with business combinations and the acquisition or disposition of properties as well as
nonrecurring items unrelated to ongoing operations, (6) noncash share-based compensation expense, (7) interest expense, (8) general and
administrative expense, and (9) other income and expense, net. We believe Core NOI provides useful information to investors about the operating
performance of our single-family properties without the impact of certain operating expenses that are reimbursed through tenant charge-backs.
Core NOI should be considered only as a supplement to net income or loss as a measure of our performance and should not be used as a measure of
our liquidity, nor is it indicative of funds available to fund our cash needs, including our ability to pay dividends or make distributions. Additionally, this
metric should not be used as a substitute for net income or loss or net cash flows from operating activities (as computed in accordance with GAAP).
27Defined Terms and Non-GAAP Reconciliations
The following is a reconciliation of Core NOI to its respective GAAP metric (amounts in thousands):
For the Trailing
Twelve Months Ended
Core NOI Mar 31, 2021
Net income $ 166,223
Gain on sale and impairment of single-family properties and other, net (48,523)
Depreciation and amortization 350,403
Acquisition and other transaction costs 11,997
Noncash share-based compensation - property management 2,305
Interest expense 115,328
General and administrative expense 52,456
Other income and expense, net (1,918)
Core NOI $ 648,271
28Defined Terms and Non-GAAP Reconciliations
Credit Ratios
We present the following selected metrics because we believe they are helpful as supplemental measures in assessing the Company’s ability to service
its financing obligations and in evaluating balance sheet leverage against that of other real estate companies. The tables below reconcile these
metrics, which are calculated in part based on several non-GAAP financial measures (amounts in thousands, except credit ratios and percentages):
Net Debt to Adjusted EBITDAre and Net Debt and Preferred Shares to Adjusted EBITDAre
Mar 31, 2021
Total Debt $ 2,922,374
Less: cash and cash equivalents (75,237)
Less: asset-backed securitization certificates (25,666)
Less: restricted cash related to securitizations (40,439)
Net debt $ 2,781,032
Preferred shares at liquidiation value 883,750
Net debt and preferred shares $ 3,664,782
Adjusted EBITDAre - TTM $ 611,661
Net Debt to Adjusted EBITDAre 4.5 x
Net Debt and Preferred Shares to Adjusted EBITDAre 6.0 x
29Defined Terms and Non-GAAP Reconciliations
Fixed Charge Coverage
For the Trailing
Twelve Months Ended
Mar 31, 2021
Interest expense per income statement $ 115,328
Less: amortization of discounts, loan costs and cash flow hedge (7,411)
Add: capitalized interest 21,225
Cash interest 129,142
Dividends on preferred shares 55,128
Fixed charges $ 184,270
Adjusted EBITDAre - TTM $ 611,661
Fixed Charge Coverage 3.3 x
Unencumbered Core NOI Percentage
For the Trailing
Twelve Months Ended
Mar 31, 2021
Unencumbered Core NOI $ 434,419
Core NOI 648,271
Unencumbered Core NOI Percentage 67.0%
30Defined Terms and Non-GAAP Reconciliations
EBITDA / EBITDAre / Adjusted EBITDAre
EBITDA is defined as earnings before interest, taxes, depreciation and amortization. EBITDA is a non-GAAP financial measure and is used by us and
others as a supplemental measure of performance. EBITDAre is a supplemental non-GAAP financial measure, which we calculate in accordance with
the definition approved by the National Association of Real Estate Investment Trusts (“NAREIT”) by adjusting EBITDA for gains and losses from sales or
impairments of single-family properties and adjusting for unconsolidated partnerships and joint ventures on the same basis. Adjusted EBITDAre is a
supplemental non-GAAP financial measure calculated by adjusting EBITDAre for (1) acquisition and other transaction costs incurred with business
combinations and the acquisition or disposition of properties as well as nonrecurring items unrelated to ongoing operations, (2) noncash share-based
compensation expense, (3) hurricane-related charges, net, which result in material charges to the impacted single-family properties, and (4) gain or
loss on early extinguishment of debt.
The following is a reconciliation of net income, as determined in accordance with GAAP, to EBITDA, EBITDAre and Adjusted EBITDAre (amounts in
thousands):
For the Trailing
Twelve Months Ended
Mar 31, 2021
Net income $ 166,223
Interest expense 115,328
Depreciation and amortization 350,403
EBITDA $ 631,954
Gain on sale and impairment of single-family properties and other, net (48,523)
Adjustments for unconsolidated joint ventures 1,496
EBITDAre $ 584,927
Noncash share-based compensation - general and administrative 9,546
Noncash share-based compensation - property management 2,305
Acquisition, other transaction costs and other (1) 14,883
Adjusted EBITDAre $ 611,661
(1) Included in acquisition, other transaction costs and other is a net $2.9 million nonrecurring expense related to a legal matter involving a former employee during the quarter ended
31
September 30, 2020.Defined Terms and Non-GAAP Reconciliations
FFO / Core FFO / Adjusted FFO attributable to common share and unit holders
FFO attributable to common share and unit holders is a non-GAAP financial measure that we calculate in accordance with the definition approved by
NAREIT, which defines FFO as net income or loss calculated in accordance with GAAP, excluding gains and losses from sales or impairment of real estate,
plus real estate-related depreciation and amortization (excluding amortization of deferred financing costs and depreciation of non-real estate assets),
and after adjustments for unconsolidated partnerships and joint ventures to reflect FFO on the same basis.
Core FFO attributable to common share and unit holders is a non-GAAP financial measure that we use as a supplemental measure of our performance.
We compute this metric by adjusting FFO attributable to common share and unit holders for (1) acquisition and other transaction costs incurred with
business combinations and the acquisition or disposition of properties as well as nonrecurring items unrelated to ongoing operations, (2) noncash
share-based compensation expense, (3) hurricane-related charges, net, which result in material charges to the impacted single-family properties, and (4)
gain or loss on early extinguishment of debt.
Adjusted FFO attributable to common share and unit holders is a non-GAAP financial measure that we use as a supplemental measure of our
performance. We compute this metric by adjusting Core FFO attributable to common share and unit holders for (1) Recurring Capital Expenditures that
are necessary to help preserve the value and maintain functionality of our properties and (2) capitalized leasing costs incurred during the period. As a
portion of our homes are recently developed, acquired and/or renovated, we estimate Recurring Capital Expenditures for our entire portfolio by
multiplying (a) current period actual Recurring Capital Expenditures per Same-Home Property by (b) our total number of properties, excluding newly
acquired non-stabilized properties and properties classified as held for sale.
We present FFO attributable to common share and unit holders, as well as on a per FFO share and unit basis, because we consider this metric to be an
important measure of the performance of real estate companies, as do many investors and analysts in evaluating the Company. We believe that FFO
attributable to common share and unit holders provides useful information to investors because this metric excludes depreciation, which is included in
computing net income and assumes the value of real estate diminishes predictably over time. We believe that real estate values fluctuate due to market
conditions and in response to inflation. We also believe that Core FFO and Adjusted FFO attributable to common share and unit holders, as well as on a
per FFO share and unit basis, provide useful information to investors because they allow investors to compare our operating performance to prior
reporting periods without the effect of certain items that, by nature, are not comparable from period to period.
FFO, Core FFO and Adjusted FFO attributable to common share and unit holders are not a substitute for net income or net cash provided by operating
activities, each as determined in accordance with GAAP, as a measure of our operating performance, liquidity or ability to pay dividends. These metrics
also are not necessarily indicative of cash available to fund future cash needs. Because other REITs may not compute these measures in the same
manner, they may not be comparable among REITs.
32Defined Terms and Non-GAAP Reconciliations
The following is a reconciliation of net income attributable to common shareholders, as determined in accordance with GAAP, to Core FFO attributable to
common share and unit holders (amounts in thousands, except share and per share data):
For the Three Months Ended For the Year Ended
Mar 31, 2020 Mar 31, 2021 Dec 31, 2019 Dec 31, 2020
Net i ncome a ttri buta bl e to common s ha rehol ders $ 20,244 $ 30,214 $ 85,911 $ 85,246
Adjus tments :
Noncontrol l i ng i nteres ts i n the Opera ti ng Pa rtners hi p 3,501 4,925 15,221 14,455
Ga i n on s a l e a nd i mpa i rment of s i ngl e-fa mi l y properti es a nd other, net (6,319) (16,069) (40,210) (38,773)
Adjus tments for uncons ol i da ted joi nt ventures 238 382 1,797 1,352
Depreci a ti on a nd a morti za ti on 82,821 90,071 329,293 343,153
Les s : depreci a ti on a nd a morti za ti on of non-rea l es ta te a s s ets (2,064) (2,788) (7,933) (9,016)
FFO a ttri buta bl e to common s ha re a nd uni t hol ders $ 98,421 $ 106,735 $ 384,079 $ 396,417
Adjus tments :
(1)
Acqui s i ti on, other tra ns a cti on cos ts a nd other 2,852 4,846 3,224 12,889
Nonca s h s ha re-ba s ed compens a ti on - genera l a nd a dmi ni s tra ti ve 1,369 4,342 3,466 6,573
Nonca s h s ha re-ba s ed compens a ti on - property ma na gement 439 999 1,342 1,745
Los s on ea rl y exti ngui s hment of debt - - 659 -
Core FFO a ttri buta bl e to common s ha re a nd uni t hol ders $ 103,081 $ 116,922 $ 392,770 $ 417,624
Core FFO a ttri buta bl e to common s ha re a nd uni t hol ders per FFO s ha re a nd uni t $ 0.29 $ 0.32 $ 1.11 $ 1.16
Wei ghted-a vera ge FFO s ha res a nd uni ts :
Common s ha res outs ta ndi ng 300,813,069 316,982,460 299,415,397 306,613,197
Sha re-ba s ed compens a ti on pl a n (2) 720,386 756,539 686,050 724,523
Opera ti ng pa rtners hi p uni ts 52,026,980 51,664,757 53,045,004 51,990,094
Tota l wei ghted-a vera ge FFO s ha res a nd uni ts 353,560,435 369,403,756 353,146,451 359,327,814
(1) Included in acquisition, other transaction costs and other is a net $2.9 million nonrecurring expense related to a legal matter involving a former employee during the year ended December 31,
2020. 33
(2) Reflects the effect of potentially dilutive securities issuable upon the assumed vesting/exercise of restricted stock units and stock options.Defined Terms and Non-GAAP Reconciliations
Same-Home Property
A property is classified as Same-Home if it has been stabilized longer than 90 days prior to the beginning of the earliest period presented under
comparison. A property is removed from Same-Home if it has been classified as held for sale or has been taken out of service as a result of a casualty
loss.
Stabilized Property
A property acquired individually (i.e., not through a bulk purchase) is classified as stabilized once it has been renovated by the Company or newly
constructed and then initially leased or available for rent for a period greater than 90 days. Properties acquired through a bulk purchase are first
considered non-stabilized, as an entire group, until (1) we have owned them for an adequate period of time to allow for complete on-boarding to our
operating platform, and (2) a substantial portion of the properties have experienced tenant turnover at least once under our ownership, providing the
opportunity for renovations and improvements to meet our property standards. After such time has passed, properties acquired through a bulk
purchase are then evaluated on an individual property basis under our standard stabilization criteria.
Total Debt
Includes principal balances on asset-backed securitizations, unsecured senior notes and borrowings outstanding under our revolving credit facility as
of period end, and excludes unamortized discounts and unamortized deferred financing costs.
Total Market Capitalization
Includes the market value of all outstanding common shares and operating partnership units (based on the NYSE AMH Class A common share closing
price as of period end), the current liquidation value of preferred shares as of period end and Total Debt.
34You can also read