An Experimental Study of Wind Resistance and Power Consumption in MAVs with a Low-Speed Multi-Fan Wind System
←
→
Page content transcription
If your browser does not render page correctly, please read the page content below
An Experimental Study of Wind Resistance and Power Consumption in
                                                  MAVs with a Low-Speed Multi-Fan Wind System

                                         Diana A. Olejnik1 , Sunyi Wang1 , Julien Dupeyroux1 , Stein Stroobants1 , Matěj Karásek 1 , Christophe De Wagter1
                                                                                      and Guido de Croon1

                                             Abstract— This paper discusses a low-cost, open-source and
                                         open-hardware design and performance evaluation of a low-
                                         speed, multi-fan wind system dedicated to micro air vehicle
arXiv:2202.06723v1 [cs.RO] 14 Feb 2022

                                         (MAV) testing. In addition, a set of experiments with a flapping
                                         wing MAV and rotorcraft is presented, demonstrating the
                                         capabilities of the system and the properties of these different
                                         types of drones in response to various types of wind. We
                                         performed two sets of experiments where a MAV is flying
                                         into the wake of the fan system, gathering data about states,
                                         battery voltage and current. Firstly, we focus on steady wind
                                         conditions with wind speeds ranging from 0.5 m/s to 3.4 m/s.
                                         During the second set of experiments, we introduce wind gusts,
                                         by periodically modulating the wind speed from 1.3 m/s to 3.4
                                         m/s with wind gust oscillations of 0.5 Hz, 0.25 Hz and 0.125
                                         Hz. The ”Flapper” flapping wing MAV requires much larger           Fig. 1. Open-source, open-hardware multi-fan wind system dedicated to
                                         pitch angles to counter wind than the ”CrazyFlie” quadrotor.       MAVs testing.
                                         This is due to the Flapper’s larger wing surface. In forward
                                         flight, its wings do provide extra lift, considerably reducing
                                         the power consumption. In contrast, the CrazyFlie’s power
                                         consumption stays more constant for different wind speeds.         not represent well real outdoor scenarios. The nature of
                                         The experiments with the varying wind show a quicker gust          wind is unstable and gusty. Hence there is a need for wind
                                         response by the CrazyFlie compared with the Flapper drone,         systems that can generate variable wind conditions. Gust
                                         but both their responses could be further improved. We expect
                                         that the proposed wind gust system will provide a useful tool      generation by utilising multiple oscillating vanes is a com-
                                         to the community to achieve such improvements.                     mon experimental method for simulating atmospheric gusts
                                                                                                            [5]. With the aim of performing gust response experiments
                                                              I. I NTRODUCTION                              on aircraft wings [6] developed a low subsonic wind tunnel
                                            During the last years, we observe a growing demand for          gust generator based on two rectangular gust vanes with a
                                         drones from the commercial and government sectors. Tech-           symmetric airfoil oscillating in pitch. [7] presented a similar
                                         nological advances in sensory and processing capabilities          solution but with only one gust vane. Another approach
                                         of micro air vehicles (MAVs) bring them closer to their            assumes an active grid installed on the wind tunnel nozzle
                                         bigger size counterparts. For inspecting narrow or cluttered       [8] or the use of blowing air jets mounted on two fixed
                                         environments in a safe manner, small and agile MAVs are            profiles as in [9]. In contrast, passive solutions for turbulence
                                         the best choice. However, due to their small size and low          generation assume the use of roughness blocks, spires and
                                         weight, MAVs are heavily affected by even modest wind              grids mounted in the wind tunnel. With those, it is hard to
                                         gusts. Hence, there is an emerging need for algorithms and         simulate low-frequency fluctuations [14].
                                         design solutions that will ensure efficient and stable flight of      The next category of wind gust generators is that of
                                         MAVs, even in windy conditions. Modeling aerodynamics              multiple-fan-based systems. [10] demonstrates the perfor-
                                         is still an active area of research, e.g., for flapping wing       mance of 99 fans mounted in an open-circuit wind tunnel.
                                         drones with complex fluid-to-structure interactions [1], [2]       [11] proposes multiple fans mounted on swivel plates to
                                         or for rotorcraft in confined spaces [3], [4]. Hence, in order     easily control wind speed and direction. [12] presents a
                                         to test and evaluate wind resistance simulation studies are        multi-fan wind tunnel concept integrated into a low pressure
                                         insufficient. An experimental approach is needed, preferably       environmental chamber at NASAs Jet Propulsion Labora-
                                         with a controlled, indoor wind generation setup. Existing          tory to simulate the external free stream flow of forward-
                                         experimental approaches are typically taking advantage of          flight scenarios in a low-density environment. Finally, also a
                                         large, expensive wind tunnel facilities. These facilities gen-     commercial product was developed by the company ”Wind-
                                         erally produce steady wind with a laminar flow that does           shape”, a multiple-fan system that promises real wind and
                                           1 All
                                                                                                            weather imitation [13].
                                                 authors are with the MAVLab, Department of       Control
                                         and   Operations, TU Delft, the Netherlands. Contact     author:      The majority of solutions presented here require a sophis-
                                         diana.olejnik@gmail.com                                            ticated facility to generate wind gusts or/and inevitably entail
exceedingly high investment costs. Multiple-fan systems          can be accessed through the following GitHub repository:
have an advantage due to the possibility to independently        https://github.com/tudelft/wind_system.
control each fan and are more effective in generating a large
turbulence scale. Thus, they can mimic real-world scenarios
more closely. Moreover, in the case of bio-inspired flapping-
wing MAVs, such a system will allow for a higher similarity
between animal and robot experiments.
   Hence, we present here, a low-speed multi-fan wind sys-
tem dedicated to MAVs testing (See Figure 1). Our main
contribution here is describing the low-cost, mobile and
open-source system, its design and performance evaluation.
In this way, we hope to make it accessible for a bigger
group of researchers. In addition, we performed experiments
with a flapping wing MAV and rotorcraft to demonstrate the
usefulness and capabilities of the system. We assumed two
sets of experiments, where a drone is flying into the wake of
the fan system, gathering data about states, battery voltage
                                                                 Fig. 2. General overview of the hardware architecture of our wind system.
and current. Firstly, we focus on steady wind conditions.        Each wind module consists of 9 fans controlled by an Arduino Mega
We set a wind speed and record around 50 seconds of free         microcontroller via PWM signals. All modules are controlled by a script
flight. We repeat the experiment six times for wind speeds       running on the Raspberry Pi 4 board via a UDP protocol established over
                                                                 an Ethernet network. The user can define and change the parameters of the
ranging from 0.5 m/s to 3.4 m/s. During the second set           wind generation from a host machine connected to the Raspberry Pi via a
of experiments, we introduce a wind gust, by periodically        standard WiFi protocol.
modulating wind speed from 1.3 m/s to 3.4 m/s in a loop.
The tested frequencies of wind gust oscillations are 0.5 Hz,
0.25 Hz and 0.125 Hz.                                            B. Performance
                                                                    1) Quantitative flow visualization: For a preliminary as-
   II. T HE WIND SYSTEM DESIGN AND DEVELOPMENT
                                                                 sessment of the performance of the wind system, we have
A. Working principle and design                                  used the Probe Capture (ProCap) tool, a device for instant
   For the purpose of drone testing in real-life scenarios, a    flow visualization and measurement. We have mapped the
low-speed multi-fan wind system was designed and built.          airflow of the fan system by manually scanning the region
The solution presented in this study consists of an array of     in front of the fan array by the measuring device. The 7-hole
135 axial fans that occupy a space of 1.2 x 0.75 meters,         pressure probe equipped with three passive markers tracked
for a total wind surface of 0.9m2 . The 4-wire fans offer a      by a motion tracking system, in this case, an OptiTrack
pulse width modulation (PWM) based control and access            system, allows us to acquire an instantaneous position of the
to a tachometer reading. The system is divided into 15           probe and to process the measured flow field in real-time.
modules, where each module comprises 9 fans along with an        Figure 3 shows the experimental setup.
independent control unit, a low-power CMOS 8-bit micro-
controller based on the AVR Arduino Mega architecture. All
modules are equipped with an Ethernet port in order to allow
connection to a network switch. Next in the line is Raspberry
Pi 4B (RPi), which collects and sends data periodically
through the UDP protocol. A simple Python script allows
to set a certain PWM signal, read RPM of each fan and set
preprogrammed functions for oscillating wind airstreams at
various frequencies and RPMs ranging from 0-3600. The
hardware architecture is shown in Fig. 2. The electrical
components like power supplies, fuses, network switch and
RPi are mounted on a DIN rail. The entire system is designed
to be powered from a non-industrial power outlet (12V/500W
at full-load operation). The enclosure of the fan was designed
in ‘Autodesk Professional’ and constructed using aluminium
profiles, metal sheets, HPL (High Pressure Laminate) plates.
                                                                 Fig. 3. Experimental setup of the wind speed mapping using the Probe
The system is modular and allows to simply access, remove        Capture (ProCap) tool with the infrared cameras. The 7-hole pressure probe
or replace sections of 9 fans mounted on a box-like frame,       is equipped with three reflective passive markers to allow position tracking.
driven by telescopic guides. The enclosure placed on a
set of sturdy wheels makes it a mobile unit that is easily          The flow was measured at three streamwise positions from
transportable. The wind system is an open-source project that    the fan array: 0.5, 1 and 1.5 meters from the fan array.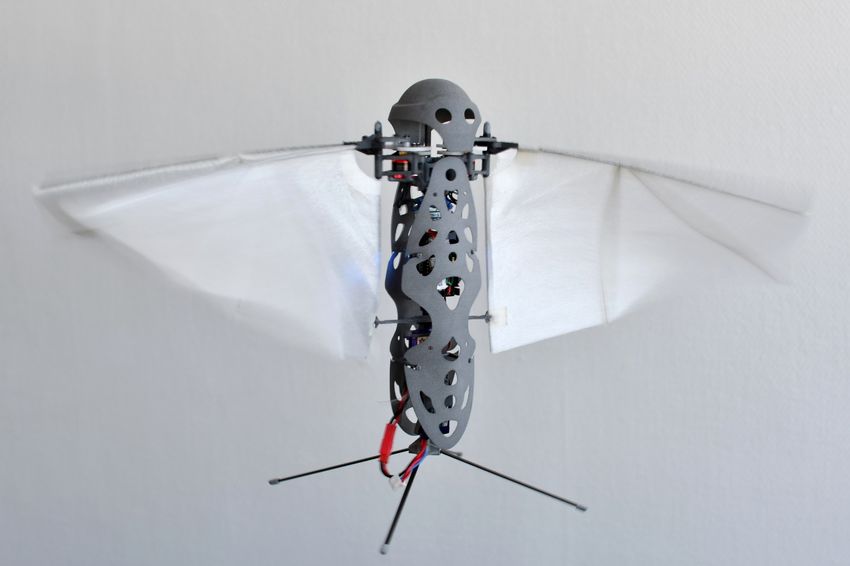
Post-processing and comparison of the interpolated data were                            grid’s measurement results also provide more accurate time-
performed in Paraview, an open-source software for multi-                               averaged wind speed mapping of the fan system at various
platform data analysis and visualization applications. Figure                           RPMs as shown in Figure 4, given its extra calibration efforts
4 presents the obtained mapping of the RPM in a function                                at extremely low flow speeds and higher frequency response
of the average wind speed measured at a distance of 1 meter.                            compared to the pressure probe used in the ProCap system.
                                                                                           For steady flights, the ideal flight envelope would be
                 3500                                                                   in front of the fan modules at the center, where RevP
                 3000                                                                   sensors 7,8,9 point towards. This region also has the lowest
                 2500                                                                   turbulence intensity around 1.5-5%, while at the boundary
   RPM [1/min]

                 2000
                                                                                        of the flow volume, turbulence intensity could spike up to
                                                                                        approximately 22%.
                 1500

                 1000

                  500                                          RevP
                                                               7-hole probe
                   0
                        0   0.5   1       1.5      2     2.5     3            3.5
                                      Wind Speed [m/s]

Fig. 4. Time-averaged wind speed mapping of the fan system at various
RPMs, 1 meter from the fan array. The measurement taken with the 7-
hole probe (the ProCap tool) is marked in green and the RevP sensor-based
sensing grid is marked in blue.

   2) Flow uniformity investigation: To further examine the
flow field uniformity and turbulence level at the 1-meter                               Fig. 5. Test set-up for flow field mapping of the fan system at various
optimal downstream distance for MAV operation, 15 RevP                                  RPMs, with 15 RevP sensors forming a wind sensing grid.
airflow sensors from Modern Device form a sensing grid
that is placed in front of the fan system as illustrated in
Figure 5. These highly sensitive thermistor-based airflow                                                  0.5

sensors are calibrated using a static method in the wind                                                                                                                            3

                                                                                                                                                                                        Wind Speed [m/s]
tunnel at the TUDelft aerodynamics facility, at a room
                                                                                                   y [m]

temperature of approximately 21◦ C, which is consistent with                                               0.25                                                                     2

the temperature during the flow tests of the fan system. The
convenient setup and flexible installation of the low-cost                                                                                                                          1

sensor grid make it a robust tool to accompany the fan system
                                                                                                                0                                                                   0
when flow quality needs to be examined. Inspired by hot-                                                            0                0.25               0.5       0.75          1
wire anemometer calibration, an air velocity calibrator from                                                                                            x [m]
TSI (Model 1127) is used to improve the RevP calibration
                                                                                        Fig. 6. Time-averaged wind speed map of the fan system at full RPM at
accuracy at flow speeds of less than 1 m/s, which is a flow                             1 meter from the fan array.
regime difficult to measure with enough accuracy for the
MAV operation under low-speed wind disturbances.
   The data acquisition of the wind sensing grid is done                                               4
with two Teensy 4.1 microcontrollers with onboard SD                                                                                                                                PWM
                                                                                    Wind Speed [m/s]

                                                                                                       3                                                                            duty cycle
logging, sampling at approximately 3000Hz simultaneously
                                                                                                                                                                                        20 %
for all 15 sensors for 20 seconds at each fan RPM. Post-                                                                                                                                30 %
                                                                                                       2                                                                                40 %
processing is done in MATLAB by doing initial sensor offset                                                                                                                             50 %
adjustment and higher-frequency noise removal through low-                                                                                                                              60 %
                                                                                                       1                                                                                70 %
pass filtering with a cut-off frequency of 50 Hz. Figure                                                                                                                                80 %
                                                                                                                                                                                        90 %
6 shows an example of the interpolated results from the                                                                                                                                 100 %
                                                                                                       0
time-averaged wind speeds at the 15 grid points. Overall,                                                   1           2   3   4    5      6   7   8     9 10 11 12 13 14 15
reduced flow speeds are observed near the boundary of the                                                                                   Sensor number [-]
flow envelope due to flow expansion and mixing with the
                                                                                        Fig. 7. Time-averaged wind speed at various grid points of the fan system
ambient, without the use of an encapsulated downstream                                  with different RPMs, 1 meter from the fan array (The nine different PWM
test section. This flow speed fluctuation at the flow volume                            signals here correspond to the RPM settings in Figure 4.)
boundary can also be seen in Figure 7 near sensor locations
1,5,6,10,11,15. By implementing fan tachometer feedback in
the wind speed regulation control loop and the possibility                                                                          III. E XPERIMENTAL SETUP
of an active wind speed reading with the RevP sensors, the                                 The wind system was placed in the Cyberzoo, a flight
uniformity of the flow field could be improved. The sensing                             arena (10 m x 10 m x 7 m) of TU Delft equipped with a
motion tracking system consisting of 12 OptiTrack Prime
17W cameras. In the center of the fan array, four active
markers were added to ensure access to information about
changes in wind speed. The markers are programmed to blink
with the change of the PWM signal of the fans. The drone
enters the flow from the side, then goes to the waypoint
located at the 1m distance from the center of the fan array
and returns to its starting point. The positioning system,
here OptiTrack, sends state data to the drone’s ground
station. Accurate position control is ensured by the outer-loop
guidance algorithm based on proportionalintegralderivative Fig. 8. Flapper, a 100-gram bio-inspired flapping-wing MAV from company
(PID) controllers. Flapper Drones.
We assumed three sets of experiments, where a drone is
flying into the wake of the fan system, gathering data about
quadrotor flies with a single cell 250mAh 3.7 LiPo battery,
states, battery voltage and current. Firstly, we focus on steady
sustaining about 3-4 minutes of flight.
wind conditions. We set a wind speed and record around 50
seconds of free flight. We repeat the experiment six times
for wind speeds ranging from 0.5 m/s to 3.4 m/s. During
the second set of experiments, we introduce a wind gust, by
periodically modulating wind speed from 1.3 m/s to 3.4 m/s
in a loop. The modulation is achieved by repeatedly changing
PWM signals from 50% to 100% duty cycles at regular
intervals. The tested frequencies of wind gust oscillations
are 0.5 Hz, 0.25 Hz and 0.125 Hz.
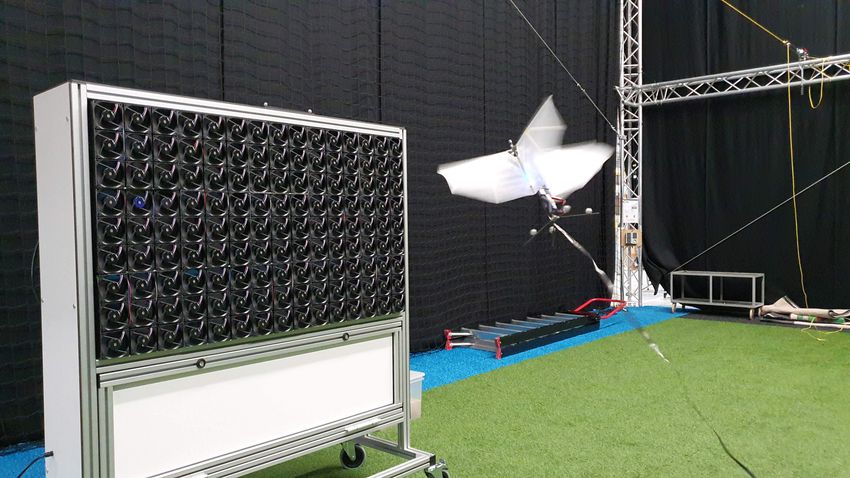
A. Flapping Wing MAV
For the experiments, we have used a flapping wing (Figure Fig. 9. Crazyflie, a 39-gram MAV from company Bitcraze.
8) delivered by the company Flapper Drones 1 , referred to
in this paper as ”Flapper”. This tailless flapping wing MAV
is a successor of the DelFly Nimble [15]. It has a wingspan IV. R ESULTS
of 49 cm weights 102g and is capable of carrying 25 g of A. Various wind speeds
payload. At hover, the flapping frequency is approximately The first set of experiments considers the flight of a MAV
12 Hz. The Flapper is equipped with the Crazyflie Bolt at various wind speeds. Figures 10 and 11 show the relation
autopilot board (Bitcraze AB) and a 6-axis IMU BMI088 between the pitch angle and forward speed of the flying
- triaxial accelerometer and gyroscope. The data link be- MAVs. At the small wind speeds, the MAVs are almost
tween the autopilot and the ground station is obtained via hovering with only a small pitch angle. Once the wind speed
Crazyradio PA, a USB radio dongle based on nRF24LU1+ increases, the pitch angle becomes more substantial for the
from Nordic Semiconductor. To sustain a 4-6 minutes long Flapper till the point where it reaches a forward flight regime
flight, depending on the complexity of maneuvers, the robot where the wings start to provide lift.
requires a 300mAh, 7.4V LiPo battery. For the purpose of The magnitude of the pitch angle for the Flapper is much
performing analysis of the onboard power consumption, the higher compared to the Crazyflie. This is due to the Flapper’s
ACS711 Hall effect-based linear current sensor was added much larger wing surface, requiring more thrust to counter
to the autopilot board. the wind. When pitching forward, the wings do provide extra
B. Rotorcraft lift, since they function as an airfoil. The time series of pitch
angles for both MAVs can be observed in Figures 12 and 13.
The quadrotor used in this research is the Crazyflie 2.1.
Figures 14 and 15 show boxplots of the power con-
This tiny quadrotor built by the company Bitcraze features
sumption in function of wind speed, where mean power
four brushed motors, an STM32F4 based flight controller 2 .
consumption is approximated using a cubic smoothing spline
The motor-to-motor length is 92mm and the take-off weight
(blue curve) and the mean values are marked with blue
with the 3D-printed propellor-guard and added current sensor
circles. The characteristic bell shape curve of the Flapper
is 39gr, which is close to the maximum recommended weight
drone is reminiscent of the fuel consumption curve of a
of 42gr. The current sensor is the same one as used on
helicopter [15]. This indicates that the power consumption is
the Flapper, the ACS711 linear current sensor. Similar to
reduced by increasing forward velocity, which is due to the
Flapper, the communication between the Crazyflie 2.1 and
wings providing extra lift. Nevertheless, too high a forward
the ground station is obtained via the Crazyradio PA. The
velocity will cause a significant rise in the power demand due
1 https://flapper-drones.com/wp/ to the induced drag. The two tested MAVs are too different
2 https://www.bitcraze.io/products/crazyflie-2-1 for a direct comparison of power consumption (e.g., 102g for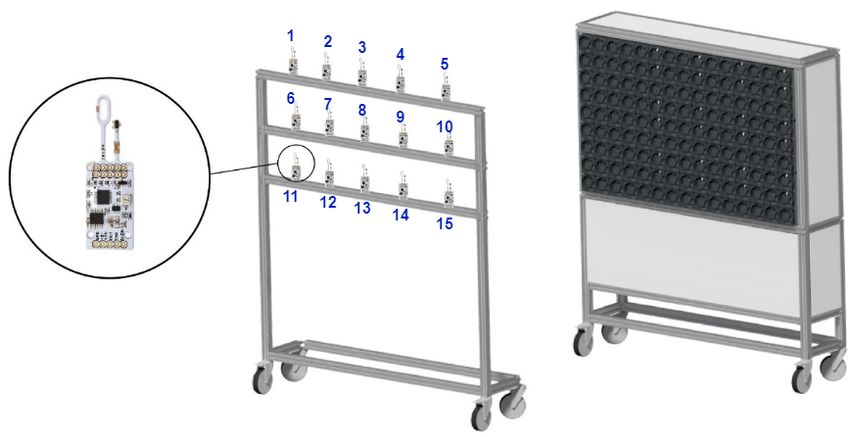
20
                   -10
                                                                                             10
                   -15                                                                       0

                                                                              Pitch [deg]
                   -20                                                                      -10
    Pitch [deg]

                   -25                                                                      -20                                                         0.5 m/s
                                                                                                                                                        0.9 m/s
                                                                                            -30                                                         1.3 m/s
                   -30                                                                                                                                  2.1 m/s
                                                                                            -40                                                         2.7 m/s
                   -35                                                                                                                                  3.4 m/s
                                                                                            -50
                                                                                                  0        10      20      30     40       50   60     70         80
                   -40
                                                                                                                                Time [s]
                   -45
                         0.5   0.9   1.3           2.1         2.7    3.4                             Fig. 12.   Flapper: Time series of the pitch angle.
                                           Wind Speed [m/s]
                                                                                              8
Fig. 10. Flapper: Pitch angle at various wind speeds. The average value                       6
is marked with a blue circle. Flapper                                                         4
                                                                                              2

                                                                               Pitch [deg]
                                                                                              0
                   -1                                                                        -2
                                                                                             -4                                                             0.5 m/s
                                                                                                                                                            0.9 m/s
                   -2                                                                        -6                                                             1.3 m/s

                   -3                                                                        -8                                                             2.1 m/s
                                                                                                                                                            2.7 m/s
                                                                                            -10
     Pitch [deg]

                                                                                                                                                            3.4 m/s
                   -4                                                                       -12
                                                                                                  0        10      20      30     40       50    60     70            80
                   -5
                                                                                                                                Time [s]
                    -6
                                                                                                  Fig. 13.       Crazyflie: Time series of the pitch angle.
                    -7

                   -8
                         0.5   0.9   1.3          2.1         2.7    3.4    on the fan system, which were programmed to blink when
                                           Wind Speed [m/s]                 a new PWM signal is commanded. The Crazyflie appears
                                                                            to respond faster to changes. The Flapper struggles more
Fig. 11. Crazyflie: Pitch angle at various wind speeds. The average value   to hold the position even during the ”no gust” case (See
is marked with a blue circle.
                                                                            Figures 18 and 19). The Flapper’s position control system
                                                                            has a limitation: it commands thrust to go up and pitch to
the Flapper and 39g for the CrazyFlie). Indeed, in absolute                 go forward. At the speed 3.4 m/s and at over 40 degrees of
terms, the CrazyFlie uses on average less power, around                     pitch, attitude-dependent mapping needs to be added in order
8.8W whereas the lowest power consumption of the Flapper                    to maintain level flight.
is 12.7W, at 2.7m/s wind. However, the trend is indicative of
the differences between flapping wing MAVs and quadrotors.                                                           V. C ONCLUSION
Over the varying wind speeds, the CrazyFlie has a much                         This work presents the design and characterization of a
more constant power consumption (Fig. 15). This suggests                    low-speed, open-source and open-hardware multi-fan wind
that more research on the quadrotor’s optimal flight speed                  system. We have performed experiments with two types of
is needed to demonstrate that dynamic lift reduces power                    MAVs – a flapping wing and a quadrotor – in order to
consumption.                                                                characterize their wind response and power consumption
                                                                            in different constant and varying wind conditions. The ex-
B. Wind gusts                                                               periments showed that flapping wing MAVs have to pitch
   The second set of experiments introduces wind gusts. The                 more in response to oncoming wind, due to the larger wing
wind speed is periodically modulated from 1.3 m/s to 3.4 m/s                surface area. However, in higher wind conditions, the wings
in a loop. Figures 16 and 17 show 2 periods of experiment                   do provide extra lift, leading to lower power consumption
with wind gust oscillation of 0.125 Hz and on top of it                     at higher wind speeds. The experiments also showed that
0.25Hz and 0.5Hz. The grey area indicates a change in speed                 the gust responses of both systems should be improved if
for the 0.125Hz case. The baseline is added - the curve ”no                 we are to increasingly employ MAVs in real-world, windy
gust” which shows flight at steady conditions with a wind                   environments. We hope that the proposed open-source, open-
speed of 3.4 m/s. The information about the exact moment                    hardware fan wall will provide the community with the right
of the change was retrieved from the active markers mounted                 tool for developing and testing these improvements.
16                                                                                                    no gust         0.5 Hz         0.25 Hz        0.125 Hz
              15.5                                                                               -20

                                                                                Pitch [deg]
               15                                                                                -30
              14.5                                                                               -40
  Power [W]

               14                                                                                -50
                                                                                                       0     2         4        6          8    10      12       14    16        18   20
              13.5                                                                                                                             Time [s]
               13
              12.5                                                            Fig. 16. Flapper: Pitch angle at various wind conditions: from steady
                                                                              wind (no gust) to wind gust with various oscillation frequencies ranging
                     0.5   0.9         1.3         2.1         2.7     3.4    from 0.125 Hz to 0.5 Hz.
                                        Wind speed [m/s]
                                                                                                                        no gust        0.5 Hz          0.25 Hz        0.125 Hz
                                                                                                   0
Fig. 14. Flapper: Power consumption at various wind speeds. The mean

                                                                                Pitch [deg]
value is marked with a blue circle.
                                                                                                  -5

              9.2
                                                                                                 -10
                                                                                                       4         6          8         10        12        14          16      18      20
                9
                                                                                                                                               Time [s]
              8.8
  Power [W]

                                                                              Fig. 17. Crazyflie: Pitch angle at various wind conditions: from steady
              8.6                                                             wind (no gust) to wind gust with various oscillation frequencies ranging
                                                                              from 0.125 Hz to 0.5 Hz.
              8.4
                                                                                                                           no gust         0.5 Hz       0.25 Hz        0.125 Hz
              8.2

                                                                                Position X [m]
                                                                                                 -0.5
                     0.5         0.9         1.3         2.1     2.7   3.4
                                                                                                  -1
                                        Wind speed [m/s]
                                                                                                 -1.5
Fig. 15. Crazyflie: Power consumption at various wind speeds. The mean                                   0            5              10          15           20            25        30
value is marked with a blue circle.                                                                                                            Time [s]

                                                                              Fig. 18. Flapper: Position X at various wind conditions: from steady wind
                                       R EFERENCES                            (no gust) to wind gust with various oscillation frequencies ranging from
                                                                              0.125 Hz to 0.5 Hz.
 [1] W. Shyy, H. Aono, S.K. Chimakurthi, P. Trizila,C.K. Kang, C.E., Ces-
     nik and H. Liu, 2010. Recent progress in flapping wing aerodynamics                                                   no gust         0.5 Hz       0.25 Hz        0.125 Hz
                                                                                Position X [m]

                                                                                                  -0.6
     and aeroelasticity. Progress in Aerospace Sciences, 46(7), pp.284-327.
 [2] T. Wan and C.K. Huang, 2008, September. Numerical simulation of                              -0.8
     flapping wing aerodynamic performance under gust wind conditions.
     In 26th International Congress of the Aeronautical Sciences (pp. 1-11                         -1

 [3] S. Prothin, C. Fernandez Escudero, N. Dou and T. Jardin, 2019. Aero-                         -1.2
     dynamics of MAV rotors in ground and corner effect. International                                   0            5              10          15           20            25        30
     Journal of Micro Air Vehicles, 11, p.1756829319861596.                                                                                    Time [s]
 [4] Y. Lei and H. Wang, 2020. Aerodynamic performance of a quadrotor
     MAV considering the horizontal wind. Ieee Access, 8, pp.109421-
     109428.                                                                  Fig. 19. Crazyflie: Position X at various wind conditions: from steady
 [5] A.J. Saddington, M.V. Finnis, K. Knowles The characterisation of a       wind (no gust) to wind gust with various oscillation frequencies ranging
     gust generator for aerodynamic testing. Proceedings of the Institution   from 0.125 Hz to 0.5 Hz.
     of Mechanical Engineers, Part G: Journal of Aerospace Engineering.
     2015 Jun;229(7):1214-25.
 [6] P.M. Lancelot, J. Sodja, N.P. Werter, and R. De Breuker, Design and      [11] J.Y. Wang, Q.H. Meng, B. Luo , M. Zeng, A multiple-fan active control
     testing of a low subsonic wind tunnel gust generator. Advances in             wind tunnel for outdoor wind speed and direction simulation. Review
     aircraft and spacecraft science 4.2 2017, pp 125.                             of Scientific Instruments. 2018 Mar 19;89(3):035108.
 [7] H. Mai, J. Neumann, H. Hennings, Gust response: a validation ex-         [12] M. Veismann, C. Dougherty, J. Rabinovitch, A. Quon, M. Gharib,
     periment and preliminary numerical simulations. Proceedings” IFASD            Low-density multi-fan wind tunnel design and testing for the Ingenuity
     2011”.                                                                        Mars Helicopter. Experiments in Fluids. 2021 Sep;62(9):1-22.
 [8] J. Roadman, K. Mohseni, Gust characterization and generation for         [13] F. Noca, G. Catry, N. Bosson, L. Bardazzi, S. Marquez, A. Gros, Wind
     wind tunnel testing of micro aerial vehicles. In47th AIAA aerospace           and weather facility for testing free-flying drones. InAIAA Aviation
     sciences meeting including the new horizons forum and aerospace               2019 Forum 2019 (p. 2861).
     exposition 2009 Jan (p. 1290).                                           [14] H. Kikitsu, J. Kanda, R. Iwasaki, Flow simulation by wind tunnel with
 [9] N.J. Allen, M. Quinn, Development of a transonic gust rig for                 computer-controlled multiple fans. Journal of Wind Engineering and
     simulation of vertical gusts on half-models. In31st AIAA Aerodynamic          Industrial Aerodynamics. 1999 Nov 1;83(1-3):421-9.
     Measurement Technology and Ground Testing Conference 2015 (p.            [15] M. Karsek, F.T. Muijres, C. De Wagter, B.D. Remes, G.C.H.E. De
     2403).                                                                        Croon, A tailless aerial robotic flapper reveals that flies use torque
[10] S. Cao, A. Nishi, H. Kikugawa, Y. Matsuda, Reproduction of wind               coupling in rapid banked turns. Science. 2018 Sep 14;361(6407):1089-
     velocity history in a multiple fan wind tunnel. Journal of wind               94.
     engineering and industrial aerodynamics. 2002 Dec 1;90(12-15):1719-      [16] G.J. Leishman, Principles of helicopter aerodynamics with CD extra.
     29.                                                                           Cambridge university press, 2006
You can also read