Dhauliganga, Uttarakhand, India Coalescent Natural Disaster: A Geoinformatics Perspective
←
→
Page content transcription
If your browser does not render page correctly, please read the page content below
Dhauliganga, Uttarakhand, India Coalescent Natural
Disaster: A Geoinformatics Perspective
Deepti Km. Dwivedi ( dwideepti@gmail.com )
Indian Institute of Technology Roorkee
Ajanta Goswami
Indian Institute of Technology Roorkee
Hardeep Panchal
Indian Institute of Technology Roorkee
J.D. Das
Indian Institute of Technology Roorkee
Arun K. Saraf
Indian Institute of Technology Roorkee
Research Article
Keywords: Coalescent Natural disaster, Spatial Resolution, Remote Sensing, Landslide
Posted Date: May 27th, 2021
DOI: https://doi.org/10.21203/rs.3.rs-531788/v1
License: This work is licensed under a Creative Commons Attribution 4.0 International License.
Read Full License
Page 1/26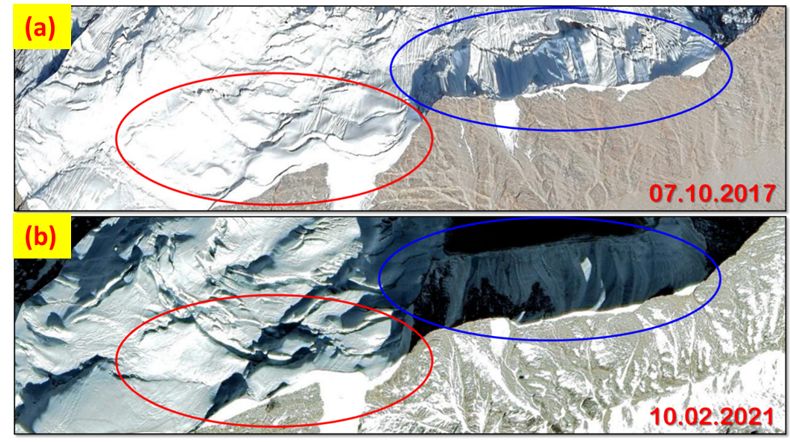
Abstract
On 07 February 2021 around 10:30 hrs local time catastrophic flash flood occurred in the Dhauliganga
River (a tributary of Ganga River) near Rini village at 2000m above msl (mean sea level) (Chamoli
District), which killed 79 people and about 125 people are still missing. Part of the area belongs to Nanda
Devi Biosphere Reserve which is completely protected from human interventions. Further, on Dhauliganga
River, there were two run-of-river hydroelectric power Rishiganga Small Hydro (13.2 MW) at 1975m above
msl and Tapovan Vishnugad (520 MW) at 1795m above msl projects which were also severely damaged
due to the devastating flash flood. More than 150 workers were also trapped in the under construction
power tunnel of Tapovan Vishnugad project. Further, it is important to note that the study area belongs to
highly seismically active region and Zone-V Seismic Zoning Map of India which comes under highly
vulnerable category. During last thirty years the region has also witnessed about 53 earthquakes (within
100km) of magnitude ranging Mw 3.2–6.6. Similarly, landslide hazard zonation map of Uttarakhand also
shows that the study area belongs to very high to severe category. Initial assessment on the day of event
suggested that there was a glacial burst. However, later series of remote sensing images revealed that
initially there was heavy snow fall during 03-05th February 2021 in the region. Later, it has been evaluated
through time series high spatial resolution remote sensing images of various satellites that a large part of
a north facing triangular shaped slope (having about 660m base and about 1100m height, estimated
total volume 18.1 million m3 which includes rocks, snow and ice) at 5540m above msl has failed which
was also supporting a small hanging glacier. This landslide and consequently massive debris flow into
the Raunthi Gadhera initially blocked flow of Dhauliganga near Rini village [at 2000m above msl (mean
sea level)] which later failed around 10:30 hrs on 07 February 2021 and has brought a catastrophic flash
flood in the Dhauliganga river. Further, remote sensing images acquired around 10:33 hrs of 07th February
2021 revealed a large dust cloud which clearly unravels the sequence of events from high-altitude
landslide, collapse of a small hanging glacier, snow avalanche to catastrophic flooding. Even after the
catastrophic flash flood of 07th February 2021, an elongated lake (length about 800m, width at the front
is about 100m and having depth of about 46m including freshly deposited debris and silt of about 10m,
an estimated total volume of water might be ≈ 800000 m3) was created due to blocking of flow of Rishi
Ganga River which still postures flash flood hazard for the downstream areas.

1. Introduction
The Himalayan mountain range and Tibetan plateau have formed as a result of the collision between the
Indian Plate and Eurasian Plate which began about 50 million years ago and still continues. Due to this
collision, the Himalaya is seismically highly active, rugged and fragile mountain system. Further, slopes in
the higher Himalaya are generally very steep and consequently highly prone to landslides, leading to
heavy loss of both life and property. Though there are many other causes of landslides but the steep
slopes of Himalayan mountain is one of the major reasons of frequent landslides. Landslides induced
damming and later flash floods are inevitably disasters in the Himalaya. Changes in surface and
subsurface ice, especially in combination with unfavourable geological conditions, can reduce the

                                                 Page 2/26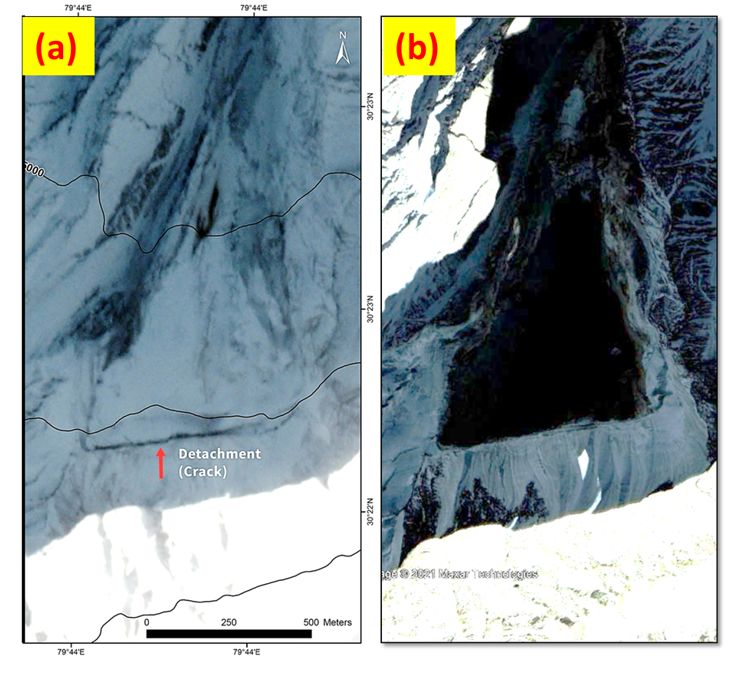
strength of rock and ice and destabilize slopes, thus leading to slope failures such as rock and snow
avalanches (Haeberli et al., 1997; Davies et al., 2001). Observations of such slope failures in mountain
regions suggest that slope stability problems in steep high-mountain faces are of major concern in view
of ongoing climate changes and the hazard potential they possess (Evans & Clague, 1994; Geertsema et
al., 2006; Oppikofer et al., 2008; Allen et al., 2011; Fischer et al., 2012). Sometimes, earthquake induced
damming have also created similar flash floods disasters as happened in Nepal earthquakes of 2015.
Satellites images of recent years (2016-17) have also revealed that there were many such incidences of
slope failures in the Rishiganga valley but went unnoticed because these events did not generate
devastating flash floods.

2. Study Area
Rishiganga valley is located in the Chamoli district, Uttarakhand, India which lies in the central
Himalayas. These young mountains are structurally very fragile and are exposed to the extreme climatic
conditions prevalent in the region. Rishiganga river flows in the valley and it springs from the Uttari
Nanda Devi Glacier on the Nanda Devi mountain. It is also fed from the Dakshini Nanda Devi Glacier.
Continuing through the Nanda Devi National Park, it flows into the Dhauliganga River near the
village Rini. Raunthi Gadhera (Ronti Gad) is tributary of Rishiganga River, which later meets Dhauliganga
River near Rini (Reni) village (Fig. 1). This area falls under the category of severe earthquake zone and
during last thirty years the region has also witnessed about 53 earthquakes (within 100km) of magnitude
ranging Mw 3.2–6.6 (Fig. 2). Similarly, landslide hazard zonation map of Uttarakhand also shows that the
study area belongs to very high to severe category (Fig. 3). Moreover, large part of Rishiganga valley
having very steep slopes and is covered with glacial moraine sediments and therefore due to availability
of abundant loose sediments there are always possibilities of damming of streams and consequently
flash floods in the event of natural dam failure.

3. Datasets Used
Pre- and post-disaster high-resolution satellite datasets used in the present study are from Planet Scope
from PLANET, Indian Remote Sensing Satellite Constellation (Resourcesat-2 and Cartosat2A) from ISRO,
Sentinel-2A from European Space Agency and Pleaides from CNES (Space Agency of France), these are
collected from different sources. Also various images from Google earth are used to access the damage
caused due to flash flood. Precipitation (snow and rain) data from Automatic Weather Station, Tapovan
is obtained to get the details of precipitation of seven days (1st to 7th February 2021). Digital Elevation
model, 12.5m spatial resolution ALOS-PALSAR DEM is used in RAMMS model as well as in the
background of Google Earth for different calculations and estimations.

4. Methodology
High spatial resolution satellites images (Pre-post event) and later Google Earth images are used to
observe the cause of the event and also to see the changes and access the damage caused by the event.
                                                    Page 3/26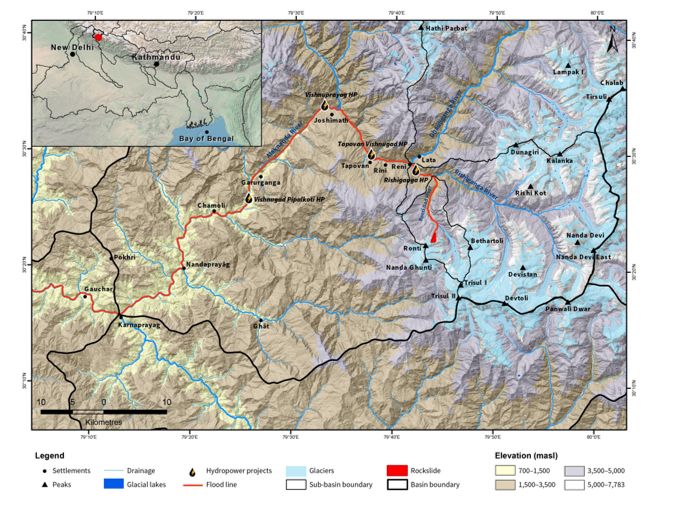
Pseudo Colour Technique is also used to see the changes observed in the affected area. The
conventional PCT technique facilitates the combination of various bands in different colour schemes,
such as RGB, IHS and CMY. However, instead of using the different bands of same date data, an
approach developed by (A.K. Saraf, 1998) has been adopted in the present study to map the landslides /
rockslide induced ground changes using available high resolution pre- and post-event datasets of
Pléiades satellite. Both pre and post-event Pléiades scenes were geo-referenced using an image-to-image
rectification technique. Since the available Pléiades images were in false colour composite (FCC) format
and therefore first splitting of FCCs were done into their original colour components i.e. red, green and
blue (RGB), the pre-event scene is kept in the red channel and the post-event scene in the green and blue
channels. This has provided a change index with red depicting positive change in terms of reflectance
between two dates, blue and green depicting negative change, and black and white depicting no change.
The RAMMS (rapid mass movement simulation) is used to estimate flow depth and flow velocity using
12.5m spatial resolution ALOS-PALSAR DEM.

5. Observations
5.1 Triggering of the Coalescent Natural Disaster

Initially, amid 03-05th February 2021 the Dhauliganga River region received heavy snow fall (Fig. 4) which
overloaded high vulnerable very steep slopes and in the morning of 07 February 2021, a north facing
triangular shaped slope (Figs. 5 and 6) failed which was also supporting a small hanging glacier, this has
been assessed through time series high spatial resolution remote sensing images of various satellites.
This landslide and consequently massive debris flow into the Raunthi Gadhera initially blocked flow of
Dhauliganga near Rini village which later failed around 10:15 hrs (local time) on 07 February 2021 and
has brought a catastrophic flash flood in the Dhauliganga river. It is important to note that there is no
information about the exact timing of triangular shaped slope failure due to lack of availability of regular
time series high spatial resolution satellite images. However, analysis of two images from different
satellites revealed that definitely just before 10:33 hrs. (local time) on 07th February 2021 a huge dust
cloud in the Raunthi Gadhera has been observed and another satellite image of 10:58 hrs. On the same
day that dust cloud has moved towards Rishiganga and Dhauliganga valleys (Fig. 7). In the present
study, it has been further investigated to assess changes occurred before and after the 07th February
2021 flash flood event by employing (i) high resolution images of 06th February 2021 and 07th February
2021 of Pléiades satellite and (ii) a change detection pseudo colour transformation (PCT) technique
developed by (A. Saraf, 1998). Later, the efficacies of the PCT for change detection have been
successfully demonstrated by (A. K. Saraf et al., 2002; Sharma et al., 2018) for the purpose of damage
assessments / change detection. The conventional PCT technique facilitates the combination of various
bands in different colour schemes, such as RGB, IHS and CMY. However, instead of using the different
bands of same date data, an approach developed by (A. Saraf, 1998) has been adopted in the present
study to map the landslides / rockslide induced ground changes using available high resolution pre- and
post-event datasets of Pléiades satellite. Both pre- and post-event Pléiades scenes were georeferenced

                                                  Page 4/26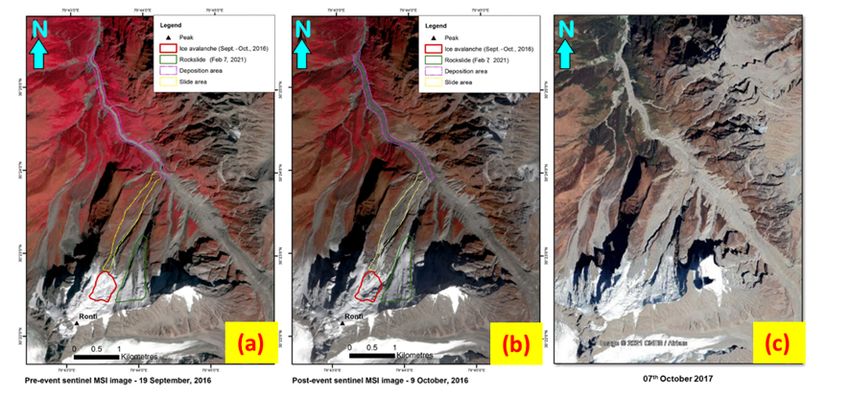
using an image-to-image rectification technique. Since the available Pléiades images were in false colour
composite (FCC) format and therefore first splitting of FCCs were done into their original colour
components i.e. red, green and blue (RGB), the pre-earthquake scene is kept in the red channel and the
post-earthquake scene in the green and blue channels (Fig. 8). This has provided a change index with red
depicting positive change in terms of reflectance between two dates, blue and green depicting negative
change, and black and white depicting no change.

5.2 Area and volume estimation of triangular shaped failed slope

High spatial resolution satellites images and later Google Earth images (including in background digital
elevation model of the same) of Dhauliganga disaster event, it has been possible to estimate the area
and volume of triangular shaped failed slope. Based on various data sets and limited field inputs, the
area of triangle has been estimated equal to about 363000 m2 (considering 660m base and about 1100m
height of the facet). If an average thickness considered to be 50m (maximum being about 150m) (Fig. 9)
thus total estimated volume would be about 18.1 million m3 (which includes rocks, snow and ice) (Fig.
10).

(A. K. Saraf, 2000; A. K. Saraf et al., 2009; Sharma et al., 2018) have evidently demonstrated that there are
generally early signatures of slope failure. Any triggering factor e.g. heavy precipitation, an earthquake,
anthropogenic activities etc. can fail such vulnerable slopes, as happened in the present study area (just
below of Ronti Peak, the origin of Raunthi Gadhera) a triangular shaped slope could not sustain heavy
and swift snow overloading. Time series satellite images undoubtedly depicts that there were early
signature of slope failure (Fig. 11). Comparison of both images [(a) and (b) images of Fig. 11] clearly
establishes the fact of early signs of slope failure. Here it is important that if regular monitoring would
have been employed then perhaps loss of life could have been completely avoided.

5.3 Damage assessment

Rapid and colossal glacial debris flow into the Raunthi Gadhera initially blocked flow of Dhauliganga
near Rini village which later failed around 10:30 hrs (local time) on 07 February 2021 and has brought a
calamitous flash flood in the Dhauliganga river which killed 79 people and about 125 people are still
missing. Due to heavy flow of moraine sediments, both Rishiganga and Dhauliganga rivers were blocked.
However, as clearly evident in post-event satellite images that natural damming at Dhauliganga river near
Rini village which broke around 10:30 hrs on the same day and has caused devastating flash flood in the
Dhauliganga river (Fig. 12). Further, remote sensing images acquired around 10:33 hrs of 07th February
2021 revealed a large dust cloud (Figs. 7 and 8) which clearly unravels the sequence of events from high-
altitude landslide, collapse of a small hanging glacier, snow avalanche to catastrophic flooding. Even
after the catastrophic flash flood of 07th February 2021, an elongated lake (length about 800m, width at
the front is about 100m and having depth of about 46m including freshly deposited debris and silt of
about 10m, an estimated total volume of water might be ≈ 800000 m3) was created due to blocking of
flow of Rishi Ganga River which still postures flash flood hazard for the downstream areas.

                                                   Page 5/26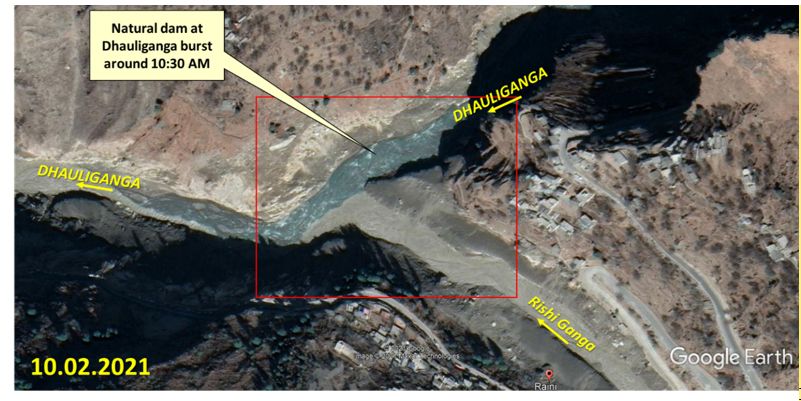
(Sattar, 2021) modelled flow depth and flow velocity with the RAMMS (rapid mass movement
simulation). In this modelling approach total volume of rock and ice has estimated about 25 million m3
involving 12.5m spatial resolution ALOS-PALSAR DEM. This model clearly brings insight about the flow
depth and upslope entry of sediments into Rishiganga and Dhauliganga Rivers which blocked flow of
water and created temporary dams (Fig. 13).

Further, there were two run-of-river hydroelectric power Rishiganga Small Hydro (13.2 MW) at 1975m
above msl and Tapovan Vishnugad (520 MW) at 1795m above msl projects which were also severely
damaged due to the devastating flash flood (Figs. 14, 15 and 16). More than 150 workers were trapped in
the under-construction power tunnel (Fig. 15) of Tapovan Vishnugad project. A visual comparison of
images and field photographs shown in Figs. 14 and 15 emphatically brings the extensive damages
caused by the flash flood which were caused in few minutes. The damage to all kind of structures along
the Rishiganga-Dhauliganga Rivers runs beyond these project sites. In fact, any structure along these
rivers were completely destroyed within few minutes time even beyond Vishnuprayag town.

5.4 Size and volume estimation of Rini newly formed lake

As discussed earlier that immediate consequent of the catastrophic flash flood of 07th February 2021, an
elongated lake has formed due to blocking of flow of Rishiganga River. This water impoundment can be
seen very clearly on the Planet (Skysat-4) satellite image of 23rd February 2021 (Fig. 17) (NRSC, 2021b).

The Planet (Skysat-4) image of 23rd February 2021 (Fig. 17) evidently shows the elongated shape of the
lake. Therefore, it is easy to map the size of lake (length about 880m, width at the front is about 103m).
The average width of the lake can be estimated to about 59m and therefore the area of the lake would be
about 25,000 m2. Further, based on limited field data, the average depth of the lake can be taken about
36m (excluding freshly deposited debris and silt of about 10m), an estimated total volume of water in
lake might be ≈ 900000 m3.

In order to evaluate accurate volume of the lake, freely available ALOS-PALSAR Global DEM of 12.5m
spatial resolution of the area and dam simulation technique in Geographic Information Systems (ArcView
GIS and Profile Extractor extension) have been employed. However, the above analysis does not generate
the same elongated shape of the lake as depicted in the Planet (Skysat-4) image of 23rd February 2021
(Fig. 17). Since the area of study is located in the highly rugged terrain and perhaps input DEM is not
representing the true terrain conditions. Further, it also might be due the shadow conditions of the area
during stereo image acquisition of ALOS-PALSAR. It may be noted that ALOS-PALSAR Global DEM has
been generated using stereo images and photogrammetric techniques. Better and high spatial resolution
DEM in future can bring true shape of the newly formed lake through Dam Simulation technique.

5.5 Past event of September-October 2016 in the area and futuristic scenarios

(Shrestha et al. 2021) have discussed ice avalanche breakoff near to triangular shaped rockslide area of
07th February 2021. September-October 2016 time series images clearly reveals such ice avalanche
                                                 Page 6/26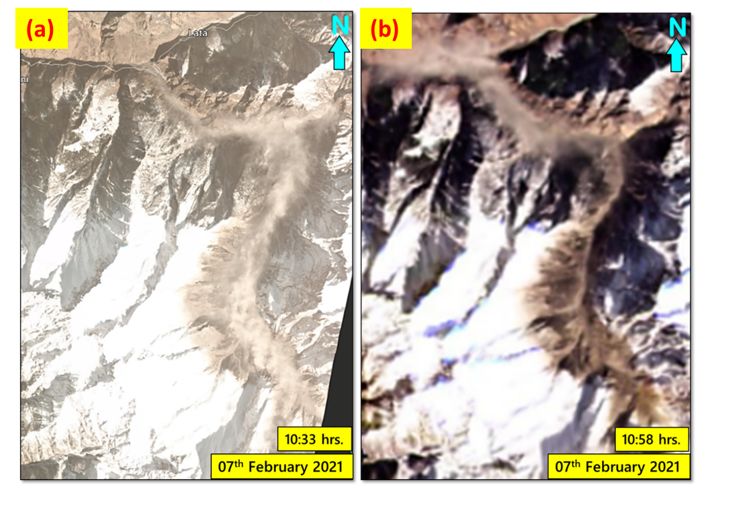
breakoff which brought moraine deposits along Raunthi Gadhera (Fig. 18). Fig. 18(c) image of 07th
October 2017 further conveys evidences of breakoff of ice and rocks and bringing additional sediments
in the Raunthi Gadhera, which visibly specifies that there were continuous such activities in that area.
Later, the same area (just east of September-October 2016 area) (Fig. 18) broke and caused coalescent
natural disaster of 07th February 2021.
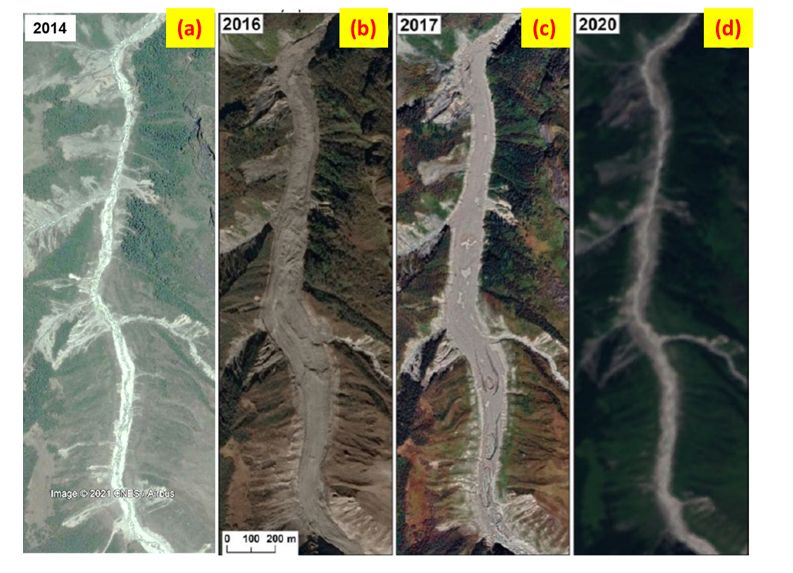
It is stimulating to note that the ice avalanche breakoff / rockslide moraine sediments do not stay long in
the Raunthi Gadhera. Time series images shown by (GAPHAZ, 2021) (Fig. 19) emphatically shows that in
3-4 years’ time, the monsoon rains in the area can flush out such sediments. Such rapid flushing of
sediments from the streams also indicates that the sediments deposited due to the 07th February 2021
events will also flush out soon. However, comparatively the latest event has deposited more sediments
not only in the Raunthi Gadhera, but also in along Rishiganga and Dhauliganga Rivers. Inevitable heavy
rains in the coming Monsoon seasons will be flushing out the newly deposited debris from these streams
which may become source of various other problems in the downstream areas. Further, latest images of
the triangular slope failure area of 07th February 2021 evidently specifies about the future disaster due to
failure of ice covered slopes (Fig. 20). Clear cracks top of ice / snow covered surface indicate about
repeating of such events originating from the same area in future.
6. Conclusions
On 07 February 2021 around 10:30 hrs local time catastrophic flash flood has occurred in the
Dhauliganga River near Rini village, which killed 79 people and 125 people are still missing. The event
was so impulsive and calamitous that it not only caused heavy loss of human lives, but had also torn
human bodies. So far 35 pieces of human bodies have been found in the power tunnel of Tapovan Hydro
Power Project.
Various satellites time series images have not only brought insight about devastating coalescent disaster
of 07th February 2021 in Rishiganga and Dhauliganga Rivers and surroundings but also allowed to
reconstruct the sequence of events. Initially, there was a failure of triangular slope of ice, snow and rocks,
which brought massive moraine sediments in the river valleys. Subsequently, these sediments blocked
the flow of both Rishiganga and Dhauliganga Rivers and created temporary dams. However, due to
relatively heavy discharge in the Dhauliganga River, the natural dam which was created due to deposition
of fresh loose sediments could not sustain long and failed within few minutes. Consequently, this natural
dam failure not only brought flash flood in the downstream areas but also carried heavy load of
sediments, which destroyed two hydropower projects and caused heavy loss to human life.
The present study has once again emphasized the importance of high resolution time series satellites
images and application of GIS to assess the damages and to estimate various parameters associated
with slope failures, lake formation etc. Additionally, the 07th February 2021 event has brought attention to
monitor such vulnerable areas of Himalaya regularly to minimize at least loss of human lives in future.
Availability of relatively high resolution satellites images on systematic basis has now allowed to monitor
Page 7/26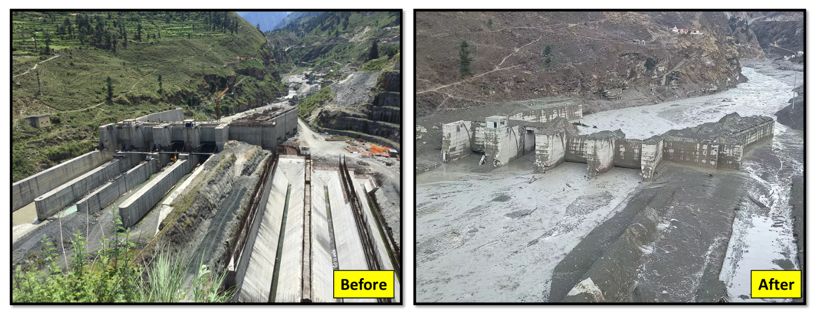
such vulnerable areas. Further, automatic / semi-automatic change detection algorithms / software tools
can be developed to detect even miniscule changes in the vulnerable areas and provide long-term / short-
term forecast of similar events.

Declarations
I confirm that research work presented in manuscript is original, neither the article nor portions of it have
been previously published elsewhere. I have not submitted this manuscript in any journal simultaneously
for the consideration.

I ensure that the named authors have read and approved this manuscript. I also assure that the order in
which all the authors have been listed in the manuscript is accepted by all of us.

I understand that the corresponding author will be the soul contact for the editorial process. The
submission process, revision and the final approval of the manuscript will be communicated periodically
with the other authors by the corresponding author.

Funding

No

Conflicts of interest/Competing interests

I declare that there are no competing interest related to any financial concern with regard to the
publication of study. It is being declared that there are no personal relationships with the people or
organisation that may influence the research work described in this paper.

Availability of data and material

Different sources including web portals

Code availability

No

Ethical Responsibility of Author

Hereby, I Deepti Kumari Dwivedi consciously assure that for the manuscript Dhauliganga, Uttarakhand,
India Coalescent Natural Disaster: A Geoinformatics Perspective, the following is fulfilled:

     This material is my own original work, which has not been previously published elsewhere.
     The paper is not currently being considered for publication elsewhere.
     The paper reflects my own research and analysis in a truthful and complete manner.
     The paper properly credits the meaningful contributions of co-authors and co-researchers.

                                                   Page 8/26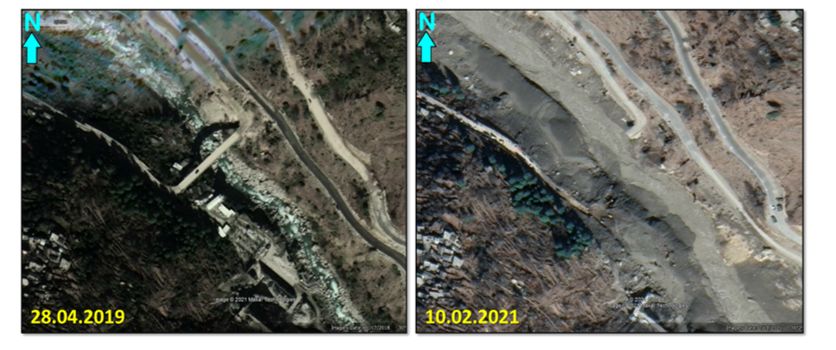
The results are appropriately placed in the context of prior and existing research.
    All sources used are properly disclosed (correct citation). Literally copying of text must be indicated
    as such by using quotation marks and giving proper reference.
    All authors have been personally and actively involved in substantial work leading to the paper, and
    will take public responsibility for its content.
    Acknowledgement

    The note is a voluntary effort of the authors, and it includes their independent opinion other than
    synthesized materials and information, which is gratefully acknowledged. This is a very preliminary
    and brief analysis based on the presentation of available data, images and information. We will do
    more technical analysis in our future endeavours and update our note accordingly.

8. References
1. Allen, S. K., Cox, S. C., & Owens, I. F. (2011). Rock avalanches and other landslides in the central
Southern Alps of New Zealand: A regional study considering possible climate change impacts.
Landslides, 8(1), 33–48. https://doi.org/10.1007/s10346-010-0222-z

2. Davies, M. C. R., Hamza, O., & Harris, C. (2001). The effect of rise in mean annual temperature on the
stability of rock slopes containing ice-filled discontinuities. Permafrost and Periglacial Processes, 12(1),
137–144. https://doi.org/10.1002/ppp.378

3. Evans, S. G., & Clague, J. J. (1994). Recent climatic change and catastrophic geomorphic processes in
mountain environments. Geomorphology, 10(1–4), 107–128. https://doi.org/10.1016/0169-
555X(94)90011-6

4. Fischer, L., Purves, R. S., Huggel, C., Noetzli, J., & Haeberli, W. (2012). On the influence of topographic,
geological and cryospheric factors on rock avalanches and rockfalls in high-mountain areas. Natural
Hazards and Earth System Science, 12(1), 241–254. https://doi.org/10.5194/nhess-12-241-2012

5. GAPHAZ (2021), First insights into the Chamoli disaster, February 7 2021,
http://gaphaz.org/files/210220Update_Chamoli-disaster_20210207_GAPHAZ.pdf.

6. Geertsema, M., Clague, J. J., Schwab, J. W., & Evans, S. G. (2006). An overview of recent large
catastrophic landslides in northern British Columbia, Canada. Engineering Geology, 83(1–3), 120–143.
https://doi.org/10.1016/j.enggeo.2005.06.028

7. Haeberli, W., Wegmann, M., & Mühll, D. V. (1997). Slope stability problems related to glacier shrinkage
and permafrost degradation in the Alps. Eclogae Geologicae Helvetiae, 90(3), 407–414.

8. NRSC. (2021). 3D Rendition of the Suspected Area of Rockslide/Snow Avalanche.
https://www.nrsc.gov.in/sites/default/files/pdf/DMSP/3DViewofSuspectedSiteofRockslide-
Avalanche.pdf
                                                    Page 9/26
9. NRSC, (2021b), Water Impoundment/Lake on Rishi Ganga River near Raini Village,Uttarakhand (Full
lake View)- 23.02.2021, https://www.nrsc.gov.in/sites/default/files/pdf/DMSP/planetemx-23feb-
fulllake.jpg.

10. Oppikofer, T., Jaboyedoff, M., & Keusen, H. R. (2008). Collapse at the eastern Eiger flank in the Swiss
Alps. Nature Geoscience, 1(8), 531–535. https://doi.org/10.1038/ngeo258

11. Pant, V., & Pande, P. R. K. (2012). Disaster Risk Analysis ( DRA ): Case Studies from Pithoragarh. 1(6),
24–26.

12. Saraf, A. (1998). Assessing the causes and damages using remote sensing and GIS techniques.
GIS@Development.

13. Saraf, A., Das, J., & Rawat, V. (2009). Satellite Based Detection of Early Occurring and Co-Seismic
landslides. Journal of South Asia Disaster Studies, 2, 47–55.

14. Saraf, A. K. (2000). Some observations of the Chamoli earthquake-induced damage using ground and
satellite data Author ( s ): I . Sarkar and A . K . Saraf Published by : Current Science Association Stable
URL : https://www.jstor.org/stable/24103854 Some observations of the Ch. 78(1), 91–97.

15. Saraf, A. K., Sinvhal, A., Sinvhal, H., Ghosh, P., & Sarma, B. (2002). Satellite data reveals 26 January
2001 Kutch earthquake-induced ground changes and appearance of water bodies. International Journal
of Remote Sensing, 23(9), 1749–1756. https://doi.org/10.1080/01431160110107824

16. Sattar, A. (2021). First insights into the Chamoli disaster , February 7 2021. 2021, 2–8.

17. Sharma, K., Saraf, A. K., Das, J., Baral, S. S., Borgohain, S., & Singh, G. (2018). Mapping and Change
Detection Study of Nepal-2015 Earthquake Induced Landslides. Journal of the Indian Society of Remote
Sensing, 46(4), 605–615. https://doi.org/10.1007/s12524-017-0720-8

18. Shrestha, A. B., J Steiner, S. Nepal, S. B. Maharjan, M. Jackson, G. Rasul, and B. Bajracharya, (2021),
Understanding the Chamoli flood: Cause, process, impacts, and context of rapid infrastructure
development, https://www.icimod.org/article/understanding-the-chamoli-flood-cause-process-impacts-
and-context-of-rapid-infrastructure-development/ (Accessed on 09th April 2021).

Figures

                                                  Page 10/26
Figure 1
Depicts landslide / rockslide origin and flash flood path along the Raunthi Gadhera, Rishiganga and
Dhauliganga Rivers (Source: Shrestha et. al., 2021). Note: The designations employed and the
presentation of the material on this map do not imply the expression of any opinion whatsoever on the
part of Research Square concerning the legal status of any country, territory, city or area or of its
authorities, or concerning the delimitation of its frontiers or boundaries. This map has been provided by
the authors.
Page 11/26Figure 2
Earthquakes occurred (within 100km) in the region during 1990-2021. Pink coloured filled circle depicts
Chamoli Earthquake of 29 March 1999, 6.6 Mw. Note: The designations employed and the presentation
of the material on this map do not imply the expression of any opinion whatsoever on the part of
Research Square concerning the legal status of any country, territory, city or area or of its authorities, or
concerning the delimitation of its frontiers or boundaries. This map has been provided by the authors.
Page 12/26Figure 3
Landslide Hazard Zonation Map of Uttarakhand (Source: Pant & Pande, 2012). Note: The designations
employed and the presentation of the material on this map do not imply the expression of any opinion
whatsoever on the part of Research Square concerning the legal status of any country, territory, city or
area or of its authorities, or concerning the delimitation of its frontiers or boundaries. This map has been
provided by the authors.
Page 13/26Figure 4
Total precipitation (snow and rain) occurred in the region. Data recorded at Automatic Weather Station,
Tapovan)
Page 14/26Figure 5
Pléiades image of 09th February 2021 [Source: Pléiades images of the Uttarakhand disaster, (2021)]
Page 15/26Figure 6
Three dimensional perspective view of rockslide / landslide area based on Pléiades image of 09th
February 2021 (Source: NRSC, 2021)
Page 16/26Figure 7
Satellites images of 07th February 2021 Left image (a) acquired at 10:33 hrs (local time) and at 10:58 hrs
later right image (b) has been acquired. A comparison between (a) and (b) clearly deciphers the
movement of dust cloud towards downstream valleys which also indicates that perhaps dust particles
were moist and heavy and in the absence of wind settled naturally (Source: Planet, 2021)
Page 17/26Figure 8
Pre-event Pléiades image of 06th February 2021 (a); Pléiades image of 07th February 2021, just after
rockslide event (b); Pseudo Colour Transformed (PCT) image of Band 3 (c) depicts changes (in red
colour) occurred between 06-07th February 2021 images. White areas decipher no changes, Cyan
coloured areas in PCT image (c) are due differential shadows between images (a) and (b). Dust clouds in
(c) along Raunthi Gadhera can be seen very evidently in red colour
Figure 9
Area and volume estimation of triangular shaped failed slope based on analysis of high spatial
resolution 10 February 2021 Pléiades DEM and Copernicus 30m DEM of 2013. Both along slope and
across slope profiles depicts maximum depth about 150m (Source: Pléiades images of the Uttarakhand
disaster, 2021)
Page 18/26Figure 10
Dimensions of triangular shaped failed slope as estimated employing Google Earth datasets (both high
resolution image and digital elevation model in the background). Across slope topographic profile (red
coloured line with 660m width as annotation). The topographic profile (bottom figure) depicts depth of
the failed slope before the event
Page 19/26Figure 11
Sentinel-2A image of 06th February 2021 (a) Google Earth image of 10th February 2021 (b) Evidently a
detachment crack can be seen in the left image (marked with red arrow), just one day before the event.
Further, thick snow on 6th February can also been seen in image (a) Comparison of both the images
clearly demonstrates once again that there are early signatures of slope failure.
Page 20/26Figure 12
Google Earth image of 10th February 2021 brings remnant of broken natural dam which can be realized
clearly across Dhauliganga River. As can be seen that heavy and abrupt moraine sediments (initially
Rishiganga brought dark grey sediments as can been seen on both banks of Rishiganga River and later it
brought light grey sediments) were brought by the Rishiganga which initially blocked the flow of
Dhauliganga. However, due to heavy flow in the Rishiganga the temporary natural dam could not sustain
and has broken quickly causing devastating flash flood in the downstream stretch of Rishiganga. Note:
The designations employed and the presentation of the material on this map do not imply the expression
of any opinion whatsoever on the part of Research Square concerning the legal status of any country,
territory, city or area or of its authorities, or concerning the delimitation of its frontiers or boundaries. This
map has been provided by the authors.
Page 21/26Figure 13
Reconstruction of flow depth and flow velocity with the RAMMS model, for an assumed 25 million m3 (20
million m3 of rock and 5 million m3 of ice) rock and ice avalanche (Source: Sattar, 2021). Note: The
designations employed and the presentation of the material on this map do not imply the expression of
any opinion whatsoever on the part of Research Square concerning the legal status of any country,
territory, city or area or of its authorities, or concerning the delimitation of its frontiers or boundaries. This
map has been provided by the authors.
Figure 14
Page 22/26Pre- and post-event Google Earth images of Rishiganga Hydro Power Project (13.2 MW) clearly shows
complete washout of the operational hydro power project due to devastating flash flood of 07th February
2021. Note: The designations employed and the presentation of the material on this map do not imply the
expression of any opinion whatsoever on the part of Research Square concerning the legal status of any
country, territory, city or area or of its authorities, or concerning the delimitation of its frontiers or
boundaries. This map has been provided by the authors.
Figure 15
Pre- and post-event Google Earth images of Tapovan Vishnugad Hydro Power Project (520 MW) clearly
shows severe damage of under construction hydro power project due to devastating flash flood of 07th
February 2021. Note: The designations employed and the presentation of the material on this map do not
imply the expression of any opinion whatsoever on the part of Research Square concerning the legal
status of any country, territory, city or area or of its authorities, or concerning the delimitation of its
frontiers or boundaries. This map has been provided by the authors.
Figure 16
Page 23/26Before and after flash flood conditions of Tapovan Vishnugad Hydro Power Project (520 MW) of clearly
shows severe damage of under construction hydro power project due to devastating flash flood of 07th
February 2021 (Source: Before
http://webtag.ae/rithwik/view/front/modules_/portfolio/data/27/hURCWLUssu3q.JPG After -
https://static.toiimg.com/thumb/msid-80738861,width-1200,height-900,resizemode-4/.jpg)
Figure 17
Planet (Skysat-4) image of 23rd February 2021 depicts newly formed lake on Rishiganga River near Rini
Village (NRSC, 2021b). Large and sudden supply of moraine debris due to rockslide / landslide blocked
Rishiganga River on 07th February 2021. It is important to note that the lake was formed on 07th
February 2021 during the flash flood event, however, due to complete shadow conditions in the area, the
lake was not clearly seen till 23rd February 2021 (Source: NRSC, 2021b)
Figure 18
Page 24/26The ice avalanche breakoff between 19th September and 9th October 2016 (solid red outline) with the
area covered by resulting moraine deposits along the Raunthi Gadhera (dotted pink line) and flow surface
(dotted yellow line). The green outline shows the present rockslide scarp (after Shrestha et al., 2021).
Image (c) of 07th October 2017 further reveals that there were continuous activities of breaking off of
rocks and additional deposition of sediments in the Raunthi Gadhera valley (Source: Shrestha et al. 2021
)
Figure 19
Moraine deposits of the September-October 2016 ice avalanche from the neighbouring glacier. The 2020
pre 07th February 2021 event Sentinel-2 image (d) indicates normal flow of the river, similar to Google
Earth image of 2014 (a). The debris-covered ice, visible in the (b) and central panel (c) from 2016 and
2017, seems to have disappeared in the year 2020, much before the 2021 avalanche (GAPAZ, 2021).
Note: The designations employed and the presentation of the material on this map do not imply the
expression of any opinion whatsoever on the part of Research Square concerning the legal status of any
country, territory, city or area or of its authorities, or concerning the delimitation of its frontiers or
boundaries. This map has been provided by the authors.
Page 25/26Figure 20
Google Earth images of 07th October 2017 (a) and 10th February 2021 (b). Developments of cracks can
be seen (blue ellipse) emphatically indicating imminent possibilities of slope failures which has really
happened on 07th February 2021 (also seen in Fig. 11). The red ellipse are now indicating about future
slope failures which may be triggered due to heavy snow / rains as happened in the neighbouring areas
during February 2021 which brought devastating coalescent disaster in the downstream areas. Note: The
designations employed and the presentation of the material on this map do not imply the expression of
any opinion whatsoever on the part of Research Square concerning the legal status of any country,
territory, city or area or of its authorities, or concerning the delimitation of its frontiers or boundaries. This
map has been provided by the authors.
Page 26/26You can also read