SITETRENDS WAR FOR TALENT - WHERE THE WORKFORCE & JOBS LIVE - Hickey & Associates
←
→
Page content transcription
If your browser does not render page correctly, please read the page content below

SITETRENDS

WA R F O R TA L E N T
WHERE THE WORKFORCE & JOBS LIVE
           JULY 2017
CONTENTS   3    introduction

           4    war for talent

           5    defining generations

           6    united states domestic perspectives

           10   united states perspectives in leading markets

           16   global perspectives

           17   global populations

           21   global workforce

       22       global employment

       24       global unemployment

       25       about h& a
INTRODUCTION

The “War for Talent” is a phrase commonly used to describe competition among businesses for quality and
affordable labor. First used in the 1990s, the phrase became relevant as the United States shifted its economic
focus from the Baby Boomer generation to Generation X, and as business leaders increasingly became aware
of the link between talent attraction and competitiveness. Although this initial shift was characterized by the
demographic change which accompanied the transition away from the larger Boomer population (who had long
defined the consumer economy), the challenge associated with attracting the qualified and affordable labor
necessary to sustain the consumer economy persists, even as the smaller Generation X now begins to give way
to an even larger generation – the Millennials.

Twenty years have passed since the phrase War for Talent was coined, and with the passage of time, perspective
has provided additional insight. The workforce has changed; people aren’t retiring with the same firm where
they began their careers—a trend that has certainly accelerated over the past decade.

                                           BUSINESS CHANGED
Brick and mortar retail is in decline while online purchasing is giving rise to warehouse development. Fresh
outlooks are needed to transition to a new normal. Certain international trends also parallel and influence the
quest for talent. Offshoring and outsourcing play a significant role in local employment trends, requiring workers
to have strong talent to differentiate themselves from others.

The world is becoming a much closer-knit environment of cause and effect, especially as supply chains for
goods are optimized and service economies are expanding to new markets where digital products are not
limited by transportation costs.

SITETRENDS: WAR FOR TALENT - JULY 2017                                                                        3
© 2017 Hickey & Associates. All Rights Reserved.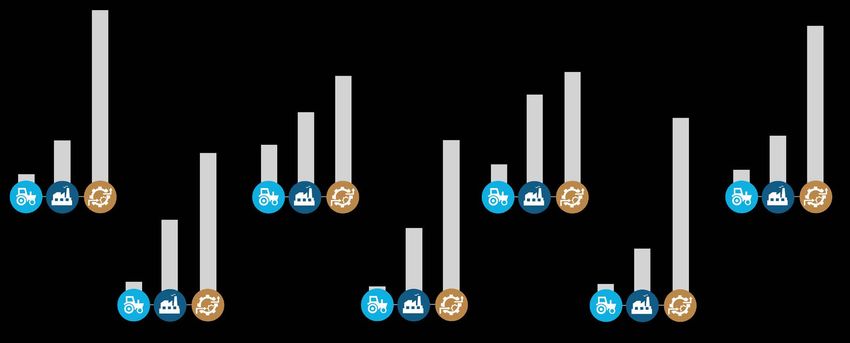
WAR FOR TALENT

The War for Talent is driven by population shifts. In        retire in millions every year. Over time, technological
the United States, a predictable population cycle has        innovations allowed the cycle of larger followed by
emerged over the past century. This cycle tends to           smaller populations to accommodate sustainable
run in 20-30 year periods in which larger population         replacement of this workforce.
cohorts are followed by smaller generations.
                                                             However, as the Boomers now move into retirement,
At the dawn of the 20 century the population of the
                               th
                                                             members of Generation X are positioned to move into
United States grew rapidly, first fueled by immigration      the middle and upper stages of their careers at just
and then as a result of people delaying the start of their   the right time to capitalize on natural winnowing of
families due primarily to the Great Depression and           professional experience. This means that leadership
the Second World War. People born between 1905               positions filled over the next ten years can uniquely
and 1925 grew up during a period of unprecedented            accommodate Generation X.
immigration. They came of age at a time when jobs
were initially very difficult to find and later when the     In parallel with this transition is the entry of the Millennial
consumer economy was secondarily stunted by war.             population into the workforce. Millennials, generally
                                                             in their early 20s to mid-30s, now represent a larger
The post-war setting allowed Americans to finally            population than the Boomers preceding them. While
start a family and settle down into long term career         there is clear evidence that this second population
employment. At this time, the population of the United       boom will mirror demands that Boomers put on the
States grew quickly and thus created the Baby Boom           consumer economy (more people will eventually need
generation, a group which subsequently created a             more products), some things have changed. The
new consumer economy for all sorts of items: apparel         service sector replaced manufacturing during the
(the birth of style), recorded music (the Beatles), cars,    coming of age of Boomers and the rise of Millennials.
suburban housing, and products were all needed               Information, in addition to products, is driving the
or demanded by a generation larger than any in the           market. Products are now manufactured in other
history of the United States.                                countries, necessitating global supply chains driven
                                                             by data-heavy logistics, further perpetuating data
Yet, this growth didn’t continue forever. The smaller        analytics services. Today’s global population wants
Generation X that followed the Boomers may have              goods manufactured in China to be as accessible to
caused the consumer economy to slow without                  them as they were when the consumer could have
productivity innovations, such as computer technology        bought the good locally.
and the internet, which allowed fewer people to do
more with fewer resources. For a while, the sheer
number of Boomers in the workforce offset the drop
in numbers of the next generation. Today, Boomers

SITETRENDS: WAR FOR TALENT - JULY 2017                                                                                  4
© 2017 Hickey & Associates. All Rights Reserved.
DEFINING GENERATIONS

                                                   FIG. 1: DESCRIPTIONS OF GENERATIONS

                                                         1905-1925
                                    1945-1965               GREATEST/GI
                                                                               1925-1945
                                    (BABY) BOOMERS                                SILENT GEN

                                  1985-2005                                       1965-1985
                                      MILLENNIALS
                                                         2005-2025                       GEN X
                                                                 GEN Z

Future population projections indicate a second                      of three generations in their workforce to be a
population contraction: Generation Z. Generation Z                   sustainable model. This allows for seasoned leadership,
ranges from children born today up to high school                    mentoring, and on-boarding to happen in predictable
students. Trends in employment similarities between                  cycles with the potential for career tracks to naturally
Boomers and Millennials can also be linked to                        develop, thus promoting an environment suitable to a
Generation X and Generation Z. Thus, five predictable                meritocracy and predictable turnover.
population cycles can be shown over the past 100
years in the United States, and while challenges exist in            This analysis will compare the populations in key world
finding appropriate talent in today’s workforce, these               markets before examining specific job trends in the
challenges have distinct benefits for the United States              United States. To demonstrate the broad impact of
economy.                                                             the War for Talent, we examine key regional global
                                                                     economies. For this paper, China and India will
Figure 1 outlines the generational trends in the United              represent Asia, Mexico and Brazil will represent Latin
States. Many businesses employ multi-generational                    America, and Germany and the United Kingdom will
workforces and find deploying significant proportions                represent Europe.

SITETRENDS: WAR FOR TALENT - JULY 2017                                                                                   5
© 2017 Hickey & Associates. All Rights Reserved.
UNITED STATES PERSPECTIVES
DOMESTIC

This report examines certain key occupations and their
relationship to all other jobs in the United States. Past
employment trends have been forecasted to 2021 to
model expected wage inflation and job growth and
contrast this future five-year period with prior growth.
Occupations were selected in order to represent key parts
of the economy. These occupations include:

      •    All United States Jobs                  •   Financial Clerks
                                                       (Financial Sector)
      •    Business Jobs
                                                   •   Customer Service Jobs
      •    Software Developers                         (Services Sector)
           (Information Technology
           Sector)                                 •   Team Assemblers
                                                       (Manufacturing and Production
      •    Retail Workers                              Sector)
           (Retail Sector)
                                                   •   Material Movers
      •    Administrative Jobs                         (Transportation and
           (Services and Support Sector)               Warehousing Sector)

SITETRENDS: WAR FOR TALENT - JULY 2017                                                 6
© 2017 Hickey & Associates. All Rights Reserved.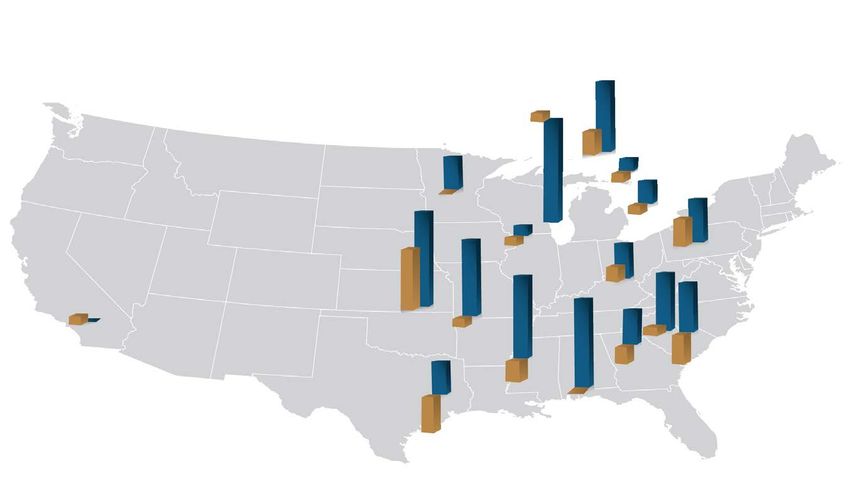
UNITED STATES PERSPECTIVES
DOMESTIC
Wage inflation for targeted jobs shows growth in all sectors except team assemblers
(production), which is flat, and retail sales, in which there is a decline corresponding
to incremental gains for material movers (Figure 2). Wage inflation in IT will continue
to outpace many other jobs as the demand for software developers continues to
increase at record pace, both in the United States and abroad.

                                                        FIG. 2: RATE OF WAGE INFLATION

                                                                  13%
                                      7%

                                 7%

                                                            11%
                 Δ 2012-2016         ALL
                 Δ 2016-2021        JOBS
                                                                                                           10%

                                                                                                      9%
                                                                                   9%          9%
                                                                                          9%                     9% 9%
                               8%                                             8%

      7%
           7%             6%
                                                   6%
                                            5.4%

    RETAIL             BUSINESS            CUSTOMER       SOFTWARE           ADMIN       MATERIAL   FINANCIAL    TEAM
   WORKERS               JOBS               SERVICE      DEVELOPERS           JOBS       MOVERS       CLERKS  ASSEMBLERS

SITETRENDS: WAR FOR TALENT - JULY 2017                                                                                   7
© 2017 Hickey & Associates. All Rights Reserved.
DOMESTIC PERSPECTIVES CONTINUED

Wage growth for software developers is partially caused by the lack of available
labor, which will not be able to keep pace with demand (Figure 3). High growth
customer service and material mover jobs are evidence of a growing service sector
and a consumer economy driven by online purchasing.

                                                            FIG. 3: JOB GROWTH

                                                            35%

                                     9%                           33%
                                8%

                 Δ 2012-2016     ALL
                                JOBS                                                        22%
                 Δ 2016-2021
                                                                                      21%
                                                    19%
                                              18%

                               14%
                         13%                                                                                        14%

                                                                                                              11%
           7%
                                                                                 4
                                                                                 %
                                                                            3%
     4%

    RETAIL              BUSINESS           CUSTOMER        SOFTWARE         ADMIN    MATERIAL     FINANCIAL    TEAM
   WORKERS                JOBS              SERVICE       DEVELOPERS         JOBS    MOVERS         CLERKS  ASSEMBLERS

                                                                                                    -2% -3%

SITETRENDS: WAR FOR TALENT - JULY 2017                                                                                    8
© 2017 Hickey & Associates. All Rights Reserved.
DOMESTIC PERSPECTIVES CONTINUED

Nationally, business jobs, software developers, customer service, and material mover jobs are all increasing the
number of available jobs in relation to all other jobs over the next five years (Figure 4). Team assembler jobs are
expected to double their proportional representation in the market, meaning some metropolitan areas may
become increasingly manufacturing based.

Conversely, retail jobs are expected to continue to decrease in numbers as buyers continue to flock to the
virtual marketplace. Administrative jobs and financial clerks may be experiencing a reduction due to changes in
computer utility, shifting these jobs to other specialists and using software to aid in tasking.
                                     FIG. 4: GROWTH IN THE PROPORTION OF TARGETED JOBS COMPARED TO ALL JOBS

                                                                26% 26
                                                                      %

            Δ 2012-2016
            Δ 2016-2021
                                                                                                  13%

                                                                                             12
                                                                                              %
                                                        11%
                                                   9%

                           5%   6%
                                                                                                                                6%

                                                                                                                           3%

    RETAIL                BUSINESS          CUSTOMER           SOFTWARE       ADMIN        MATERIAL      FINANCIAL    TEAM
   WORKERS                  JOBS             SERVICE          DEVELOPERS       JOBS        MOVERS          CLERKS  ASSEMBLERS

             -2%
      -3%

                                                                               -4%
                                                                                     -6%

                                                                                                              -9%

                                                                                                                    -13%
SITETRENDS: WAR FOR TALENT - JULY 2017                                                                                               9
© 2017 Hickey & Associates. All Rights Reserved.
UNITED STATES PERSPECTIVES
IN LEADING AND GROWING
LOCAL MARKETS

At the end of the day, the War for Talent will take place at
the local level. Local employment trends in leading and
emerging markets across the United States were captured
and summarized to understand cost and availability over
the next five years in those key cities. The intersection
of high job growth and low wage inflation within a local
market is valuable information, as is the opposite. This
analysis helps to describe short and mid-term changes in
leading and emerging job markets in the United States.

SITETRENDS: WAR FOR TALENT - JULY 2017                         10
© 2017 Hickey & Associates. All Rights Reserved.
FIG. 5: [SOFTWARE ENGINEERS/DEVELOPERS] ANNUAL JOB & WAGE GROWTH, 2016-2021
4%
4% 10%
9% 10%
10%
TRENTON
SEATTLE
11% NEW YORK
CITY 1%
1%
1%
2% 12 % BOSTON
3% 3 4
% %
1% 1% 2% 3% 1% -1%
3% 3%
D.C.
SAN MADISON
FRANCISCO 7% 4%
CHICAGO 4%
4% -2 %
4% BOULDER DENVER 0%
SAN 3%
JOSE 0% 5
% 2
%
1 BALTIMORE
%
3% CHAPEL RALEIGH
LOS HILL
ANGELES
ATLANTA
HUNTSVILLE
DALLAS
Job Growth Wage Growth
Software engineer/developer jobs (one of the most sought-after industries) are expected to grow by 10% through
2021 in traditional West Coast markets and Greater New York (Figure 5). Atlanta, which is a large market, is
expected to continue growing with more modest wage inflation than expected in top tier markets. Madison
is expected to grow rapidly, while wages remain flat—likely as a result of growth in small and mid-sized firms.
The market forces driving Madison’s rapid growth may lead to challenges for companies that don’t already
have expansion plans underway there currently. Economic Developers will need to develop policies to continue
growing, and ensure that wages remain competitive and the market remains unsaturated.
The proportion of jobs compared to the entire job market in these local areas gives some perspective on
specialization (Figure 6). Markets supporting over 30 software development jobs per 1000 total local market jobs
may be considered specialized. San Jose, San Francisco, and Seattle can thus be considered specialized markets.
New York City, however, has fewer of these jobs in proportion to all other jobs due to its diverse economy. The
larger volume of total jobs in New York accounts for the ability to add new software engineer jobs at the same
pace as Silicon Valley. Specialization is also occurring in Trenton and Madison, following overall job growth trends.
FIG. 6: NUMBER OF SOFTWARE DEVELOPERS PER 1000 TOTAL IN MARKET JOBS
61
2016 2021
40 39
32 32
24 28 29
25 26
20 20
17
14 14 16 13
12 13
12 11 12 11 12
9 9 9 9 10
6 5 6
4 3
NEW SEATTLE SAN D.C. SAN ATLANTA BOSTON DALLAS CHICAGO LOS BOULDER TRENTON MADISON RALEIGH CHAPEL BALTIMORE DENVER HUNTSVILLE
YORK JOSE FRANCISCO ANGELES HILL
SITETRENDS: WAR FOR TALENT - JULY 2017 11
© 2017 Hickey & Associates. All Rights Reserved.FIG. 7: [WAREHOUSE LABOR] ANNUAL JOB & WAGE GROWTH, 2016-2021
11%
1% NEW YORK
CITY
4% 1% 2%
10% 3%
3%
0% -2%
ROCKFORD INDIANAPOLIS
4% CHICAGO LEBANON
4% 3%
2%
2% 2% 10
%
2%
LOS 1%
ANGELES RIVERSIDE 3%
MEMPHIS -1%
PHOENIX -1% DALTON -3%
ATLANTA SAVANNAH
DALLAS 0 %
3%
HOUSTON
-4%
Job Growth Wage Growth
Warehouse laborers and material mover jobs are growing rapidly to support online purchases (Figure 7). These
jobs are primarily located at the fringes of urban areas, but have recently been pushed into the urban core in an
effort to achieve same day shipping. Wages for these positions are expected to remain somewhat flat despite
this growth.
FIG. 8: NUMBER OF WAREHOUSE WORKERS PER 1000 TOTAL IN MARKET JOBS
84
2016 2021 67
60
40 41 39 38 37
34 35 35 32
30
26 23 27 26
23 23
16 19 17 20
13 15
8
NEW LOS CHICAGO ATLANTA RIVERSIDE DALLAS HOUSTON MEMPHIS PHOENIX SAVANNAH DALTON LEBANON ROCKFORD
YORK ANGELES INDIANAPOLOIS
Already warehousing heavy, California’s Inland Empire (Figure 8, Riverside) is expected to become hyper-
specialized in the transportation sector, and by 2021 nearly one in ten jobs in Memphis will be in a warehouse.
SITETRENDS: WAR FOR TALENT - JULY 2017 12
© 2017 Hickey & Associates. All Rights Reserved.FIG. 9: [CUSTOMER SERVICE REPRESENTATIVES] ANNUAL JOB & WAGE GROWTH, 2016-2021
5% 11%
3% 8% 5%
2%
3%
2% NEW YORK
1% CITY %
3% 1
MINNEAPOLIS
BOISE 0%
SALT
LAKE CITY CHICAGO
8% PROVO
0% 6
%
1% 0% 2%
1% 5% JOHNSON
5%
LOS 2%
-4%
ANGELES 0 %
PHOENIX
3%
3%
ATLANTA
DALLAS 1%
1%
HOUSTON
TAMPA
FT. LAUDERDALE
Job Growth Wage Growth
Customer service jobs have been re-shoring, a trend that may continue to drive growth in less traditional US
markets such as Johnson, TN (Figures 9-10) where the volume of new jobs are helping to drive costs down.
Phoenix and Provo, UT will also remain as job creators, but maintain low wage growth.
FIG. 10: NUMBER OF CUSTOMER SERVICE JOBS PER 1000 TOTAL IN MARKET JOBS
2016 2021 37
54
49
48
41 26
39 39 26
35 39
36 26
39
32
27 26 27
25
23 22 23
21
19
16
13
12
NEW CHICAGO PHOENIX ATLANTA DALLAS LOS HOUSTON TAMPA PROVO SALT JOHNSON BOISE FT.
YORK ANGELES MINNEAPOLIS LAKE LAUDERDALE
SITETRENDS: WAR FOR TALENT - JULY 2017 13
© 2017 Hickey & Associates. All Rights Reserved.FIG.11: [PRODUCTION ASSEMBLY] ANNUAL JOB & WAGE GROWTH, 2016-2021
11%
1% -15% BATTLE CREEK
3%
CHICAGO
4% 1%
MINNEAPOLIS -1% 3%
0% WARREN
ROCKFORD
-1%
13% 3%
-1% 1% 5%
10 % DETROIT
8 % ELIZABETHTOWN
4% 8% GREENVILLE
11% 2%
ELKHART
LOUISVILLE 6%
0% 1% 11%
1%
5%
LOS COLUMBUS SPARTANBURG
ANGELES 1% -4%
4% -3% -2%
LAFAYETTE ATLANTA
0%
-4% NASHVILLE TUSCALOOSA
Job Growth Wage Growth
Ohio, Indiana, and Michigan may grow production jobs by 2021—with increased competition in Elkhart and
northern Indiana, both are attractive enough to also see wages climb higher than other leading and emerging
markets (Figure 11). Production jobs in Chicago will continue their steady decline as they are overshadowed by
other sectors of the economy (Figure 12).
FIG. 12: NUMBER OF PRODUCTION ASSEMBLY JOBS PER 1000 TOTAL IN MARKET JOBS
220
2016 2021
132
118
100
89
76 71
67 60 66 66
57 57 57
35 43 49 43
30 33 23 25 29
19 18
10 11 6 1 5 8 9
ATLANTA WARREN CHICAGO LOS DETROIT NASHVILLE ELKHART COLUMBUS BATTLE LAFAYETTE TUSCALOOSA LOUISVILLE MINNEAPOLIS
ANGELES GREENVILLE CREEK SPARTANBURG ELIZABETHTOWN ROCKFORD
SITETRENDS: WAR FOR TALENT - JULY 2017 14
© 2017 Hickey & Associates. All Rights Reserved.CONCLUSION
The War for Talent is taking place at the local level, operations remain at full capacity. During the global
but significant opportunity remains for companies economic crisis of 2008-2010, warehouse employment
seeking to diversify their workforces by partitioning benefited from supplies of production labor as
specializations into smaller functional groups and manufacturing slowed. Over the next five years,
co-locating those groups in growing and emerging manufacturing is expected to continue a recovery
markets. These smaller functional groups have the cycle and with the growth of online retail, many
ability to grow organically in smaller markets without traditional warehouse markets may be stressed for
overly stressing saturation levels. Diversification can labor. Convincing former retail workers to move from
also leverage job training funds and development client facing stores to warehouses may be possible for
incentives to help offset costs. only a portion of retail workers.
Certain jobs, such as software engineers, may be filled The hunt for top talent may ease if unemployment
by opening offices in university towns like Madison, rises, but at the moment, the United States and
Wisconsin, where those positions are expected to global unemployment rates are at historic lows.
grow. These jobs are uniquely adept at adopting Harnessing the power of this talent is crucial to
remote work environments and work-from-home firm competitiveness and expansion. The world is
policies, so they might be closely linked to offices in becoming more interrelated with companies seeking
more traditional markets through use of technology. to distribute goods and services into new markets
Technology may also facilitate growth in customer every day. Overall, moves to leverage international
service positions for similar reasons. and local opportunities have been successful and have
had a significant impact on business growth both in
Transportation and production jobs, however, will the United States and abroad.
continue to be facility-based. However, these sectors
expect slower job growth over the next five years
in most markets. Retention of the most productive
employees will be critical in ensuring these manual
SITETRENDS: WAR FOR TALENT - JULY 2017 15
© 2017 Hickey & Associates. All Rights Reserved.GLOBAL POPULATIONS
CHINA 2017
100+
95-99
Figure 13 shows the population of the United States as 90-94
85-89
represented by a population pyramid. Noted on the pyramid 80-84
75-79
are the associated generations described in Figure 1. The 70-74
cyclical trend population growth and decline is evident in 65-69
60-64
BOOMERS
this 100-year population pyramid. 55-59
50-54
45-49
Alternatively, China’s generational sizes appear heavily 40-44
35-39
exaggerated, a result of the One-Child policy in which the 30-34 MILLENNIALS
25-29
government regulated the number of children born to each 20-24
family. The aging of China’s population is evident and it 15-19
10-14
remains to be seen what effect this policy will have on the 5-9
future workforce of China. 0-4
6% 0% 0% 6%
India’s population tends to be younger, but it is clear that its GERMANY 2017
growth reversed sometime around 2000. India’s population 95-99
90-94
pyramid mirrors the United States of 60 years ago. 85-89
80-84
75-79
70-74
FIG. 13: POPULATION PYRAMID - UNITED STATES 2017 65-69 BOOMERS
60-64
95-99 55-59
50-54
90-94 45-49
40-44
85-89 35-39
30-34 MILLENNIALS
80-84 25-29
SILENT GEN 20-24
75-79 15-19
10-14
70-74
5-9
65-69 BOOMERS 0-4
60-64 6% 0% 0% 6%
55-59 INDIA 2017
45-49 90-94
85-89
50-54 80-84
GEN X 75-79
40-44
70-74
35-39 65-69 BOOMERS
60-64
30-34 MILLENNIALS 55-59
50-54
25-29
F E MA L E
45-49
40-44
20-24 35-39
30-34 MILLENNIALS
15-19
MAL E
25-29
10-14 20-24
15-19
GEN Z 5-9 10-14
5-9
0-4 0-4
6% 0% 0% 6% 6% 0% 0% 6%
SITETRENDS: WAR FOR TALENT - JULY 2017 16
© 2017 Hickey & Associates. All Rights Reserved.POPULATION PROJECTIONS
FIG. 6: ESTIMATED POPULATION PROJECTIONS
2017
324,118,787*
*US Population, 2017
1950 1970 1990 2010 2030 2050 2070 2090 2100
GERMANY CHINA INDIA
UNITED STATES
UNITED KINGDOM BRAZIL MEXICO
What will happen to these Asian economies remains Germany has seen its population plateau over the
to be seen. Will populations stabilize and become past 50 years due to falling birth rates, a development
cyclical like the United States, or will populations German policy makers have attempted to slow through
decline dramatically over the next 100 years, putting increased immigration. Similar to China, Germany has
the spotlight back on the United States’ labour? experienced broad generational population swings.
Population projections (Figure 6) suggest the United Comparatively, the United Kingdom more closely
States’ population will continue to grow while other resembles the United States (in terms of population
economies shrink, even though their total numbers of trends) due to higher birth rates, liberal immigration
people overshadow the United States. policies, cyclical generation trends and population
growth projected for the next century.
The population pyramid for Germany still shows
the effects of WWII as women over 80 significantly
outnumber men, due to the many casualties of war.
SITETRENDS: WAR FOR TALENT - JULY 2017 17
© 2017 Hickey & Associates. All Rights Reserved.GLOBAL POPULATIONS
BIRTHRATES
FIG 14: DECLINING BIRTH RATES
7
6
5
4
3
2
1
0
1960 1970 1980 1990 2000 2010 2015 2020
GERMANY CHINA INDIA
UNITED STATES
UNITED KINGDOM BRAZIL MEXICO
Latin American countries also project slower growth woman. The disparity between birth rates in the
over the next 100 years. Figure 14 shows birth rates world’s leading economies and those of developing
in these key economies from 1960 projected to 2020. countries in 1960 overwhelmingly shrank over the
There is no disputing that growth has slowed in every next 50 years. Predictably strong declines in India,
case. From a high of nearly seven births per woman Brazil, and Mexico foreshadow future limitations on
in Mexico in 1960, nearly every country will be at or the workforces of those countries beginning in 15 to
below the replacement value of 2 (children) in 2020. 20 years.
When reviewing birth rates in the United States, Declining birth rates may tighten labor markets in
effects of the Baby Boom generation tapering off can countries we see today as expanding markets, placing
be seen as birth rates fell from 3.5 in 1960 to under two extra strain on developing countries that will need
in 1980. Since 1980, birth rates in the United States to continue growing their economies with smaller
have weaved a trend around 2 from 1980 to 2015, workforces. As current workers age, these economies
demarking the smaller Generation Z more recently. must invest in education, expand their service
The United States’ trend since 1970 is mirrored by sectors, and utilization of technology, and transition
similar birth rates in the United Kingdom, hovering agricultural workers to manufacturing.
around the replacement value of two children per
SITETRENDS: WAR FOR TALENT - JULY 2017 18
© 2017 Hickey & Associates. All Rights Reserved.GLOBAL POPULATIONS
MIGRATION’S EFFECT ON LABOR
FIG. 16: NET MIGRATION AS A PERCENTAGE OF LABOR FORCE
10.0%
Migration (Figure 16) to the United States
has been a consistent workforce supply, 8.0%
outpacing other targeted countries and
representing 4% of the United States’ 6.0%
workforce annually on average for the past
30 years. Countries, such as Germany, have 4.0%
attempted to foster welcoming immigration
2.0%
policies, but changing policy landscapes
may limit future growth both in the United 0.0%
States and other countries. 1987 1992 1997 2002 2007 2012 2016 2018 2020
-2.0%
Numbers and proportions of working age
-4.0%
populations are shown in Figure 17. India
and Mexico’s younger demographic is clear, -6.0%
as is the older population in Germany. The
sheer volume of China (806 million) and -8.0%
GERMANY
India’s (514 million) workforce is also evident. UNITED STATES
CHINA INDIA
UNITED KINGDOM BRAZIL MEXICO
FIG. 17: PROPORTION OF THE WORKFORCE BY AGE
5.62% 7.84% 6.47%
9.55%
14.79% 17.76%
21.26%
159M 514M 806M 110M 54M 45M 33M
66.26%
65.60
%
73.22 %
69.13 %
65.93% 65.87% 64.47%
18.95% 28.79% 17.23% 23.03% 27.61% 12.87% 17.77%
UNITED INDIA CHINA BRAZIL MEXICO GERMANY UNITED
STATES KINGDOM
0-14 15-65 65+
SITETRENDS: WAR FOR TALENT - JULY 2017 19
© 2017 Hickey & Associates. All Rights Reserved.GLOBAL WORKFORCE
FIG. 18: PROPORTION OF LABOR FORCE PARTICIPATION BY ECONOMIC SECTOR, 2015
79.1%
61.9%
49%
33.6% 36.1%
30.3% 31% 24.1%
20.3%
20
% 13.4%
61.9%
0.6%
73.8%
83.5%
MEXICO
UNITED CHINA INDIA
STATES
15.7%
13.3% 24.6%
1.6%
15.2%
BRAZIL
1.3%
GERMANY
UNITED
KINGDOM
Agriculture Industry Services
In terms of the distribution of each targeted country’s workforce, Figure 18
demonstrates the similarities between the economies of the United States and
United Kingdom. Both have very small agricultural employment sectors, due in
large part to long histories of mechanization and crop prioritization. India and China,
with reliance on labor-intensive rice harvests, have not made the investment into
agriculture necessary to free up large segments of the population for other sectors.
As education in India and China reaches rural areas, migration trends to urban areas
may fuel growth in services and manufacturing. Alternatively, diversification of the
economies of second tier Asian cities may also occur.
SITETRENDS: WAR FOR TALENT - JULY 2017 20
© 2017 Hickey & Associates. All Rights Reserved.GLOBAL EMPLOYMENT SECTOR
AND THE ECONOMY
FIG. 19: PROPORTION OF GDP BY ECONOMIC SECTOR, 2015
79.5%
72%
45.4% 50.7%
40.7%
29.8% 80.2%
69.1% 21.8%
19.4% 16.4%
63.2%
8.6% 6.3%
1.1%
33.1%
30.3%
19.2%
UNITED INDIA CHINA BRAZIL
STATES
3.7% 0.6% 0.6%
MEXICO GERMANY UNITED
KINGDOM
Agriculture Industry Services
Figure 19 shows the economic relationship between the employment sector
and contribution of that sector to the overall economy. In the United States,
Germany, and the United Kingdom, the proportion of workers in each sector is
similar to the economic benefit to those economies. However, in India and China,
a disproportionate number of workers are employed in agriculture. Nearly 50% of
all workers in India participate in the agricultural sector, but produce less than 10%
of that country’s GDP. Countries such as India, China, Brazil, and Mexico struggle
to feed their populations and expend more effort to produce their domestic food
supplies than the United States, Germany, and the United Kingdom.
The drain of agriculture on the economies of developing countries tends to affect
the service economy of those countries in contrast to the United States where higher
levels of educational attainment support a massive and growing service economy.
SITETRENDS: WAR FOR TALENT - JULY 2017 21
© 2017 Hickey & Associates. All Rights Reserved.GLOBAL GROSS DOMESTIC PRODUCT
FIG. 20: SERVICES AS A PERCENTAGE OF GDP
80
Services (Figure 20) have been
growing everywhere and in the
75
United States may represent nearly
80% of the economy by 2020.
70
Contributing to this growth are
the generational cycles. Millennials
65
will continue to push the service
60
economy to new heights, paralleling
the demands that the Baby Boom
55
population put on consumer goods.
50
45
1990 1994 1998 2002 2006 2010 2014 2018
UNITED STATES EURO AREA EAST ASIA
WORLD LATIN AMERICA SOUTH ASIA
FIG. 21: MANUFACTURING AS A PERCENTAGE OF GDP
Interestingly enough, the economic 40
crisis from 2008-2010 appears
to have had an inverse effect on
35
services (showing growth) compared
to manufacturing, in which broad
reductions in the representation 30
of the sector occurred. One likely
global outcome of the economic
crisis was a dynamic boost in service 25
economy production at the expense
of manufacturing. Competition in 20
the United States and around the
world for services may continue to
be increasingly competitive. 15
1990 1994 1998 2002 2006 2010 2014 2018
UNITED STATES EURO AREA EAST ASIA
WORLD LATIN AMERICA SOUTH ASIA
SITETRENDS: WAR FOR TALENT - JULY 2017 22
© 2017 Hickey & Associates. All Rights Reserved.GLOBAL UNEMPLOYMENT
Figure 22 shows the major trends in unemployment in the targeted economies.
The effects of the global economic crisis of 2008-2010 are reflected in this figure.
The economies of the United States, Europe, and Latin America (which are closely
linked) experienced large unemployment swings. In the case of Europe, the
economy has not yet fully recovered.
Since 1997, there have been three key events marked by 16-year cycles. Currently,
unemployment is low both in the United States and in many other parts of the
world. Some models indicate the current trend will begin to reverse itself over the
next three years.
FIG. 22: UNEMPLOYMENT AS A PERCENTAGE OF WORKFORCE
14
16-YEAR PHASE 16-YEAR PHASE
12
10
8
6
4
2
1991 1993 1995 1997 1999 2001 2003 2005 2007 2009 2011 2013 2015 2020
UNITED STATES EURO AREA EAST ASIA
WORLD LATIN AMERICA SOUTH ASIA
SITETRENDS: WAR FOR TALENT - JULY 2017 23
© 2017 Hickey & Associates. All Rights Reserved.SITETRENDS: WAR FOR TALENT - JULY 2017 24
hickey & associates
COMPANY BACKGROUND
we assist companies in selecting the best location to
expand, relocate, or consolidate anywhere in the world while
achieving vital savings to help grow and sustain business
H&A, founded in 1986, was one of the first companies to offer integrated site location
and workforce services. Today, as the global leader, H&A has active projects in every
corner of the world led by our team of seasoned professionals, with additional support
from Subject Matter Experts in key global markets.
By having a presence in key markets throughout the world, H&A ensures our services
are always aligned with each unique local environment and provides our clients with an
unparalleled level of support.
H&A has offices strategically located around the globe, including New York City,
Chicago, London, San Francisco, Bangalore, Hong Kong, Shanghai, Tokyo, Singapore,
Montreal, São Paulo, and Mexico City.
© 2017 Hickey & Associates. All Rights Reserved.30 years in the industry 29 locations globally
400+ projects in 2016 32% savings per project
$2b savings captured annually
DISCLAIMER
This report is published for general information only and is not intended to be relied upon in any way. Although high standards have been
used in the preparation of the information analysis, views and projections presented in this report, no responsibility or liability whatso-
ever can be accepted by Hickey & Associates LLC for any loss or damage resultant from any use of, reliance on or reference to the con-
tents of this document. As a general report, this material does not necessarily represent the view of Hickey & Associates LLC in relation to
particular properties or projects.
© Copyright 2017 Hickey & Associates LLC
Reproduction of this report in whole or in part is not allowed without prior written approval of Hickey & Associates LLC.
SITETRENDS: WAR FOR TALENT - JULY 2017
www.hickeyandassociates.com 25
© 2017 Hickey & Associates. All Rights Reserved.You can also read