An experimental study on shear bands in sand using the orthogonal cutting setup
←
→
Page content transcription
If your browser does not render page correctly, please read the page content below
EPJ Web of Conferences 249, 10007 (2021) https://doi.org/10.1051/epjconf/202124910007
Powders and Grains 2021
An experimental study on shear bands in sand using the orthogonal cutting
setup
Abhijit Hegde1,∗ and Tejas Murthy1,∗∗
1
Department of Civil Engineering, Indian Institute of Science, Bangalore 560 012, India
Abstract. We study the evolution of shear bands in granular media subjected to very large deformations using
the orthogonal cutting geometry. We perform our cutting experiments on Cauvery Delta sand with d50 of
0.45mm. We also capture images of the cutting process which allows us to perform a PIV analysis to determine
the deformation in material around the cutting tool. In our experiments we observe that the dynamic angle of
repose of the pile that forms in-front of the tool as cutting progresses, approaches the critical state friction angle
of the material. We observe a flow bifurcation around the tool as the material begins to slip along planes which
are oriented at an angle of π/4 − θ/2, θ being the dynamic angle of repose, to the cutting direction. This leads
to formation of shear bands/velocity jumps which contain around 14 particles. A measurement of dilation angle
within the shear bands indicate that material is in a critical state of deformation.
1 Introduction modeled as a plane strain, orthogonal cutting problem, in
a similar vein to machining in metals [5].
Shear bands are ubiquitous and form in all materials in-
cluding granular media. They make the overall deforma-
tion field inhomogeneous. From an engineering perspec- 2 Experimental set-up
tive, they are undesirable as they can lead to energy loss in
food processing industries, grain storing silos,etc., and are
also responsible for catastrophic events such as avalanches The experimental set-up employed by us to study the prob-
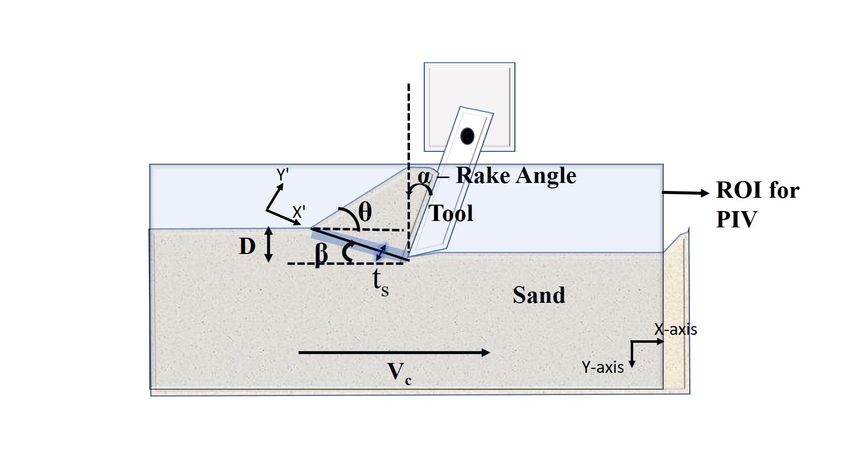
and failure of embankments. lem of orthogonal cutting of granular materials(sand) is
Hence shear bands warrant a detailed study, both qual- shown in Fig. 1. The set-up consists of an industrial grade
itatively and quantitatively. It becomes imperative that for Aluminium box of size 555mm x 160mm x 15mm with
better design of engineering equipment that handle granu- the front face and top faces removed. Slots were cut onto
lar materials, it is necessary to study the properties of shear the bottom and side panels of the box to place a transpar-
bands and their overall relation to both external boundary ent glass plate for imaging the cutting process. Sand was
conditions as well as internal constituents of the ensemble. filled into the box using a funnel(air pluviation method)
In-case of shear bands that form in granular media, resulting in a packing fraction of around 0.6. The box
they are studied in two distinct classes, ones that form near was then mounted onto a CNC machine(Ace Micromatic
the boundaries [1, 2] and ones that form within the bulk of Pvt.Ltd). A tool made of High-speed steel was fit into the
the material [3]. We present experiments on the orthogonal spindle of CNC machine and lowered into the box through
cutting geometry, wherein we are able to generate steady the space between the box and the glass plate. The box
shear bands within the bulk of granular material, whose is then translated at a constant velocity to perform our ex-
properties seem to remain more or less the same through- periments. Images of the cutting process were captured
out the experiment. Hence, the set-up provides us with a around the stationary tool using a high speed camera(PCO-
window into the phenomenon of shear banding in granu- HS1200), which was placed perpendicular to the front
lar materials, not just in the bulk, but also at the bound- face of the box, at a frame rate prescribed by the cutting
aries(appearing along the tool-material interface) allowing speed and with proper illumination of the region around
us to study their behavior in detail over long time inter- the tool. The resolution of the images captured during
vals. In this letter, we investigate properties of shear bands the process was 5.3pix/mm. The images were then ana-
which form inside the bulk of the material. lyzed using a PIV code written in MATLAB. PIV is an
The problem of trenching/ploughing, is of critical im- indirect, non-intrusive, whole field velocity measurement
portance to the civil engineering community [4] and is the technique, which can be used efficiently to obtain the de-
main motive for our current study. This problem can be formation field. We have used a non-overlapping correla-
tion window size of 40pix x 40pix and a maximum error
∗ e-mail: abhijithegde@iisc.ac.in not exceeding 3% was observed while measuring the ve-
∗∗ e-mail: tejas@iisc.ac.in locities.
A video is available at https://doi.org/10.48448/emzd-ph40
© The Authors, published by EDP Sciences. This is an open access article distributed under the terms of the Creative Commons Attribution License 4.0
(http://creativecommons.org/licenses/by/4.0/).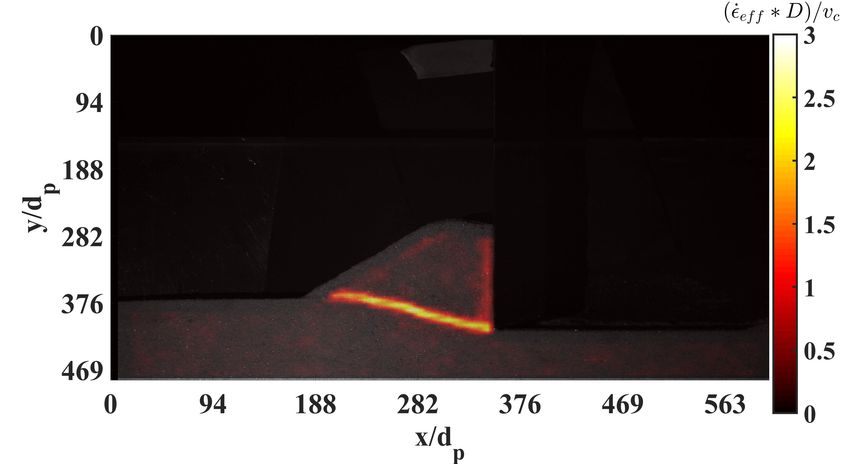
EPJ Web of Conferences 249, 10007 (2021) https://doi.org/10.1051/epjconf/202124910007
Powders and Grains 2021
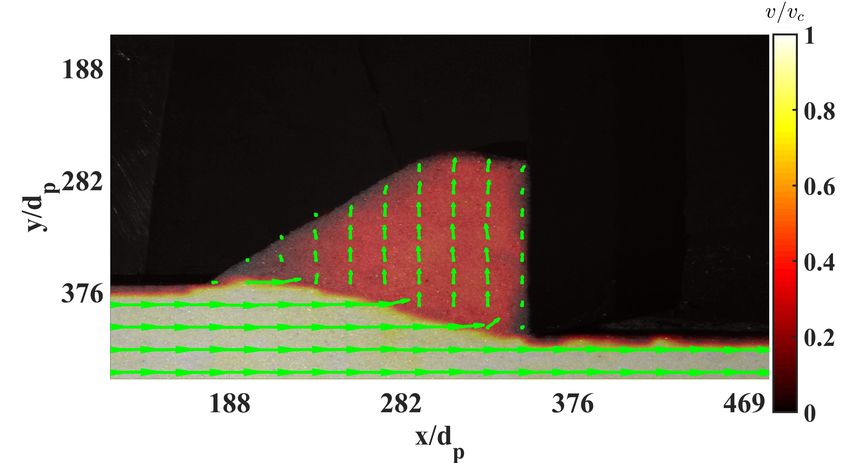
the same direction unimpeded, and this results in a flow bi-
furcation. In the bifurcation region, the particles roll over
one another along planes with a definite orientation, be-
fore being pushed upward along the rake face and undergo
significant retardation with the velocity magnitude reduc-
ing by 50%. As more of the material gets cut,the particles
moving upwards begin to repose under their own weight.
The free surface angle reaches a steady value with contin-
ued cutting. The overall pattern of the velocity field does
not change much with the progress of cutting, in the sense
Figure 1. Schematic of the experimental set-up with D that it is self-similar, with just the size of the pile changing.
being the initial depth of cut and Vc , the cutting speed The strain rate was computed from the velocity field
using the equation
˙ e f f = [4/9
∗ (1/2 ∗ [(˙ xx − ˙yy )2 + (˙ xx )2 + (˙yy )2 ] + 3/4 ∗ γ̇2xy )]1/2
3 Materials used (1)
In this paper, we have performed experiments on Cauvery ˙xx = δu/δx being the normal component of strain rate
Delta sand with a d50 of 0.45mm. The physical as well as tensor in the direction of tool traverse and u, the horizontal
mechanical properties of this granular material has been displacement.
studied extensively by [6]. The sand grains are angular ˙yy = δv/δy being the normal component of strain rate
with a roundness(R) value of 0.17. tensor in the direction perpendicular to tool traverse, v be-
ing the vertical displacement.
4 Results γ̇ xy = 1/2 ∗ [δu/δy + δv/δx] being the shear component
of strain rate.
The main parameters that have been often reported in or-
thogonal cutting experiments are the rake angle(α), cutting
velocity(Vc ) and the initial depth of cut(D) [7]. Our exper-
iments are performed at a rake angle of 00 and a cutting
speed of 10mm/min. The initial depth of cut is 20mm.
Hence, the imposed velocity provides us with a natural
strain rate scale given by Vc /D(8.35 ∗ 10−3 s−1 ), and has
been used to normalize our strain rate results. The dimen-
sions of the set-up have been normalized by representative
particle size, d50 and the tool displacement by initial tool
depth, D.
Figure 3. Strain rate field obtained from the velocity field.
A localized region of intense strain rate is clearly visible
in the figure
In Fig. 3, we have presented the strain rate field cor-
responding to the velocity field shown in Fig. 2. In the
strain rate field we clearly observe formation of a narrow
region of intense strain rate (3 times the imposed strain
rate) centered around the tool tip and reaching the free
surface, along which the material gets cut. The region is
Figure 2. Velocity field obtained from PIV. The present localized spatially and it makes a well defined angle with
image corresponds to a time instant when the tool has respect to the horizontal(direction of cutting). These nar-
moved by a distance of 5*D, D being the initial depth of row regions of strain localization are termed as shear bands
cut and they cause the deformation field to become inhomoge-
neous, rendering boundary measurements of strain mean-
ingless. We also observed regions of high strain rate at the
In Fig. 2, we present the velocity field obtained from tool-sand interface and near the free surface of the pile.
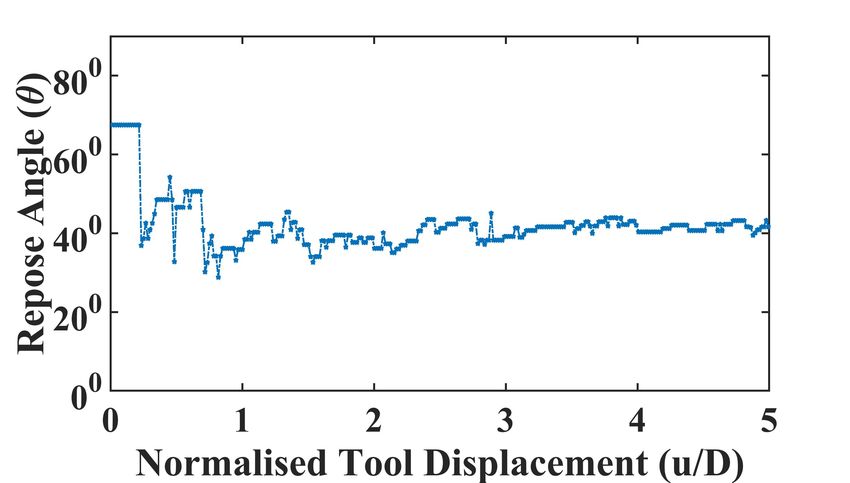
our PIV analysis. We have superposed a quiver plot on The angle of repose of the pile is plotted in Fig. 4. The
top of a contour map indicating the velocity magnitude, steady value of repose angle is close to 420 . By compar-
in-order to visualise the flow. The particles above the tool ing with the hollow cylinder experiments [6] carried out
tip undergo a sharp change in their direction as they ap- for a ’b’(intermediate principal stress ratio) value of 0.4
proach the tool while particles below continue to move in (which corresponds to plane strain conditions) on the sand
2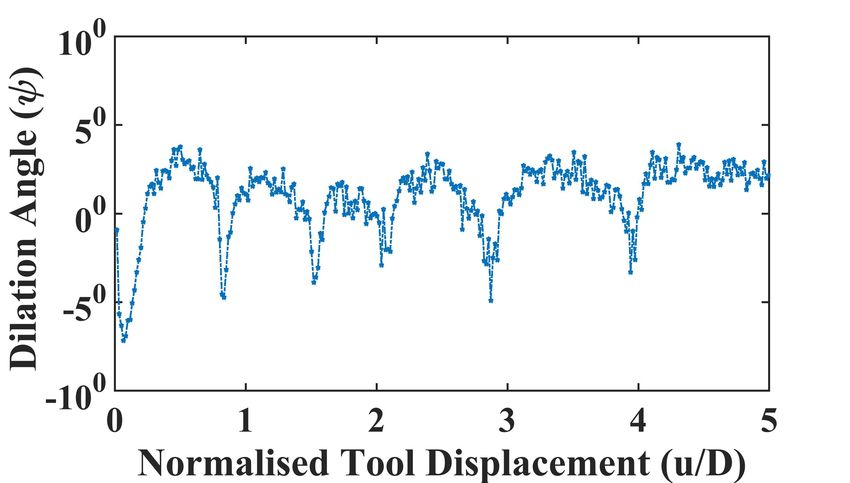
EPJ Web of Conferences 249, 10007 (2021) https://doi.org/10.1051/epjconf/202124910007
Powders and Grains 2021
used in our experiments, we observe that the repose angle along the Coulomb planes if we were to replace φ by dy-
of the pile is very close to the critical state friction an- namic angle of repose θ, which, as mentioned earlier, cor-
gle obtained using the hollow cylinder tests under similar responds to the critical state friction angle of the material.
boundary conditions. Therefore, the dynamic repose angle of granular materials
indeed corresponds to its internal friction angle at critical
state and remains to be verified under different geometries.
4.2 Measuring the thickness of shear bands
The thickness of shear bands is of critical importance to
any continuum theory trying to model the mechanical be-
havior of granular materials. It provides an intermedi-
ate length scale, between the particle level of interactions
and the macroscopic deformations measured. Also shear
bands correspond to regions across which granular materi-
Figure 4. Evolution of repose angle as a function of tool als undergo phase transition from a solid to fluid like state.
displacement Though many experiments have been conducted, typically
in a biaxial or triaxial apparatus, to determine the final
4.1 Determination of shear band inclination angle thickness of such shear bands, it is not possible to study
In-order to determine the inclination angle of the shear the characteristics of these critical localization phenom-
band, we have used the Standard Hough Transformation ena under very large deformations using such classical ap-
technique, which has been used to identify lines in an im- proaches. Orthogonal cutting geometry is especially suit-
age. More information regarding the technique can be able under such circumstances. It allows the researcher to
obtained in [8]. The Hough transformation has been per- generate shear bands whose properties remain more or less
formed on the strain rate contour field (Fig. 3) in this study. steady throughout the entire cutting process and makes
Similarly, the velocity field can also be used to the same possible, to perform a detailed study of these interesting
effect. features in granular materials.
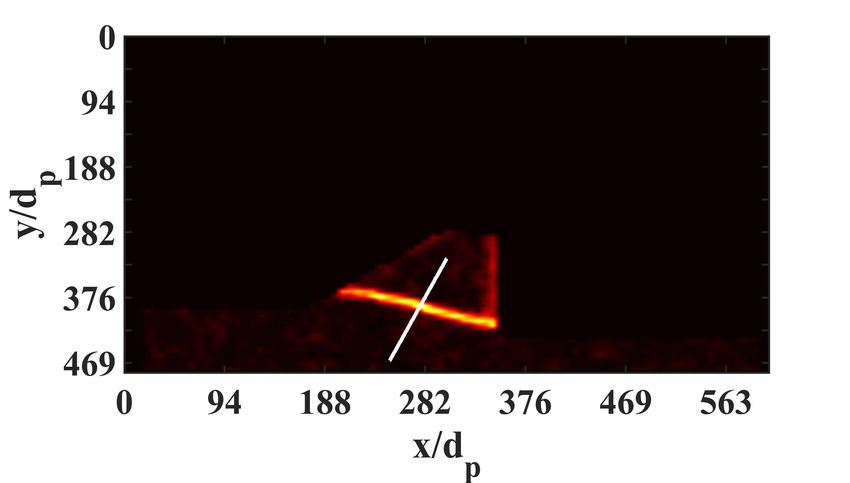
In-order to determine the thickness of the shear bands
formed during the cutting process, we have used the data
on inclination angle from our previous analysis. A line is
drawn perpendicular to the shear band as shown in Fig. 6
and the strain rate profile along the line is determined.
Similar lines are considered along the length of the shear
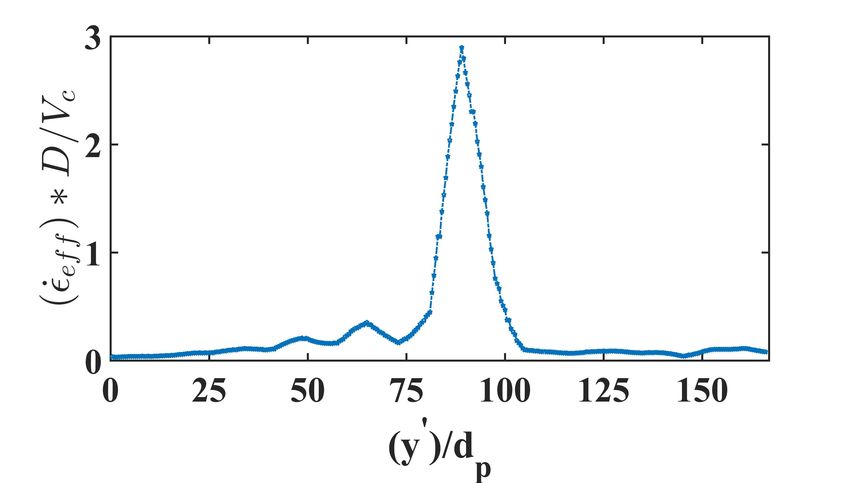
band, and the spatial average is considered. A typical pro-
file of shear strain along such a line (taken midway along
the length of shear band) is shown in Fig. 7. We observe
that the profile is Gaussian. We have used the concept of
FWHM (Full Width at half maximum) to determine the
Figure 5. Evolution of inclination angle of shear band, β, extent of localization using the strain rate profile. Evolu-
measured with respect to the direction of cutting tion of the thickness of shear band as cutting progresses,
is shown in Fig. 8. We observe that the thickness fluctu-
ates in time. Identifying the region of localization within
The angle determined during each frame has been col- the image also allowed us to make a measurement of dila-
lated and presented in Fig. 5. The angle of inclination is tion angle within the shear band. As in the case of thick-
higher during the initial stages of cutting (maximum value ness of the shear band, strong fluctuations were also ob-
measured is close to 360 ), which we conjecture is mostly served in the measured values of dilation angle (Fig. 9).
due to its proximity to the tool, as we often observe shear The mean value (averaged in time) of shear band thick-
bands forming at the interface between the tool and the ness was 14 ± 2 ∗ d p , which is only slightly less than the
pile. The angle tends to increase and decrease periodically theoretically predicted value of 16 ∗ d p by [11] based on
similar to observations made by [9], with the mean value, bifurcation analysis. The evolution of dilation angle with
averaged over the last 150 frames, being 220 ± 20 . We tool displacement is shown in Fig. 9. The average dilation
notice that this angle is close to π/4 − θ/2, θ being the angle within the shear band is close to 10 , hence clearly
angle of repose of the pile measured in our experiments indicating that the material has a reached a critical state of
(Fig. 4). It is well known from Mohr-Coulomb theory that deformation, making the plastic flow within the shear band
granular materials fail along planes which are inclined at non-associative.
an angle of π/4 − φ/2, φ being the internal friction angle, In fact the shear bands obtained in our PIV analy-
to the direction of major principal stress (which happens to sis should correspond to velocity discontinuities [12] and
be the direction of cutting in our case [10]). These planes hence are supposed to be inclined at angle of π/4 − ψ/2
have been termed as Coulomb rupture planes. Our exper- (ψ being the dilation angle) to the direction of major prin-
imental results suggest that shear bands align themselves cipal strain rate. This implies that the direction of major
3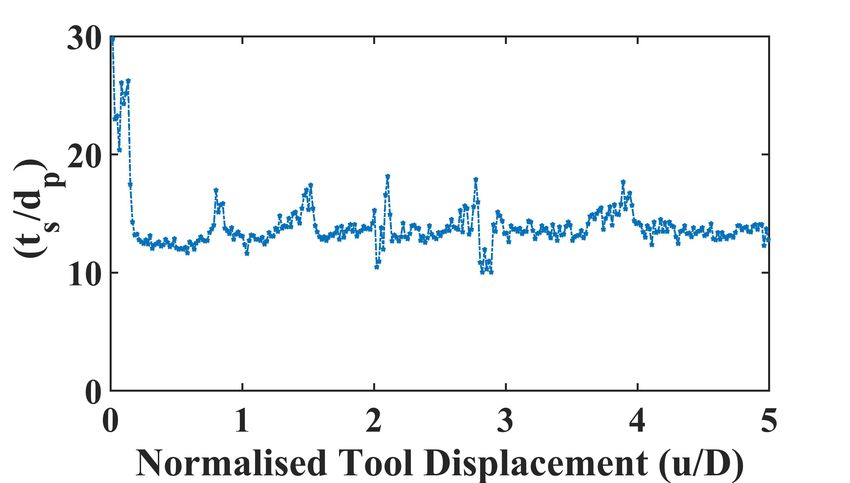
EPJ Web of Conferences 249, 10007 (2021)                                                      https://doi.org/10.1051/epjconf/202124910007
Powders and Grains 2021

      principal strain rate does not coincide with the direction
      of major principal stress. The direction of major princi-         5 Conclusion
      pal strain rate(which is compressive) is inclined at angle
                                                                        We use orthogonal cutting set-up to quantitatively study
      of −220 to the x-axis, as the tool pushes into the material
                                                                        large deformations in granular materials. We generate
      in-order to dislodge it from its position.
                                                                        consistent shear bands within the system and their proper-
                                                                        ties can be very easily studied using simple imaging tech-
                                                                        niques like PIV. In our work, using this orthogonal cutting
                                                                        geometry, we study the overall deformation field as well
                                                                        as the behavior of shear bands forming within the bulk of
                                                                        Cauvery Delta sand with a d50 of 0.45mm, both qualita-
                                                                        tively and quantitatively. We observe that as the cutting
                                                                        progressed, material removed from the bulk formed a pile
                                                                        in-front of the tool and the free surface angle of this pile
                                                                        was found to be very close to the critical state friction an-
                                                                        gle of the granular material. The measured thickness of the
                                                                        shear bands was close to the value predicted by the bifur-
      Figure 6. Sample line along which the strain rate profile
                                                                        cation theory and the orientation of the shear band seems
      has been measured in our experiments
                                                                        to coincide with the Coulomb rupture planes. The mate-
                                                                        rial within the shear band is in a critical state of deforma-
                                                                        tion. We believe that these experimental observations from
                                                                        orthogonal cutting geometry could be used to benchmark
                                                                        DEM simulations.

                                                                        References
                                                                         [1] D.M. Mueth, G.F. Debregeas, G.S. Karczmar, P.J.
                                                                             Eng, S.R. Nagel, H.M. Jaeger, Nature 406, 385
                                                                             (2000)
      Figure 7. Typical strain rate profile measured along lines
                                                                         [2] R. Nedderman, C. Laohakul, Powder Technol 25, 91
      perpendicular to the shear band
                                                                             (1980)
                                                                         [3] D. Fenistein, J.W. van de Meent, M. van Hecke, Phys
                                                                             Rev Lett 92, 094301 (2004)
                                                                         [4] J.P. Hambleton, S. Stanier, D.J. White, S.W. Sloan,
                                                                             Aust Geomech J 49, 147 (2014)
                                                                         [5] P. Dewhurst, I. Collins, Int J Numer Meth Eng 7, 357
                                                                             (1973)
                                                                         [6] R.K. Kandasami, T.G. Murthy, Granul Matter 19, 21
                                                                             (2017)
                                                                         [7] E. McKyes, Soil cutting and tillage (Elsevier, 1985)
                                                                         [8] R.O. Duda, P.E. Hart, Commun ACM 15, 11 (1972)
                                                                         [9] N. Gravish, P.B. Umbanhowar, D.I. Goldman, Phys
      Figure 8. Evolution of shear band thickness, t s as a func-
                                                                             Rev Lett 105, 128301 (2010)
      tion of tool displacement
                                                                        [10] Y. Hatamura, K. Chijiiwa, B JSME 18, 619 (1975)
                                                                        [11] H.B. Mühlhaus, I. Vardoulakis, Geotechnique 37,
                                                                             271 (1987)
                                                                        [12] K.H. Roscoe, Geotechnique 20, 129 (1970)

      Figure 9. Evolution of dilation angle within the shear band
      as a function of tool displacement.

                                                                    4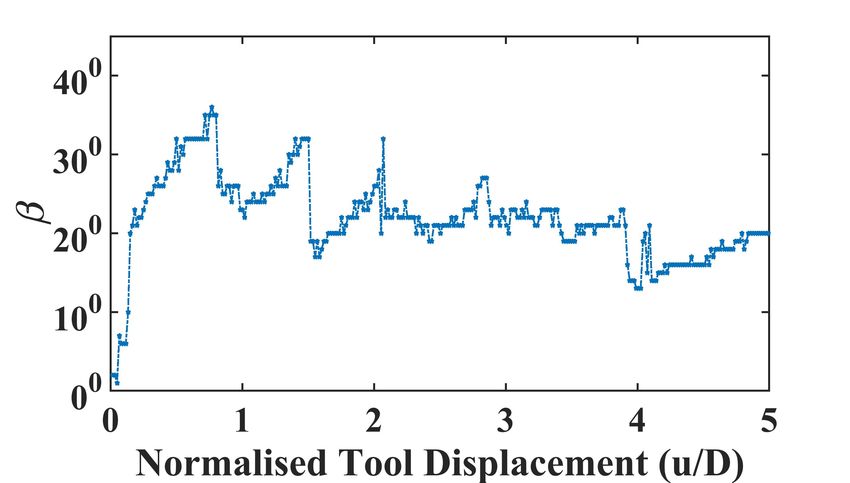
You can also read