An Inducible and Vascular Smooth Muscle Cell-Specific Pink1 Knockout Induces Mitochondrial Energetic Dysfunction during Atherogenesis
←
→
Page content transcription
If your browser does not render page correctly, please read the page content below
International Journal of
               Molecular Sciences

Article
An Inducible and Vascular Smooth Muscle Cell-Specific Pink1
Knockout Induces Mitochondrial Energetic Dysfunction
during Atherogenesis
Craig K. Docherty, Jordan Bresciani                     , Andy Carswell, Amrita Chanderseka, Elaine Friel, Marianna Stasi
and John R. Mercer *

                                            Institute of Cardiovascular and Medical Sciences, College of Medical Veterinary and Life Sciences,
                                            University Avenue, University of Glasgow, Glasgow G12 8TA, UK; craig.docherty@glasgow.ac.uk (C.K.D.);
                                            jordan.bresciani@glasgow.ac.uk (J.B.); andy.carswell@glasgow.ac.uk (A.C.); amrita.chanderseka@glasgow.ac.uk (A.C.);
                                            elaine.friel@glasgow.ac.uk (E.F.); marianna.stasi@glasgow.ac.uk (M.S.)
                                            * Correspondence: john.mercer@glasgow.ac.uk

                                            Abstract: DNA damage and mitochondrial dysfunction are defining characteristics of aged vascular
                                            smooth muscle cells (VSMCs) found in atherosclerosis. Pink1 kinase regulates mitochondrial home-
                                            ostasis and recycles dysfunctional organelles critical for maintaining energetic homeostasis. Here,
                                            we generated a new vascular-specific Pink1 knockout and assessed its effect on VSMC-dependent
                                            atherogenesis in vivo and VSMC energetic metabolism in vitro. A smooth muscle cell-specific and
                                  MHC-Cre-inducible flox’d Pink1f/f kinase knockout was made on a ROSA26+/0 and ApoE−/−

                                            C57Blk6/J background. Mice were high fat fed for 10 weeks and vasculature assessed for physiologi-
Citation: Docherty, C.K.; Bresciani, J.;    cal and pathogical changes. Mitochondrial respiratory activity was then assessed in wild-type and
Carswell, A.; Chanderseka, A.; Friel, E.;   knockout animals vessels and isolated cells for their reliance on oxidative and glycolytic metabolism.
Stasi, M.; Mercer, J.R. An Inducible
                                            During atherogenesis, we find that Pink1 knockout affects development of plaque quality rather than
and Vascular Smooth Muscle
                                            plaque quantity by decreasing VSMC and extracellular matrix components, collagen and elastin.
Cell-Specific Pink1 Knockout Induces
                                            Pink1 protein is important in the wild-type VSMC response to metabolic stress and induced a com-
Mitochondrial Energetic Dysfunction
                                            pensatory increase in hexokinase II, which catalyses the first irreversible step in glycolysis. Pink1
during Atherogenesis. Int. J. Mol. Sci.
2021, 22, 9993. https://doi.org/
                                            appears to play an important role in VSMC energetics during atherogenesis but may also provide
10.3390/ijms22189993                        insight into the understanding of mitochondrial energetics in other diseases where the regulation of
                                            energetic switching between oxidative and glycolytic metabolism is found to be important.
Academic Editors: Daniela Valenti
and Anna Atlante                            Keywords: mitochondrial dysfunction; atherosclerosis; DNA damage; oxidative phosphorylation;
                                            glycolysis
Received: 13 August 2021
Accepted: 8 September 2021
Published: 16 September 2021

                                            1. Introduction
Publisher’s Note: MDPI stays neutral
                                                  DNA damage and mitochondrial dysfunction are discerning characteristics of human
with regard to jurisdictional claims in
                                            atherosclerosis [1–3]. Regulation of mitochondrial integrity is controlled by the phosphatase
published maps and institutional affil-
                                            and tensin homolog (PTEN)-induced kinase 1 (Pink1). Human plaque vascular smooth
iations.
                                            muscle cells (pVSMCs) age faster than surrounding vessel wall cells11 and consequen-
                                            tially rely on a p53-dependent cell signalling program that drives cyclin-dependent kinase
                                            inhibitor (CDKi) activity that sensitises plaque cells to readily undergo apoptosis [4,5].
                                            While apoptosis may limit early VSMC hyperplasia accompanying atherogensis, the loss
Copyright: © 2021 by the authors.
                                            of proliferation is a characteristic of end-stage disease and is more characteristic of cap
Licensee MDPI, Basel, Switzerland.
                                            thinning and propensity for plaque rupture [2,6,7]. Work has shown that excess nuclear
This article is an open access article
                                            DNA damage and decreased repair capacity drive mitochondrial dysfunction in plaque
distributed under the terms and
                                            VSMCs. Analysis of human plaque samples has shown that the cap is especially suscep-
conditions of the Creative Commons
                                            tible to DNA damage, with cells presenting significant loss of mitochondrial dependant
Attribution (CC BY) license (https://
creativecommons.org/licenses/by/
                                            oxidative phosphorylation [8]. Not surprisingly, the VSMC phenotype in the plaque is
4.0/).
                                            tightly coupled to the energetic state of the cell, with changes in VSMC plasticity directly

Int. J. Mol. Sci. 2021, 22, 9993. https://doi.org/10.3390/ijms22189993                                                https://www.mdpi.com/journal/ijms
Int. J. Mol. Sci. 2021, 22, 9993                                                                                            2 of 14

                                   related to changes in cellular metabolism [9]. This accelerated aging phenotype is also
                                   found in explant human VSMCs in culture [10]; for example, we found that cells isolated
                                   from human carotid endarterectomy specimens show loss of mitochondrial integrity as
                                   flagged by Pink1 [8,11].
                                        Pink1 is a 63 kDa serine/threonine protein kinase that is constitutively expressed
                                   and shuttled to the mitochondria. When the respiratory chain fails, the mitochondrial
                                   membrane potential (m∆Ψ) depolarises, and Pink1 is stabilised through phosphorylation
                                   and recruits Parkin to coordinate mitochondrial proteasomal degradation [8]. A fraction of
                                   Pink1 is held with hexokinase II at the mitochondrial membrane termed, mitoHKII. It binds
                                   voltage-dependent anion channel 1 (VDAC1) which interacts with adenosine nucleotide
                                   translocase (ANT) to provide a coupling between glycolysis and oxidative phosphorylation
                                   which appears to confer a survival advantage [12]. We hypothesised that as plaque VSMCs
                                   age, they accelerate mitochondrial dysfunction, which mediates an energetic switch that
                                   favours a compensatory glycolysis program to maintain energy homeostasis.
                                        During this transition period, we find that human cells have an increased abundance
                                   in phosphorylation of the energy sensor Adenosine Triphosphate (ATP) sensor AMP Ki-
                                   nase (AMPK) at Thr172 and increased glycolytic protein expression in the plaque cap [8].
                                   Importantly, AMPK also upregulates total hexokinase II (HK-II), which has been shown to
                                   provide cardioprotection against ischemia and offer an adaptive role in cell surivival [13].
                                   Here, we genetically modified mice to exhibit features of mitochondrial dysfunction and ac-
                                   celerated vascular aging using a Pink1 smooth muscle cell-specific and inducible Cre/LoxP
                                   system to provide spatial and temporal control over Pink1 knockout.
                                        We targeted Pink1 as it plays a central role in mitochondrial homeostasis but may
                                   also be important in the emerging role of mitochondrial dysfunction in atherosclerosis.
                                   Pink1 is nuclear encoded but becomes mitochondrial resident to protect vascular cells
                                   from mitochondrial stress and is essential for recycling of energetically failed mitochon-
                                   drial organelles through autophagy [11] and we suggest that it indirectly protects plaque
                                   stability by maintaining a healthy pool of VSMCs [14]. Here, we aim to test: (1) What
                                   effect does Pink1 knockout have on plaque development, and is this purely on plaque
                                   quantity or plaque quality? (2) Is Pink1 essential for normal oxidative phosphorylation
                                   during atherogenesis?

                                   2. Results
                                   2.1. Pink1 Mice Generation
                                         The original Pink1f/f knockout mice were gifted from Glasl et al. with the truncation
                                   site occurring between exons 1 and 4 and exon 8 and the 30 -UTR (Figure 1A), which was
                                   confirmed by them by Southern blot (Figure 1B) [15]. Flox’d Pink1-f/f mice were crossed
                                   with ApoE−/− animals (Figure 1C). Double homozygotes were then bred with Cre+/0
                                   Rosa+/+ ApoE−/− mice, with DNA genotyping completed for each allele (Figure 1D). A
                                   Pink excision pilot study used a Cre/ROSA beta galactosidase reporter after IP injection
                                   with tamoxifen in corn oil (n = 3). Cre-recombinase and X-gal staining was confirmed
                                   across entire sections of aortic rings (upper pair) of vessels and is counterstained with eosin
                                   (lower pair) (Figure 1E). Whole abdominal aortic tissue were stained blue in presence of
                                   X-gal when Pink was excised when Cre was activated. (Figure 1F). A Pink1-KO VSMC
                                   line was derived by explanting whole aortae and treating with hydroxytamoxifen (OHT)
                                   in culture (×10) (scale bar 100 µm) (Figure 1G). The atherosclerosis feeding protocol used
                                   littermate and sex-matched controls and the Pink1 transgenic group fed up to 16 weeks of
                                   age (Figure 1H).
Int. J. Mol. Sci. 2021, 22, x FOR PEER REVIEW                                                                                                       3 of 15
Int. J. Mol. Sci. 2021, 22, 9993                                                                                                                    3 of 14

     Figure 1.     Micebreeding
               1.Mice     breeding   scheme.
                                   scheme.  (A)(A)   Original
                                                 Original   Pink1Pink1   f/f knockout
                                                                   f/f knockout   out miceoutlocus
                                                                                               miceand
                                                                                                     locus
                                                                                                        (B) and  (B) truncation
                                                                                                            truncation             site andSouthern
                                                                                                                         site and original  original
     blot by Glasl
     Southern     blotetby
                         al Glasl
                            [15]. (C) Flox’d
                                  et al. [15]. Pink1 f/f
                                               (C) Flox’dmicePink1   f/f
                                                               were crossed     withcrossed
                                                                         mice were     ApoE−/−with
                                                                                                 animals.
                                                                                                      ApoE   −/− animals.
                                                                                                           Double   homozygotes
                                                                                                                              Doublewere  then bred
                                                                                                                                       homozygotes
     with Cre
     were
                +/0 Rosa+/+ ApoE−/−
            then bred     with Cre+/0 mice.
                                         Rosa(D)
                                              +/+DNA
                                                   ApoEgenotyping
                                                           −/− mice. (D) for each
                                                                              DNAallele    (E) Pinkfor
                                                                                      genotyping    excision   pilot study
                                                                                                        each allele  (E) Pinkused  a Cre/ROSA
                                                                                                                               excision          beta
                                                                                                                                         pilot study
     galactosidase
     used a Cre/ROSA  reporter
                             betaafter IP injection
                                   galactosidase      with tamoxifen
                                                   reporter                in corn oil
                                                               after IP injection       (n tamoxifen
                                                                                     with   = 3). Cre-recombinase
                                                                                                       in corn oil (nand   X-gal
                                                                                                                        = 3).     staining was con-
                                                                                                                              Cre-recombinase    and
     firmed across entire sections of aortic rings (upper pair) of vessels and is counterstained with eosin (lower pair). (F) Whole
     X-gal staining was confirmed across entire sections of aortic rings (upper pair) of vessels and is counterstained with eosin
     abdominal aortic tissue were stained blue in presence of X-gal when Pink was excised and Cre was activated. (G) A Pink1-
     (lower pair). (F) Whole abdominal aortic tissue were stained blue in presence of X-gal when Pink was excised and Cre was
     KO VSMC line was derived from Pinkf/f explant whole aortae                      and treatedwith hydroxytamoxifen (OHT) in culture to
                                                                                 f/f explant whole aortae and treatedwith hydroxytamoxifen
     activated.
     mediate       (G) A
                Pink1     Pink1-KO
                        excision      VSMC
                                  using        line was derivedreporter
                                         a beta-galactosidase        from Pink(arrows)   (×10) (scale bar 100 µm). (H) The atherosclerosis feed-
     (OHT)
     ing      in culture
         protocol          to mediate
                     included           Pink1
                                littermate   andexcision  using acontrols
                                                  sex-matched       beta-galactosidase
                                                                              with groups   reporter
                                                                                              fed up (arrows)   (×10)
                                                                                                      to 16 weeks   of (scale
                                                                                                                        age tobar  100 µm).
                                                                                                                               generate      (H) The
                                                                                                                                         atheroscle-
     atherosclerosis
     rotic lesions.      feeding   protocol  included    littermate    and  sex-matched      controls  with  groups   fed up  to 16  weeks of age to
     generate atherosclerotic lesions.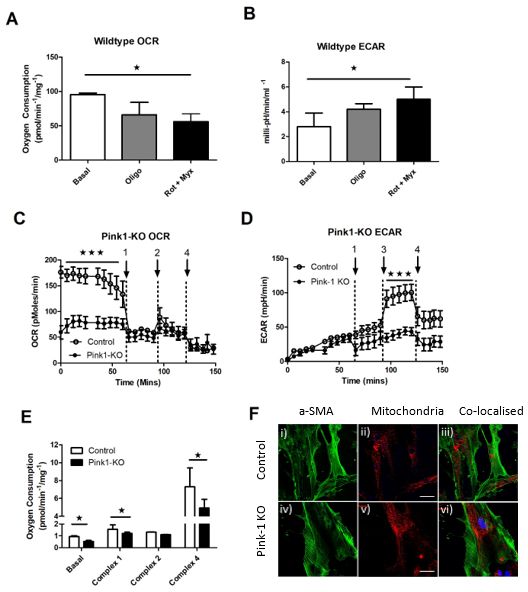
Int. J. Mol. Sci. 2021, 22, x FOR PEER REVIEW 4 of 15
Int. J. Mol. Sci. 2021, 22, 9993 4 of 14
2.2. Pink1 Mice Characterisation during High-Fat Feeding
2.2. Pink1 Mice Characterisation during High-Fat Feeding
Mice were weaned at 4–6 weeks of age from a standard chow to a high-fat diet (See
Mice
Section 4.2)were weaned at
and assessed for4–6 weeks of
a number of age from a standard
physiological chowand
parameters to ashowed
high-fatdifference
diet (See
Section 4.2) and assessed for a number of physiological parameters and showed
in weight (Figure 2A) but no change in serum glucose (Figure 2B) cholesterol or difference
in weight (Figure 2A) but no change in serum glucose (Figure 2B) cholesterol or triglyceride.
triglyceride. Readings were taken after 4 hr fast by tail bleed at 0, 5 and 10 weeks (on diet)
Readings were taken after 4 hr fast by tail bleed at 0, 5 and 10 weeks (on diet) and read
and read immediately using a 3-in-1 handheld monitor (PrimaTM). Indeed serum lipids
immediately using a 3-in-1 handheld monitor (PrimaTM ). Indeed serum lipids rapidly
rapidly increased across the feeding time course but there was no difference between any
increased across the feeding time course but there was no difference between any of the
of the groups either at study start or by the end (Figure 2C,D). Mice had a significant
groups either at study start or by the end (Figure 2C,D). Mice had a significant difference in
difference in heart rate, (Figure 2E) but there was no significant difference in either
heart rate, (Figure 2E) but there was no significant difference in either diastolic or systolic
diastolic or systolic blood pressures (Figure 2F).
blood pressures (Figure 2F).
Figure 2.
Figure Pink1 mice
2. Pink1 mice body
body weight,
weight, serums
serums andand heart
heart and
and blood
blood pressures
pressures during
during high-fat
high-fat feeding.
feeding.
(A) Body
(A) Body weights
weights over experimental
experimental time course. (B) BloodBlood serum
serum values
values for for glucose
glucose (C) cholesterol
cholesterol
and
and (D)
(D) triglyceride
triglyceride across the high-fat
high-fat feeding
feeding time
time course
courseatat TT == 0,
0, TT == 5 and T = 10 weeks. (E) Mice
heart
heart rates
rates@@TT==55weeks.
weeks.(F)(F)Tail-cuff
Tail-cuffblood
bloodpressure
pressurevalues
values5 weeks
5 weeks high-fat
high-fatdiet. Student
diet. Studentt-test (n
t-test
=(n6)=(ns—non
6) (ns—nonsignificant), *** ***
significant), p ≤p0.001. vs. control.
≤ 0.001. vs. control.
Int. J. Mol. Sci. 2021, 22, x FOR PEER REVIEW 5 of 15
Int. J. Mol. Sci. 2021, 22, 9993 5 of 14
2.3. Plaque Composition in Pink1-KO Mice
2.3. Plaque However,
Compositionafter
in Pink1-KO
a 10 weekMicehigh-fat diet feeding regime to induce atherosclerosis,
However,
Pink1-KOaftermicea had
10 week high-fat
significant diet feeding
changes to theregime
qualityto
ofinduce
plaqueatherosclerosis,
composition. The Pink1-
coronary
KO mice hadwas
sinus significant
used changes to the qualitylandmark
as a geographical of plaque composition.
between animals The coronary
to aid sinus
sectioning
was used as a geographical
reproducibility (Figurelandmark
3A). Thebetween animals
whole aorta wastoused
aid sectioning
as a measurereproducibility
of global plaque
(Figure 3A). The whole aorta was used as a measure of global plaque burden.
burden. Aortae were harvested from the aortic arch to the femoral bifurcation Aortaeand
werestained
harvested
with Oil red O to visualise and quantify fatty plaque deposits as previously O
from the aortic arch to the femoral bifurcation and stained with Oil red to
described
visualise and
[2,6,7] quantify
(Figure 3B).fatty plaque
Plaque deposits
area in as previously
heart valve plaques weredescribed [2,6,7]
quantified for(Figure 3B). with
each leaflet,
Plaqueanarea in heart
average of 3 valve
plaqueplaques were
per sinus quantified
(Figure for each leaflet,
3C). Numerous withplaques
individual an average
wereofscored
3 plaque per sinus (Figure 3C). Numerous individual plaques were scored across
across the entire luminal surface of the aorta and plotted between groups (Figure the entire
3D). The
luminal surface of the aorta and plotted between groups (Figure 3D). The abundance
abundance and distribution of aortic plaques across the thoracic and abdomen aorta were
and distribution of aortic plaques
similar in littermates with theacross the thoracic
majority of plaquesand abdomen
less than 2 ×aorta
104 µmwere
2 in similar
size. in
littermates with the majority of plaques less than 2 × 104 µm2 in size.
Figure 3. Cont.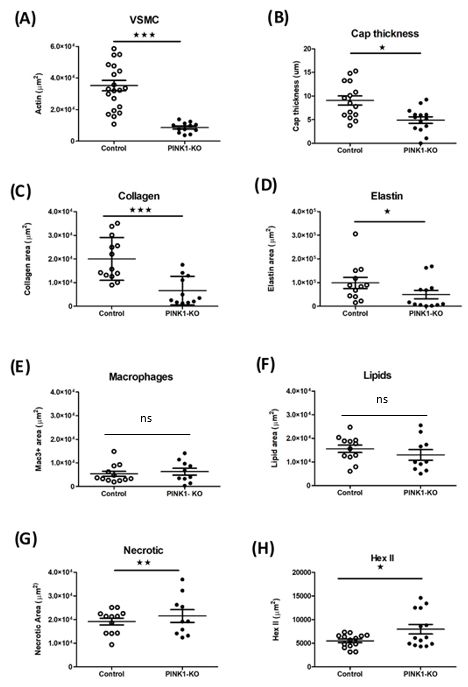
Int. J. Mol. Sci. 2021, 22, x FOR PEER REVIEW
Int. J. Mol. Sci. 2021, 22, 9993 6 of 14
Figure 3. Pink1-KO ApoE−/− mice have features of increased plaque vulnerability. Heart aortic
Figure 3. Pink1-KO ApoE−/− mice have features of increased plaque vulnerability. Heart aortic root valves were sectioned
root valves
at the coronary outflows were
andsectioned
assessed forat plaque
the coronary
quantityoutflows and assessed
and quality. (A) Grossfor plaque
plaque quantity
structure andand quality. of VSMC
abundance
(A) Gross plaque structure and abundance of VSMC and macrophages, elastin andcollagens,
and macrophages, elastin andcollagens, hexII and Pink1 expression in plaque cap and IgG2A isotype controls hexII(Olympus
and Pink1
CellSenS) (scale 2 mm),expression
control n in
= 9,plaque
Pink1-KOcap and IgG2A
n = 15. isotype controls
(B) Representative (Olympus
whole CellSenS)
aortae were taken(scale 2 mm),
from the aortic arch to
the femoral bifurication
control n = 9, and stainednfor
Pink1-KO total
= 15. (B)plaque burden with
Representative Oil red
whole O, en
aortae facetaken
were preparation
from the(scale bararch
aortic 500 µm). (C)
Heart aortic
to valve (sinus)bifurication
the femoral plaque cross-sectional
and stainedarea for then
total quantified between
plaque burden withgroups.
Oil red(D)
O, enFrequency of all discrete lu-
face preparation
minal surface aortic
(scale plaques
bar 500 µm).were digitally
(C) Heart extracted
aortic and plotted
valve (sinus) plaquebetween controlarea
cross-sectional and then
Pink1-KO mice between
quantified (Student t-test p ≥
0.05, ns—not significant).
groups. (D) Frequency of all discrete luminal surface aortic plaques were digitally extracted and
plotted between control and Pink1-KO mice (Student t-test p ≥ 0.05, ns—not significant).
2.4. Quantification of Plaque Phenotypes in Pink1 Knockdown Model
2.4. Quantification ofImmunohistochemistry
Plaque Phenotypes in Pink1 wasKnockdown
quantified Modelto evaluate plaque composition in
presence or absence of Pink1 (Table
Immunohistochemistry was quantified to evaluate plaque 1). Vascular smooth muscle actin-positive
composition in the pres- (SMA+
monocyte/macrophage (Mac3+), collagen and elastin
ence or absence of Pink1 (Table 1). Vascular smooth muscle actin-positive (SMA+) abundance were scored
and across
monocyte/macrophage (Mac3+), collagen and elastin abundance were scored across each wall (SM
aortic sinus. A significant decrease in total SMA stained area for vessel
aortic sinus. A(Figure 4A) was
significant observed.
decrease This SMA
in total translated to aarea
stained measurable
for vesseldecrease across the plaqu
wall (SMA+)
(Figure 4A) wasthickness
observed. (Figure 4B). Picosirius
This translated to a red staining was
measurable used across
decrease to estimate abundance
the plaque cap of colla
thickness (Figurean4B).
important structural
Picosirius component
red staining was usedof the
toplaque,
estimate with collagen of
abundance type I accounting for
collagens,
90% collagen
an important structural abundance
component of the in the plaque
plaque, (Figuretype
with collagen 4C).I accounting
Verhoeff’s for elastin
over van Gie
90% collagen abundance in the plaque (Figure 4C). Verhoeff’s elastin van Gieson’s staining (Figure
staining was used to estimate elastin and extracellular matrix deposition
Significant
was used to estimate changes
elastin in distribution
and extracellular of these
matrix markers
deposition were4D).
(Figure observed across the pl
Significant
commensurate with the reduction in the abundance
changes in distribution of these markers were observed across the plaque commensurate of VSMC cells. In contrast, no ch
in tissue resident monocyte/macrophages (Mac3+) (Figure
with the reduction in the abundance of VSMC cells. In contrast, no change in tissue resident 4E), total lipid content (F
4F) and necrotic
monocyte/macrophages (Mac3+)core(Figure
area when4E), scored as acontent
total lipid composite of lipid
(Figure 4F)void
and and foam cells reg
necrotic
core area whenwas observed
scored (Figure of
as a composite 4G). The
lipid calculation
void and foamofcells a vulnerability index by the rat
regions was observed
(Figure 4G). The macrophage+lipids to the VSMC+collagen
calculation of a vulnerability index by the ratio plaque component strongly
of macrophage+lipids to supp
the VSMC+collagen plaque component strongly supported increased vulnerability in Pink1abundan
increased vulnerability in Pink1 KO. An interesting observation is the
hexokinase
KO. An interesting II protein,
observation is theas a measureofofhexokinase
abundance glycolysis which appears
II protein, as alimited
measure toof
plaque cap
glycolysis which appears limited to plaque cap and not medial VSMCs. This was notably
increased in the plaque in the absence of Pink1 (Figure 4H).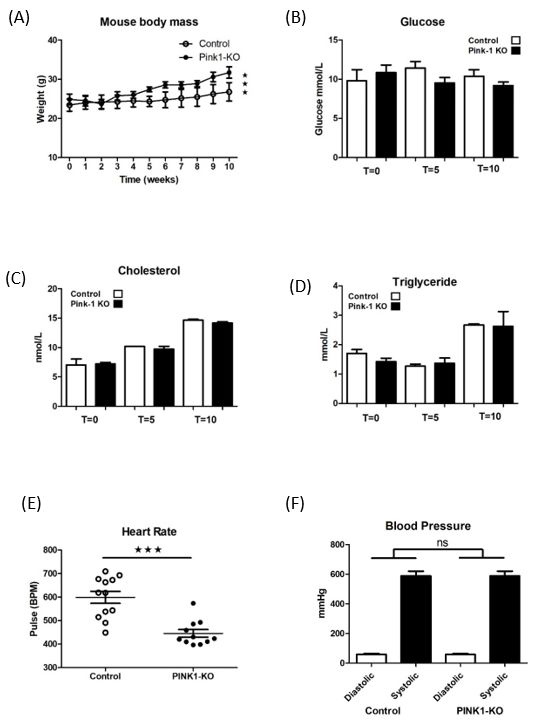
Int. J. Mol. Sci. 2021, 22, x FOR PEER REVIEW                                                                                              7 of 15

Int. J. Mol. Sci. 2021, 22, 9993                                                                                  7 of 14
                                    not medial VSMCs. This was notably increased in the plaque in the absence of Pink1
                                    (Figure 4H).

                                                  Pink1-KO
                                      Figure4.4.Pink1-KO      ApoE    −/− mice have reduced VSMCs and extracellular plaque components.
                                    Figure                 ApoE   −/− mice have reduced VSMCs and extracellular plaque components. Quan-
                                    tification  of plaque
                                      Quantification       regionsregions
                                                       of plaque      by immunohistochemistry      for (A)for
                                                                             by immunohistochemistry        VSMC   (a-SMA+),
                                                                                                              (A) VSMC        (B) cap
                                                                                                                        (a-SMA+),   (B)thickness,
                                                                                                                                        cap thick-
                                    (C)  extracellular
                                      ness,             collagencollagen
                                             (C) extracellular     (sirius red), (D)red),
                                                                            (sirius  elastin
                                                                                          (D)abundance   (Verhoefff(Verhoefff
                                                                                              elastin abundance     Van Gieson)
                                                                                                                              Vanstain,  (E) mac-
                                                                                                                                   Gieson)   stain,
                                    rophages    (mac3+),  (F) lipid   void area, (G) necrotic area areas, and  (H) hexokinase  2 abundance.
                                     (E) macrophages (mac3+), (F) lipid void area, (G) necrotic area areas, and (H) hexokinase 2 abun-        Re-
                                    gions of stained plaque (n = 9–15). (ns—non significant), Student t-test. * p ≤ 0.05, ** p ≤ 0.01*** p ≤
                                      dance. Regions of stained plaque (n = 9–15). (ns—non significant), Student t-test. * p ≤ 0.05,
                                    0.001 vs. control.
                                     ** p ≤ 0.01, *** p ≤ 0.001 vs. control.
Int. J. Mol. Sci. 2021, 22, 9993 8 of 14
Table 1. Atherosclerosis histology Pink1-KO ApoE−/− . Left columns atherosclerotic plaque areas
SMA, Mac, cap thickness, collagen, elastin areas, lipid void area, necrotic area and areas with positive
hexokinase 2-stained areas in control and Pink1-KO mice. Data are +/−SEM, * p ≤ 0.05, ** p ≤ 0.01,
*** p ≤ 0.001 for control mice vs. Pink1-KO mice.
Control (n = 6) Experimental (n = 5)
Pink1+/+ ApoE−/− Pink1-KO ApoE−/−
12.59 16.69
Aortic plaque area (%)
+/−0.19 +/−0.99
Control (n = 15) Experimental (n = 11)
Pink1+/+ ApoE−/− Pink1-KO ApoE−/−
Aortic root per plaque area (µm2 ) 155,109 124,191
+/−SEM +/−81,716 +/−15,684
35,168.48 8562.45
SMA-positive area (µm2 ) +/−SEM
+/−3333.19 +/−1014.09 ***
9.06 5.29
Cap thickness (µm) +/−SEM
+/−1.04 +/−0.68
20,024.56 6646.79
Collagen positive (µm2 ) +/−SEM
+/−2519.33 +/−1744.31 ***
Elastin-positive area (µm2 ) 98,687.32 49,638.60
+/−SEM +/−23,026.61 +/−17,719.22 *
5377.96 6326.55
MAC-positive area (µm2 ) +/−SEM
+/−1108.07 +/−1436.95
15,567.87 12,989.68
Lipid area (µm2 ) +/−SEM
+/−1558.28 +/−2256.87
19,150.21 21,470.12
Necrotic area (µm2 ) +/−SEM
+/−1449.72 +/−2669.77 **
5500.82 7953.43
Hexokinase 2 area (µm2 ) +/−SEM
+/−379.00 +/−1005.76 *
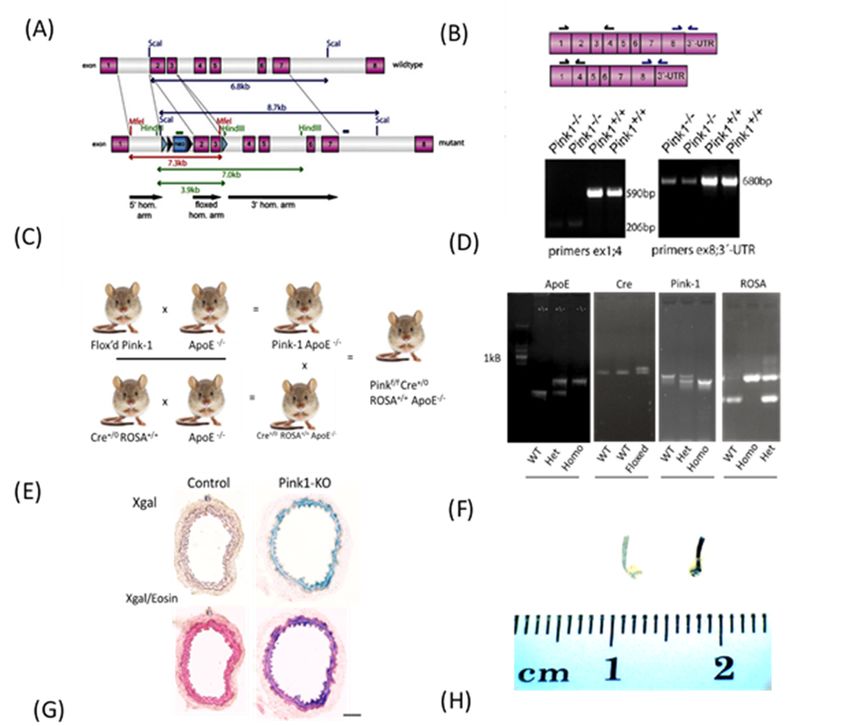
2.5. In Vitro Studies
Having identified Pink1 as having a role in VSMC abundance in the plaque, we
decided to characterise their energetic response in vitro. We tested their reliance of oxidative
and glycolytic metabolism using the XF24 bioanalyser (Agilent, Santa Clara, CA, USA)
for isolated cells and OroborusTM O2K for whole aortic vascular tissues. The activity of
these pathways could then be used to predict if there was a direct effect on their energetic
response and how this might correlate to their viability and synthetic capacity in the plaque.
To identify if Pink1 was essential for energetic switching, we first took wild-type cells
(Pink+/+) only and assessed change in glycolysis as an increased extracellular acidification
rate (ECAR) when the oxygen consumption rate (OCR) was inhibited. We took the basal
unihibited rate as the control rate and compared any change relative to this internal control
(Figure 5A,B). Using the Seahorse XF24 methodology allows this switch in the same cell line
to be made at the same time for both parameters. We found that a reproducible switching
effect was possible in wild-type VSMCs after titrating metabolic inhibitors oligomycin
(complex V) and rotenone (complex I) and myxothaixzol (complex III). We found that when
mitochondrial metabolism was suppressed by as little as 0.5 µM oligomycin, it resulted in
~25% suppression of respiration (Figure 5A) and this was sufficient for a commensurate
switch and increase in glycolysis to occur (Figure 5B) and quantified in supplemental
Table S1.Int. J. Mol. Sci. 2021,Int.
22,J.9993
Mol. Sci. 2021, 22, x FOR PEER REVIEW 9 of 14 10
Pink1-KO
Figure 5.ApoE ApoE −/− mice have reduced respiratory capacity and ability to switch energetics
Figure 5. Pink1-KO −/− mice have reduced respiratory capacity and ability to switch energetics to glycolysis compared
to wild type. (A) Inhibition
to glycolysis of mitochondrial
compared to wild type. respiration in Pink1+/+
(A) Inhibition wild-type VSMC
of mitochondrial retains
respiration a switching
in Pink1+/+ effect by (B)
wild-
concomitant energetic
type VSMCswitching
retains a by upregulation
switching effect of
byglycolysis (ECAR).energetic
(B) concomitant (C) In contrast,
switchingPink1-KO cells have aofdecreased
by upregulation
basal oxygen consumption
glycolysis (ECAR). rate (C)
(OCR)In and sensitivity
contrast, to inhibition
Pink1-KO of mitochondrial
cells have a decreased basal respiratory
oxygenchain inhibitors; oligomy-
consumption
cin (Arrow 1), uncoupler FCCP (Arrow 2) and rotenone and mxyothiazol (Arrow 4). (D) Loss of compensatory switch to
rate (OCR) and sensitivity to inhibition of mitochondrial respiratory chain inhibitors; oligomycin
glycolysis after oligomycin (Arrow 1) glucose bolus (Arrow 3) and 2-deoxy-glucose inhibitor 2-DG (Arrow 4) (n = 5). (E)
(Arrow 1), uncoupler FCCP (Arrow 2) and rotenone and mxyothiazol (Arrow 4). (D) Loss of
Reduced mitochondrial oxygen consumption in Pink1 KO aortic tissue after high-fat diet both basally and specifically at
complex I- compensatory
and IV-dependent switch to glycolysis
respiration. after oligomycin
(F) Confocal images (Arrow 1) glucoseVSMC
of mitochondrial bolus (Arrow
α-SMA 3) and 2-deoxy-
(green) (i–iv), mitochon-
glucose
drial abundance inhibitor
(red) 2-DG
(ii–v) with (Arrow
nuclear 4) (n
dapi = 5).co-localised
(blue) (E) Reduced mitochondrial
combined channels oxygen consumption
to compare in Pink1
gross mitochondrial mass
abundanceKO aorticwild-type
between tissue after high-fatcontrol
(Pink1+/+), diet both basally
(upper) andand
Pink1specifically
KO (lower) at (n
complex I- and
= 12) (scale IV-dependent
20 µm). One-way ANOVA
with Dunnett’s post hoc (F)
respiration. test Confocal
(n = 5), * pimages
≤ 0.05, ***
of pmitochondrial
≤ 0.001 vs. control.
VSMC α-SMA (green) (i–iv), mitochondrial
abundance (red) (ii–v) with nuclear dapi (blue) co-localised combined channels to compare gross
mitochondrial mass 3. Discussion
abundance between wild-type (Pink1+/+), control (upper) and Pink1 KO (lower)
(n = 12) (scale 20 µm).Loss One-wayof Pink1
ANOVA during atherogenesis
with Dunnett’s resulted
post hoc * p ≤ 0.05, *** p ≤
test (n =in5),VSMC-specific changes
0.001 in cell
vs. control. extracellular matrix components independent of total plaque abundance. While the VS
component of the vessel is high, their numeracy in the plaque is relatively low and s
Then, using explant aortic VMSCs derived from control and Pink1-KO mice, we mea-
change in total plaque quantity would be predicted, especially as loss of VSMC viab
sured their rate of oxygen consumption (Oroboros Instruments, Innsbruk, Austria). In the
by itself does not drive plaque expansion. However, a reduction in VSMC content
absence of Pink1, there was a marked reduction in basal oxygen consumption (Figure 5C).
collagen is critical to the mechanical strength of the plaque that ultimately drives pl
Addition of 1 µM oligomycin inhibited ATP synthase (Arrow 1) and decoupled electron
rupture, heart attacks and stroke. Though we did observe a decrease in Pink1 heart
transport from ATP to be quantified. This rate plateaued in both cell lines creating a newInt. J. Mol. Sci. 2021, 22, 9993 10 of 14
baseline which remained unchanged after addition of the respiratory uncoupler carbonyl
cyanide m-chlorophenyl hydrazone (CCCP, 1 µM) (Arrow 2) or rotenone, mxyothiazol
(Arrow 4). Using the XF24 bioanalyser (Agilent), it was possible to simultaneously mea-
sure the glycolytic response in intact cells and in paired repeats (Figure 5D). Extracellular
acidification (milli-pH) is a measure of glucose conversion of lactic acid as the end product
of glycolysis which is pumped from the cytosol to the extracellular environment. We
predicted that Pink1-KO would not be able to increase glycolysis when oxygen-dependent
respiration was compromised by oligomycin (Arrow 1). Initially, both lines increased
ECAR (milli-pH) during an initial equilibration phase over the first 50 min. Addition of
a glucose bolus (Figure 5B—Arrow 3) drove a more robust wild-type glycolytic response
over the next interval, in contrast to a slower and more delayed response from Pink1-KO
cells, until all rates were inhibited with deoxyglucose and rotenone/myxothoazol (Arrow 4)
(Supplemetal Table S1). This switching effect was then plotted relative to both OCR and
ECAR (Supplemental Figure S2). To further isolate which part of the respiratory chain may
be responsible in vivo for the Pink1-KO energetic response, we took fresh whole aorta from
littermate control transgenic and knockout animals after 10 weeks high-fat diet (Figure 5E).
Using control Pink1+/+ wild-type aorta, we ran paired samples with Pink1-KO mice aorta.
Basal respiration was again compromised in Pink1-KO samples. We then proceeded to
sequentially stimulate and inhibit each respiratory complex in turn. The residual rate pro-
vides a measure of the contribution of each complex to total respiration. This was achieved
using the metabolic inhibitors oligomycin (complex V), rotenone and mxyothiazol (complex
I/III) (Sigma Aldrich Ltd. Gillingham, UK) and tetramethyl-p-phenylenediamine (TMPD)
as an artificial complex IV substrate until oxygen exhaustion occurred in the 02K chamber.
This revealed a significant defect in complex I- and IV-dependent respiration.
3. Discussion
Loss of Pink1 during atherogenesis resulted in VSMC-specific changes in cell and
extracellular matrix components independent of total plaque abundance. While the VSMC
component of the vessel is high, their numeracy in the plaque is relatively low and so no
change in total plaque quantity would be predicted, especially as loss of VSMC viability by
itself does not drive plaque expansion. However, a reduction in VSMC content and collagen
is critical to the mechanical strength of the plaque that ultimately drives plaque rupture,
heart attacks and stroke. Though we did observe a decrease in Pink1 heart rate, this did
not translate to a change in blood pressure. The mechanism for this is unclear but could
relate to dynamic changes in mitochondrial function in both cardiac and vascular tissues.
Nevertheless, these results, and the calculation of a vulnerability index, do suggest that
Pink1 protects against atherosclerosis. This study links Pink1 to mitochondrial energetic
dysfunction and plaque stability.
While histological analysis of plaque from aortic valves confirmed that loss of Pink1
decreased the VSMC population, there was no change in total plaque abundance or in
the Mac-3+ inflammatory component of the plaque. The loss of extracellular matrix
components and reduced abundance at such an early time point suggests that future
studies should protract the high-fat feeding regime. Longer time points may have more
significant effects to plaque structure and could be useful in modelling vulnerable plaque
phenotypes found in some human lesions. Longer feeding regimes could also alter plaque
remodelling and open the opportunity of testing plaque stabilising compounds. However,
there are limitations in the number of histological sections possible at the aortic sinus and
this limits quantification for other makers of interest such as Masons Trichrome and of
low-abundance markers such as Ki67 for proliferation and cleaved caspase 3 for apoptosis.
Indeed, measures of plaque cap thinning in combination with other histological measures
may provide a particularly useful index in this model.
All cells will use a mixture of mitochondrial and glycolytic metabolism but as VSMCs
age in the plaque as mitochondrial dysfunction increases. Previously, we found elevated
Pink1 in the plaque cap of human carotid atherosclerosis samples [8]. Here, we find thatInt. J. Mol. Sci. 2021, 22, 9993 11 of 14
Pink1 appears to be important in mediating the switch between mitochondrial respiration
and glycolysis. Normally uncoupling respiration mimics an energetic dysfunction and
forces the respiratory complexes to work at the maximal rate. The lack of response in
both wild-type and Pink1-KO cells here suggests that respiration in these cells is already
working at full capacity with no spare capacity when challenged. Rotenone inhibits
complex I activity and mxyothiazol is a competitive inhibitor of ubiquinol at the bc1
complex and together these inhibitors block the transfer of electrons through iron sulphur
complexes and their reduction to molecular oxygen, thereby inhibiting residual respiration.
It is during this phase that we find that Pink1 appears important to allow the cells to
switch to glycolysis. When then testing if these deficiencies induced in isolated cells
occur in vivo during atherogenesis, we find respiratory chain defects in the first and last
enzymes in the respiratory chain of fresh aortae. Triple staining VSMC α-SMC actin (green)
nuclear counterstain (blue) co-localised to total mitochondria content using mitotraker
red (Sigma Aldrich Ltd. Gillingham, UK) revealed no difference in VSMC mitochondrial
content (Figure 5F) and or mitochodrial DNA copy number (Supplemental Figure S1 (i–iv)).
Hexokinase is a key enzyme associated with enhanced glycolysis and is increasingly
recognised as part of the energtic survival nexus [16]. If the regulation of this switching
effect could be targeted to the plaque via small molecules early in disease, than this has
the potential to improve VSMC phenotype in the plaque. It could also help other cells
and tissue in which mitochondrial energetics have been compromised. The fact that wild-
type cells and tissues require Pink1 for an intact energetic switching response has led
us to start screening for VSMC-specific compounds that can switch “on demand” from
oxygen-depedent respiration to glycolysis and which may benefit VSMC longevity in
the plaque.
Improved VSMC survival and modest increased proliferation would be predicted to
strengthen the plaque cap and could theoretically delay rupture. The work of Juan Bolanos [17]
suggests that significant rewiring of glycolytic homeostasis does occur during Pink1 ab-
lation. However, these studies used mouse embryonic fibroblasts, (MEF’s) that relied on
stem cell factors such as Lin28, which we have also shown to be an important mechanism
in glycolytic switching [18]. We belive the terminally differentiated VSMCS used in our
study to be more relevant to studying human disease.
In our study, we find that WT cells which retain Pink1 can switch energetics when
oxphos is inhibited to then use glycolysis. In Pink1, KO oxygen respiration (OCR) is lower
basally and fails to increase glycolysis (ECAR) when stimulated. Tentatively, we would
suggest that Pink1 might tether a pool of mitoHexII to ensure a shift toward glycolysis can
occur effectively when mitochondrial respiration is compromised
Indeed the work of Pan et al. [12] has shown that hexokinase 2 reduces calcium
overload in coronary endothelial cells of type 2 diabetic mice and that may also mediate a
beneficial effect here in vascular smooth muscle. Here, we explored how wild-type cells
could be switched from dependence on mitochondrial energetics to glycolysis. In the
future, it is hoped that wild-type VSMCs in the plaque could be pharmaceutically targeted.
Indeed, designing appropriate targeting vehicles, such as tagged microvesicles that could
be loaded with drug treatments during atherosclerosis is currently planned.
4. Materials and Methods
4.1. Generation of Pink1 Mice
Flox’d Pink1 mice [15] were bred with standard ApoE homozygous mice from Jackson
labs (B6.129P2ApoEtm1Unc /J—stock#002052). Mice homozygosis for both alleles (1:16)
were genotyped and then crossed with SMMHC-CreErT2 mice [18] from the University of
Cambridge previously gifted by Professor Stefan Offermans (Max Planck Institute, Munich,
Germany) under MTA to the University of Glasgow. These mice were previously crossed
with a ROSA26 allele on the same C57/Blk/6 background. This created a unique Pink1
knockout mice at a ratio of 1:64 live births, termed here as knockout (MHC-Cre+/0 ErT2
Pink1f/f ROSA+/+ ApoE−/− ). To titrate tamoxifen dose and Cre leak, we performed a dose–Int. J. Mol. Sci. 2021, 22, 9993 12 of 14
response study by IP injection in Pinkf/f mice, including uninduced controls. All animal
studies were approved by the UK Home office and met the University of Glasgow ethical
review process.
4.2. Breeding and Feeding Regime
For breeding and husbandry, mice were fed a standard chow Cat#801002 (Special Diet
Services, UK). This is a complete diet with 45% Starch, 17% fibre, 14% protein, 4% sugar sup-
plemented with amino acids and micromineral and vitamins; see https://sdsdiets.com/wp-
content/uploads/2021/02/rm1p-e-fg.pdf (Access date 8 September 2021). For atherogen-
esis studies, littermates were weaned at 4–6 weeks of age and transferred onto a “Western”
high-fat diet (HFD) pellet supplied by Envigo, UK Cat#TD02028; see https://insights.
envigo.com/hubfs/resources/data-sheets/02028.pdf (Access date 8 September 2021). For
Pink1 excision, experimental animals were briefly fed a custom modified variant of TD02028
with 0.5 mg/g of tamoxifen base and red dye to distinguish from standard white HFD.
Mice were then humanely culled and aortic vessels harvested at the study end at 16 weeks
of age under an approved Home Office Licence.
4.3. Mice Characterisation
Mice were routinely weighed with blood pressures and heart rates taken using the
tail-cuff method at 0, 5 and 10 weeks (Visitech System BP-2000 analyser). The transgenic
mice genome also incorporated a Cre responsive flox’d STOP codon for the β-galactosidase
reporter enzyme in the ROSA26 safe harbour locus. After genotyping with PCR and
Taqman probes (Transnetyx, Cordova, TN, USA), we confirmed Cre activity and Pink1
knockdown in these mice by co-incubating aortic rings from frozen sections with X-gal
substrate to provide a blue stain where gene knockout occurred across the entire vessel
wall. These were then counterstained with haematoxylin and eosin. This method was also
repeated in fresh explant abdominal aorta VSMCs, as the β-galactosidase enzyme retains
activity both in frozen sections and after mild fixation [19]. A plaque vulnerability index as
proposed by Bo Li et al. was calculated based on the of % macrophages + % lipids/% SMC
+ % Collagen [20].
4.4. Tissue Microdissection and Cell Sample Preparation
Whole aortic and heart tissue specimens were obtained after humane culling and rapid
removal en bloc rather perfusion fixation as we found it difficult to maintain consistent
plaque architecture. Fresh tissue samples were used for oxygen respirometry experiments
and explant cell culture as previously described, while tissues for histology were post fixed
in 4% paraformaldehyde for immunohistology or portions embedded in OCT compound
for frozen sections for X-gal staining. Primary VSMCs were explant cultured in 10% serum
supplemented with DMEM ( Sigma Aldrich Ltd., Gillingham, UK) and immunocytochem-
istry then used to determine lineage for myosin heavy chain (MHC), and α-smooth muscle
cell actin (SMA) as previously described [7,10].
4.5. Generation of Pink1 Cell Lines
Pink1 excision was previously confirmed by Southern blotting, RT-PCR by Glasl et al. [15]
and DNA genotyping and Western blot performed by ourselves [8] during breeding. Pink1-
KO cell cells were routinuely generated from aortic explants as previously described and
Pink1 KO in vivo confirmed by using the X-gal reporter in the ROSA26 locus. Briefly, tissues
were harvested, washed in PBS and mounted in OCT compound and frozen sections cut at
5 µm intervals. For HFD animals in which tissues and cells were excised, these were treated
with the metabolised form of tamoxifen, a low-dose hydroxytamoxifen (OHT), 100 nM,
for a minimum of 48 hrs (Sigma Aldrich 68047-06-3) and then washed in 1 × PBS and
fixed at room temperature for 5 min in 4% paraformaldehyde, supplemented with 0.1 N
sodium PO4 . Specimens were incubated overnight in 1 mL of staining buffer—200 mMInt. J. Mol. Sci. 2021, 22, 9993 13 of 14
MgCl2 , 400 mM Ferricynanide, and 400 mM Ferrocynanide, X-gal solution in PBS—and
then briefly washed in MQ and visualised.
4.6. Seahorse XF24 and Oxygraph Whole Tissue Oxygen Respirometry
Fresh mouse aortic tissues were permeabilised for 15 min with Saponin at 1:100 di-
lution of a 5 mg/mL solution of Saponin (Sigma Aldrich S4521). This was required for
mitochondrial assays only, which disrupts the cholesterol rich plasma membrane and per-
mits entry of substrates into the mitochondrial without losing integrity of the cholesterol
poor mitochondrial outer membrane. Samples were further washed 3 × 5 min in BIOPS
preservation solution (10 mM Ca-EGTA buffer, 0.1 µM free calcium, 20 mM imidazole,
20 mM taurine, 50 mM K-MES,0.5 mM dithiothreitol, 6.56 mM MgCl2 , 5.77mM ATP, 15 mM
phosphocreatine, pH 7.1) at 4 ◦ C on a sample rotator at 25 rpm before paired tissue samples
(~10 mg w/w) were added to the respirometry chambers (Oroboros Instruments, Innsbruck).
Complex I respiration was energised with glutamate (10 mM) and malate (5 mM) and ADP
before inhibition with rotenone (1 mM) to reveal a complex I-dependent oxygen consump-
tion rate (OCR). Stimulation of complex II-dependent respiration was made by addition of
the complex II substrate succinate (5 mM) and then inhibited by antimycin (5 mM). Com-
plex IV respiration was stimulated with the electron donor ascorbate and artificial complex
IV substrate TMPD (20 mM N,N,N0 ,N0 -Tetramethyl-p-phenylenediaminedihydrochloride).
A final addition of excess cytochrome c (4 mM) was used to show no further increase in
respiration and confirmed the integrity of the respiratory chain preparation. All rates were
normalised to dry tissue mass and immunohistology confirmed cell type and cell density
determined for each region by eosin and haematoxylin (H&E) staining. The XF24 Sea-
horse assay was used intact cells for mitochondrial and glycolytic determination. Primary
explanted murine VSMCs were seeded into microplate with 100 µL at 15,000 cells/well
for normalistion. A calibration plate was prepared with 0.5 mL of XF calibrant solution.
Cell plate medium was exchanged with 0% FCS Seahorse media on the day of the assay,
with a minimum of five technical replicates per biological repeat. All injection ports were
prepared as previously described [8].
4.7. Histology and Scoring Analysis
Histology and Oil red O staining were performed as previously described [2,6,7,20].
Goat anti-rabbit HRP secondary antibodies (A6154, Sigma) and Vector labs DAB secondary
HRP staining kit (SK4100) for stain visualisation including secondary negative control and
an infiltrating breast ductal carcinoma used a positive control (AMSBIOTM CU2005/17).
Images were captured and scored using an Olympus IX73 and BX51 microscopes using
Adobe PhotoshopTM and Olympus CellSenS software. Plaque cap thickness was chosen by
taking multiple measures at the region SMA+ that represented the plaque cap boundary
and therefore the region with greatest vulnerability.
Supplementary Materials: The following are available online at https://www.mdpi.com/article/
10.3390/ijms22189993/s1.
Author Contributions: J.R.M. conceived the research and drafted the script; C.K.D. performed the
in vitro assays and edited the script. J.B. and A.C. (Andy Carswell) performed the immunohistology
and cell scoring. E.F. explanted the primary cell lines. A.C. (Amrita Chanderseka) and M.S. performed
the energetic assays. All authors have read and agreed to the published version of the manuscript.
Funding: This work was supported under the BHF Centre of Excellence research award (BHF
RE/13/5/30177 and BHF Foundation Studentship FS/14/61/31284.
Institutional Review Board Statement: This study was conducted according to the guidelines of the
University of Glasgow animal ethics panel and approved under the Home Office Licence.
Data Availability Statement: Access to datasets are available upon request.
Acknowledgments: We would like to thank the Offerman and Bennett labs for their kind donation
of the MHC Cre-ErT2 mice held under MTA agreement jointly through the University of Cambridge,Int. J. Mol. Sci. 2021, 22, 9993 14 of 14
University of Glasgow and Helmholz Zentrum München v23012013. We would also like to thank
Angelia Hummel from, Helmholtz München, Germany and Wurst lab for the original flox’d Pink1
mice. We also acknowledge the contributions from Day, D.; Baker, C. and Schmidt, F.
Conflicts of Interest: The authors declare no conflict of interest.
References
1. Gray, K.; Kumar, S.; Figg, N.; Harrison, J.; Baker, L.; Mercer, J.; Littlewood, T.; Bennett, M. Effects of DNA damage in smooth
muscle cells in atherosclerosis. Circ. Res. 2015, 116, 816–826. [CrossRef] [PubMed]
2. Mercer, J.R.; Cheng, K.K.; Figg, N.; Gorenne, I.; Mahmoudi, M.; Griffin, J.; Vidal-Puig, A.; Logan, A.; Murphy, M.P.; Bennett, M.
DNA damage links mitochondrial dysfunction to atherosclerosis and the metabolic syndrome. Circ. Res. 2010, 107, 1021–1031.
[CrossRef] [PubMed]
3. Nahapetyan, H.M.M.; Grousset, E.; Faccini, J.; Grazide, M.H.; Mucher, E.; Elbaz, M.; Martinet, W.; Vindis, C. Altered mitochondrial
quality control in Atg7-deficient VSMCs promotes enhanced apoptosis and is linked to unstable atherosclerotic plaque phenotype.
Cell Death Dis. 2019, 10, 119. [CrossRef] [PubMed]
4. Bennett, M.R.S.; Owens, G.K. Vascular Smooth Muscle Cells in Atherosclerosis. Circ. Res. 2016, 118, 692–702. [CrossRef] [PubMed]
5. Bennett, M.R.; Littlewood, T.D.; Schwartz, S.M.; Weissberg, P.L. Increased sensitivity of human vascular smooth muscle cells from
atherosclerotic plaques to p53-mediated apoptosis. Circ. Res. 1997, 81, 591–599. [CrossRef] [PubMed]
6. Mercer, J.R.; Yu, E.; Figg, N.; Cheng, K.K.; Prime, T.A.; Griffin, J.L.; Masoodi, M.; Vidal-Puig, A.; Murphy, M.P.; Bennett, M.R. The
mitochondria-targeted antioxidant MitoQ decreases features of the metabolic syndrome in ATM+/-/ApoE-/-mice. Free Radic.
Biol. Med. 2012, 52, 841–849. [CrossRef] [PubMed]
7. Mercer, J.; Figg, N.; Stoneman, V.; Braganza, D.; Bennett, M.R. Endogenous p53 protects vascular smooth muscle cells from
apoptosis and reduces atherosclerosis in ApoE knockout mice. Circ. Res. 2005, 96, 667–674. [CrossRef] [PubMed]
8. Docherty, C.K.; Carswell, A.; Friel, E.; Mercer, J.R. Impaired mitochondrial respiration in human carotid plaque atherosclerosis: A
potential role for Pink1 in vascular smooth muscle cell energetics. Atherosclerosis 2018, 268, 1–11. [CrossRef] [PubMed]
9. Salabei, J.K.; Hill, B.G. Mitochondrial fission induced by platelet-derived growth factor regulates vascular smooth muscle cell
bioenergetics and cell proliferation. Redox Biol. 2013, 1, 542–551. [CrossRef] [PubMed]
10. Matthews, C.; Gorenne, I.; Scott, S.; Figg, N.; Kirkpatrick, P.; Ritchie, A.; Goddard, M.; Bennett, M. Vascular smooth muscle cells
undergo telomere-based senescence in human atherosclerosis: Effects of telomerase and oxidative stress. Circ. Res. 2006, 99,
156–164. [CrossRef] [PubMed]
11. He, L.; Zhou, Q.; Huang, Z.; Xu, J.; Zhou, H.; Lv, D.; Lu, L.; Huang, S.; Tang, M.; Zhong, J.; et al. PINK1/Parkin-mediated
mitophagy promotes apelin-13-induced vascular smooth muscle cell proliferation by AMPKalpha and exacerbates atherosclerotic
lesions. J. Cell. Physiol. 2019, 234, 8668–8682. [CrossRef] [PubMed]
12. Pan, M.; Han, Y.; Basu, A.; Dai, A.; Si, R.; Willson, C.; Balistrieri, A.; Scott, B.T.; Makino, A. Overexpression of hexokinase 2
reduces mitochondrial calcium overload in coronary endothelial cells of type 2 diabetic mice. Am. J. Physiol. Cell Physiol. 2018, 6,
1522–1563. [CrossRef] [PubMed]
13. Tan, V.P.; Smith, J.M.; Tu, M.; Yu, J.D.; Ding, E.Y.; Miyamoto, S. Dissociation of mitochondrial HK-II elicits mitophagy and confers
cardioprotection against ischemia. Cell Death Dis. 2019, 10, 730. [CrossRef] [PubMed]
14. Grootaert, M.O.J.; Roth, L.; Schrijvers, D.M.; De Meyer, G.R.Y.; Martinet, W. Defective Autophagy in Atherosclerosis: To Die or to
Senesce? Oxid. Med. Cell. Longev. 2018, 2018, 7687083. [CrossRef] [PubMed]
15. Glasl, L.; Kloos, K.; Giesert, F.; Roethig, A.; Di Benedetto, B.; Kuhn, R.; Zhang, J.; Hafen, U.; Zerle, J.; Hofmann, A.; et al.
Pink1-deficiency in mice impairs gait, olfaction and serotonergic innervation of the olfactory bulb. Exp. Neurol. 2012, 235, 214–227.
[CrossRef] [PubMed]
16. Roberts, D.; Miyamoto, S. Hexokinase II integrates energy metabolism and cellular protection: Akting on mitochondria and
TORCing to autophagy. Cell Death Differ. 2015, 22, 248–257. [CrossRef] [PubMed]
17. Requejo-Aguilar, R.; Lopez-Fabuel, I.; Fernandez, E.; Martins, L.M.; Almeida, A.; Bolanos, J.P. PINK1 deficiency sustains cell
proliferation by reprogramming glucose metabolism through HIF1. Nat. Commun. 2014, 5, 4514. [CrossRef] [PubMed]
18. Docherty, C.K.; Salt, I.P.; Mercer, J.R. Lin28A induces energetic switching to glycolytic metabolism in human embryonic kidney
cells. Stem Cell Res. Ther. 2016, 7, 78. [CrossRef] [PubMed]
19. Takahashi, M.; Hakamata, Y.; Takeuchi, K.; Kobayashi, E. Effects of different fixatives on beta-galactosidase activity. J. Histochem.
Cytochem. 2003, 51, 553–554. [CrossRef] [PubMed]
20. Li, B.; Zhao, Y.; Liu, H.; Meng, B.; Wang, J.; Qi, T.; Zhang, H.; Li, T.; Zhao, P.; Sun, H.; et al. Visfatin Destabilizes Atherosclerotic
Plaques in Apolipoprotein E–Deficient Mice. PLoS ONE 2016, 11, e0148273. [CrossRef] [PubMed]You can also read