An Investigation into the Hydro-Climate Processes Impacting Aral Sea Region in Central Asia
←
→
Page content transcription
If your browser does not render page correctly, please read the page content below
Annals of R.S.C.B., ISSN:1583-6258, Vol. 25, Issue 4, 2021, Pages. 11692 - 11703
Received 05 March 2021; Accepted 01 April 2021.

 An Investigation into the Hydro-Climate Processes Impacting Aral Sea Region
 in Central Asia

 Sahibjamal Nietullaeva1,2*, Bayram Fayzullaev 1,2, Aykerim Karimova1,2,
 Nurmuxamed Shaudenbayev1,2
 1
 Nukus branch of Tashkent University of Information Technologies named after Muhammad Al-Khwarizmi, Nukus
 230100, Uzbekistan. E-mail: snietullaeva@bk.ru, karimovaajikerim4@gmail.com, nshaudenbaev@gmail.com
 2
 Department of Telecommunication Engineering, Nukus branch of Tashkent University of Information Technologies
 named after Muhammad Al-Khwarizmi, Nukus 230100, Uzbekistan. E-mail: fayzullaevbayram@gmail.com
 *Correspondence: snietullaeva@bk.ru

 ABSTRACT
 Since 1960, the anthropogenic activities had severely impacted the hydrological balance of the Aral Sea (AS),
 which has led to dramatic changes in the climate around the AS, likewise changes in ambient temperatures and
 potential evapotranspiration. Moreover, the rainfall patterns are not homogenous in the study region. Trend
 analyses are performed on the monthly gridded climate data of rainfall and temperature, potential
 evapotranspiration, and relative humidity using the Mann-Kendall (MK) test for the period 1901-2017 years.
 The outcomes of this study investigated a significant difference (negative) between precipitation and
 evapotranspiration in AS region, during the analysis period of 1901-1960, and 1960-2017. Analysis of air
 temperature around the AS further suggests the positive trend of air temperature contrary to a significant
 difference between precipitation and evapotranspiration negative trend, which means that the annual
 hydrological budget remarkably decreased in the regional analysis. The present study investigates the changes
 in hydro-climate processes observed over the AS region, as in recent few decades global warming impacted the
 socioeconomic and environmental conditions of this region.

 Keywords
 Aral Sea, Mann-Kendall test,temporal climate change, water.

 1. Introduction
 Since 1960, the AS was the fourth largest lake in the world with a surface area equals 65˟103
 km2. Considered as a terminal lake, the AS is the principal source of water in the Amu Darya and
 Syr Darya rivers (Gafforov et al., 2020; Gaybullaev, Chen, & Gaybullaev, 2012; Small, Sloan, &
 Nychka, 2001). After 1960, the anthropogenic activities in AS has severely affected the
 hydrological cycle of the sea (Micklin, 2000). Due to the large volumes of surface water
 evapotranspiration, the main source of water supply to the AS was sharply reduced.

 Due to the rate of evapotranspiration (
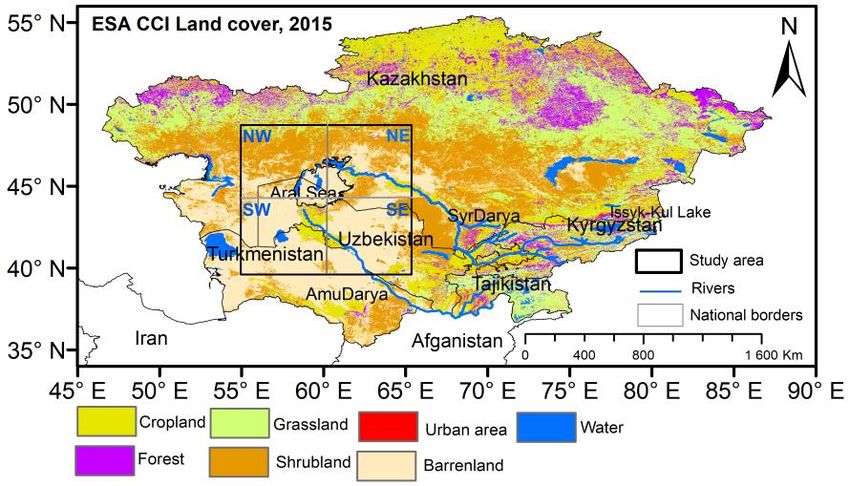
Annals of R.S.C.B., ISSN:1583-6258, Vol. 25, Issue 4, 2021, Pages. 11692 - 11703
Received 05 March 2021; Accepted 01 April 2021.

 Berdimbetov, Nietullaeva, & Yegizbaeva, 2021; T. T. Berdimbetov, Zhu-Guo, Chen, & Sana,
 2020), hydrological and hydro-meteorological (Bortnik & Chistyaevaya, 1990), water
 management (Micklin, 2000), one of the main causes of the AS basin, the AS water balance
 change based on data from satellite remote sensing (T. T. Berdimbetov et al., 2020; Cre´taux &
 Berge´-Nguyen, 2014; Lioubimtseva, 2014). Assessment of the volumes of atmospheric
 precipitations (1986-2001) on the Amu Darya and the Syr Darya, based on the Global Weather
 Climatology Center (GPCC) (Nezlin, Kostianoy, & Lebedev, 2004), the hydro physics of the AS
 in the first decade of the 21 stcentury research on chemical and hydro-biological changes
 (Zavialov et al., 2011) and other aspects.

 2 Study area, data, and methodology

 2.1 Study area
 The research, consider in AS, in the Central Asian region (Fig.1). The AS region, geographic
 location of the AS, and the surrounding area are within a radius of 500 km (Abdurahimov &
 Kurbanov, 2015). The full study territory consists of the southern part of Kazakhstan (43°00'N,
 68°30'E), the northwest part of Uzbekistan (38°00'N, 68°00'E) and the northern part of
 Turkmenistan (41°49'N, 60°16'E). In terms of geographical aspects, the territory is a predominant
 arid region and its elevation is 56 meters above the mean sea level (source). The AS and the AS
 Region are administratively located in Uzbekistan and Kazakhstan. The AS covers the lower
 reaches of the Amu Darya and the Syr Darya rivers (Gafforov et al., 2020), as well as the AS
 region, and the Aral desert (Aral-Kum) as well, which emerged in the north-eastern and southern
 parts.

 http://annalsofrscb.ro 11693
Annals of R.S.C.B., ISSN:1583-6258, Vol. 25, Issue 4, 2021, Pages. 11692 - 11703
Received 05 March 2021; Accepted 01 April 2021.

 Figure 1. Study area: North-West (NW), North-East (NE), South-West (SW), South-East (SE).
 The territory of Kazakhstan, Uzbekistan, and Turkmenistan with major seven land cover
 categories (300 m spatial resolution). Land cover data from ESA CCI (European Space Agency,
 Climate Change Initiative) database

 2.2 Data
 This article uses a dataset from the Climatic Research Unit (CRU, 0.5°x0.5°)and National
 Oceanic and Atmospheric Administration (NOAA's, 0.5°x0.5°)global meteorological network.
 Meteorological data of monthly relative humidity (RHM) was archived from NOAA during
 1960-2015. While we used the monthly climatic variables of average temperature (TMP),
 precipitation (PRE), and potential evapotranspiration(PET) using CRU TS 4.0 (Harris, Osborn,
 Jones, & Lister, 2020) ranging from 1901-2015.

 2.3 Method
 In this article, several methods have been used to analyze the data. The Mann-Kendall (MK) test
 (Faustin Katchele, Ma, Yang, & Batebana, 2017; Kendall, 1975; Mann, 1945) was used to
 calculate the climate change trend around the AS in the last 117 years. It is possible to investigate
 the monotonous changes in trend using the MK test. The monotonic trend determines a gradual
 increase (decrease) changes over time, which can be either non-linear (Kendall, 1975; Xu,
 Takeuchi, & Ishidaira, 2003). In addition, the Sen’s Slope test analyzed the trend deviation level.
 The presented statistical data are based on FTI (First Time Interval: 1901-1960-give this interval
 in the abstract ) and STI (Second Time interval: 1960-2017) for the two phases of AS
 transformation and anomalous change in climate variables. We have divided (Fig. 1) the study
 area into four segments relative to the sea’s, namely NW (North-West), NE (North-East), SW
 (South-West), and SE (South-East). The main purpose of the division is to analyze which parts of
 the AS are more or less affected by climate change in the sea.

 In addition, a hydrological balance equation was introduced to assess the impact of the AS level
 change and the difference in − over the AS to the Sea budget (Benduhn & Renard, 2004;
 Zavialov et al., 2011). Here, the monthly evapotranspiration ( ) is calculated based on the
 Penman-Monteith equation (Beven, 1979).

 The following formula is given for the MK trendanalysis:
 −1

 = ( − )
 = +1
 =1

 1 − > 0
 (Tj − Ti) = 0 − = 0
 −1 − < 0

 Where is statistical trend, is the length of the time series data set and … stand for the
 observationsat times to , correspondingly.

 http://annalsofrscb.ro 11694
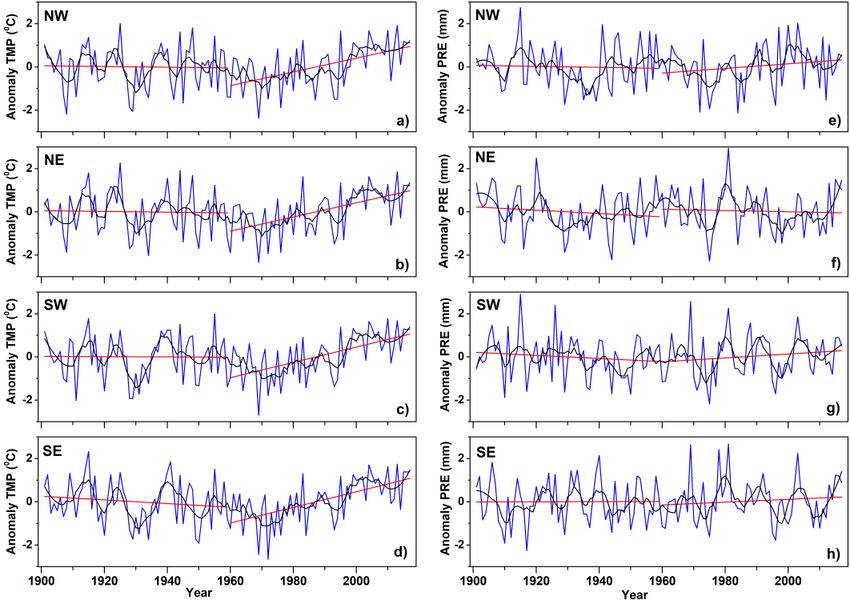
Annals of R.S.C.B., ISSN:1583-6258, Vol. 25, Issue 4, 2021, Pages. 11692 - 11703
Received 05 March 2021; Accepted 01 April 2021.

 According to the hypothesis of independent and randomly distributed randomvariables, the
 statistic is approximately normally distributed when ≥ 8, asfollows:

 ( ) = 0
 The variance ( 2 ) for the -statistic is defined by:
 − 1 2 + 5 − − 1 (2 + 5)
 2 =
 18
 Where is the number of tied groups and is the size of the ithtied group. As a result,the
 standardized (calculated in the case of MK) test statistics follow a normalstandardized
 distribution:
 −1
 > 0

 = 0 = 0
 +1
 < 0

 A significance test is determined based on the result of the value. The sign of either positive
 or negative is indicating an upward or downward trend of the testedvariable(Faustin Katchele,
 Ma, Yang, & Batebana, 2017).
 The time series of hydro parameters were calculated to attain the slope coefficient based on the
 trend line. Precisely, the slope coefficients of the linear regression were worked out by employing
 the following equation (Faustin Katchele, Ma, Yang, & Batebana, 2017):

 × =1 − =1 =1
 = 2 2
 =1 −( =1 )

 Where and were the values of the independent variable and the dependent variable in the
 year, respectively, and is the average number of years during the study period. Generally
 speaking, if > 0, the fluctuation of the dependent variable reveals an upward tendency,
 whereas if < 0, the fluctuation of the dependent variable reveals a downward tendency.
 3 Results

 3.1 Temporal trend of climate variables between 1901 and 2015 years
 An analysis of trend was performed on two-time intervals (give the time) (FTI and STI), of the
 anomalous climatic variables (TMP, PRE,PET, and RHM), using MK test (95% confidence
 level) and Sen's Slope methods (Tab. 1 and Fig. 2-3). Table 1 shows the tendency of anomaly
 climatic changes observed around the AS for two periods. In the initial analysis of the anomaly
 TMP change trend, we can see the same homogeneity trend in either of the four surrounding parts
 of the AS (NW, NE, SW, SE), but they differ from each other in time intervals. The lowest
 negative trend recorded in the FTI was recorded for all segments ( = −0.916 − 0.131),

 http://annalsofrscb.ro 11695
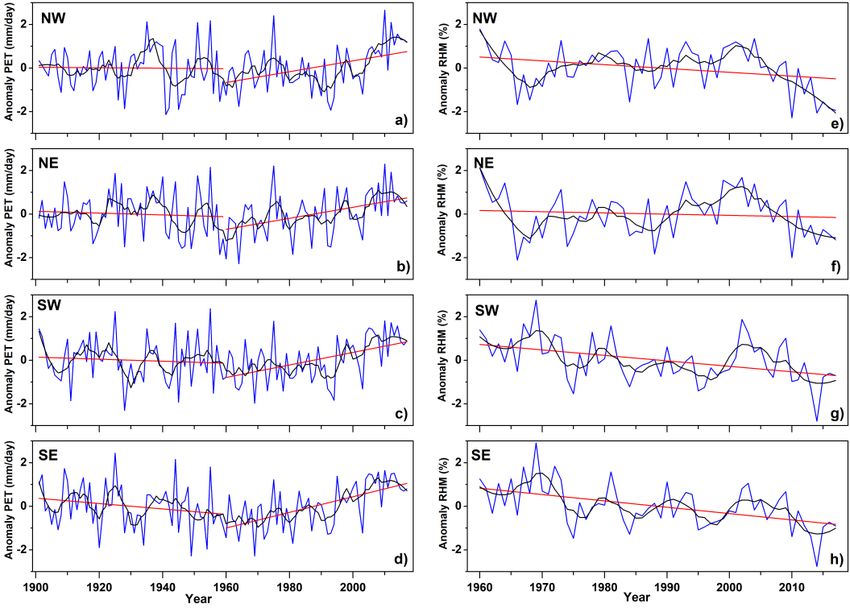
Annals of R.S.C.B., ISSN:1583-6258, Vol. 25, Issue 4, 2021, Pages. 11692 - 11703
Received 05 March 2021; Accepted 01 April 2021.

 and the largest negative trend was observed in SE (Sen’s Slope: -0.007), NE, and SW, with the
 same negative trend, ( = 3.653 4.162), while the average recorded trend in the southern AS
 increased to 7.73% over the northern part. When compared with the anomaly TMP trend in the
 southern part of the sea (Sen's Slope: 0.034) and North (Sen's Slope: 0.031), we can see a large
 slope change in the southern part of 8.82%. FTI was not significant ( > 0.005), whereas STI
 was significantly recorded in all parts ( < 0.005). Since, evapotranspiration changes are
 proportional to the change in air temperature (Beven, 1979), these homogenous PET changes are
 found robust in the above-mentioned two-time intervals.
 Table 1. MK test (Z) and Sen’s slope (Sen Slope) of time series of from anomaly climate
 variables over territory AS. Temperature (TMP), Precipitation (PRE), Potential
 evapotranspiration (PET), Relative humidity (RHM)
 Climate FTI STI
 Region
 variables Z Sen's slope Z Sen's slope

 NW ˗0.392 ˗0.003 3.653* 0.031

 NE ˗0.144 ˗0.001 3.936* 0.031
 TMP
 SW ˗0.131 ˗0.001 4.036* 0.034

 SE ˗0.916 ˗0.007 4.162* 0.034

 NW ˗0.549 ˗0.005 1.039 0.009

 NE ˗1.007 ˗0.008 ˗1.025 ˗0.009
 PRE
 SW ˗0.876 ˗0.005 1.025 0.010

 SE ˗0.183 ˗0.002 0.686 0.005

 NW 0.075 ˗0.001 2.918* 0.023

 NE ˗0.445 ˗0.004 3.201* 0.024
 PET
 SW ˗1.072 ˗0.009 3.498* 0.031

 SE ˗1.753* ˗0.013 4.671* 0.038

 NW ˗1.053 ˗0.009

 NE ˗0.615 ˗0.006
 RHM
 SW ˗1.819 ˗0.013

 SE ˗2.113 ˗0.018
 Note: *Indicates the two-tailed significance level (0.005) of the trend.

 We can see an unusual tendency in STI for irregular PRE, as the three regions of the AS were
 positive ( = 0.686 1.039), whereas a negative correlation was observed in the NE part

 http://annalsofrscb.ro 11696
Annals of R.S.C.B., ISSN:1583-6258, Vol. 25, Issue 4, 2021, Pages. 11692 - 11703
Received 05 March 2021; Accepted 01 April 2021.

 ( = −1.025), also FTI recorded negative anomalous precipitation trends ( = −1.007 −
 0.183).

 The RHM fluctuation trend was only investigated for the one-time interval, in STI, where the
 negative trend was observed in all parts of the AS, and the largest negative trend was observed in
 the Southeast part of the lake ( = −2.113, ˗ = 0.035), while the relatively small
 negative trend ( = −0.615, ˗ =0.539) belonged to the Northeast part of the lake.

 Figure 2. Comparison of change anomaly annual mean (a, b, c, d) Temperature (TMP, °C) and
 change anomaly annual (e, f, g, h) total precipitation (PRE, mm) for two-time intervals FTI and
 STI over territory around AS.

 http://annalsofrscb.ro 11697
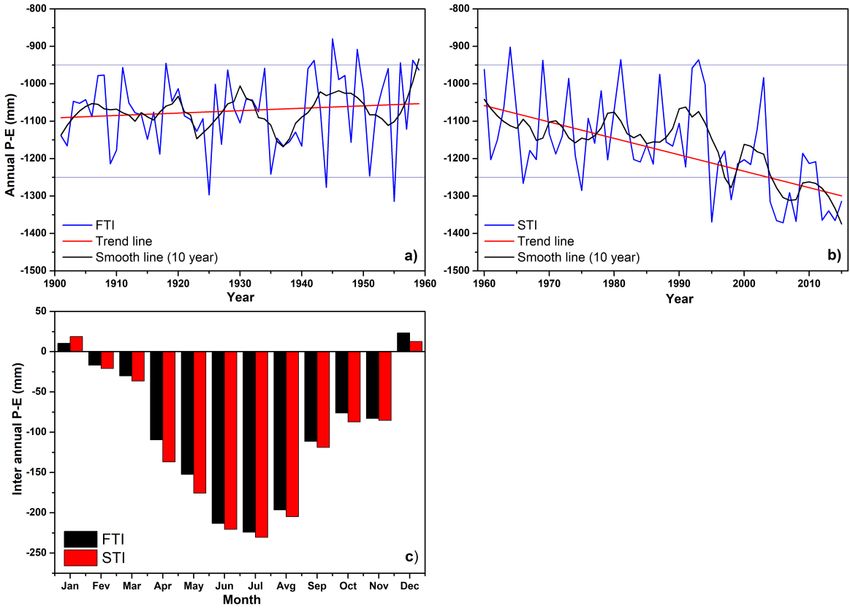
Annals of R.S.C.B., ISSN:1583-6258, Vol. 25, Issue 4, 2021, Pages. 11692 - 11703
Received 05 March 2021; Accepted 01 April 2021.

 Figure 3. Comparison of change anomaly annual mean (a, b, c, d) Potential evapotranspiration
 (PET, mm/day) for two-time intervals FTI and STI and change anomaly annual mean (e, f, g, h)
 humidity (%) from STI over territory around AS.The red line is a trend change for two-time
 intervals, and the black line is a decadal (10 years) smoothing change.
 3.2 An estimate of hydrologic changes over the Aral Sea

 The change in the AS water volume over the time ( / ) is due to several parameters such as
 river discharge ( ), groundwater inflow ( ), precipitation per unit area (P), evapotranspiration
 per unit area (E), sea area (S) and ˗ lake's surface area (Zavialov, 2011).

 = + + ( − )

 Here, we consider the underground water change ( ) to be zero as research findings show that
 the contribution of groundwater around the AS to the Aral hydrological budget is extremely low,
 and in other scientific sources, this parameter is constant or equal to zero (Benduhn & Renard,
 2004; Zavialov et al., 2011).

 The Amu Darya and the Syr Darya water supply sources in the AS, which was 63 km3 in 1960,
 dropped continuously each year and calculated to be 3.2 km3 in 2003 (CAWater-Info, 2015).
 Direct measurements of precipitation (P) and evapotranspiration (E) during the AS do not exist.
 Therefore, we calculated the cumulative contribution of precipitation and evapotranspiration to
 the lake, with ˗ as the residual above the water balance equation.

 Initially, monthly precipitation and evaporation were observed on the AS (44°48'N, 59°36'E) and
 ranged from two intervals in terms of AS water volumes change (FTI: 1901˗1960, STI:

 http://annalsofrscb.ro 11698
Annals of R.S.C.B., ISSN:1583-6258, Vol. 25, Issue 4, 2021, Pages. 11692 - 11703
Received 05 March 2021; Accepted 01 April 2021.

 1960˗2017) The shift in ˗ was analyzed using the linear regression analysis (95% confidence
 interval estimate), variations in two-time intervals, i.e., FTI, were recorded in the low positive
 trend (Slope: 0.474, R˗square: 0.015), whereas STI maintained strong negative trend (Slope:
 ˗1.881, R˗square: 0.138). The minimum and maximum values were observed in STI during two
 intervals, of 1995 (˗1369.5 mm), and 1981 (˗935.9 mm) (Fig. 4a,b).

 By analyzing the annual (intra˗annual) ˗ change over the two-interval periods, negative pees
 were monitored for almost every month in both periods (Fig. 4c), and the minimum values were
 typically ≤ 200 in summer (June, July) mm, maximum negative indicator ≥ ˗50 in February,
 March, and November. Only in the winter months (December and January) was positive ˗ >
 0. The results of the P˗E transformation were approximate, as other factors contributed to the
 change in the AS water balance. The Amu Darya and Syr Darya hydrometric stations are located
 50˗100 km far from the AS coast (Small et al., 2001). Most of the water is consumed until the
 river flows into the AS (agriculture, evapotranspiration, groundwater).

 In our approximate calculation, the water allocation has reached the AS and the ˗ is the
 minimum indicator. The minimum value is in line with the estimated value because the Amu
 Darya and Syr Darya water levels are minimal in specific months. Indicators for lake and
 streamflow have been reduced over time, by percentage and size, and the flow of water has fallen
 below the delta (Micklin, 1998). If we add the lake flow to this calculation, ˗ will have a
 higher negative value in the second time interval. Therefore, ˗ is the minimal estimate of the
 lake's estimated water volume change.

 Figure 4. Annual and inter-annual values of − over the AS for two-time intervals: a) First-

 http://annalsofrscb.ro 11699
Annals of R.S.C.B., ISSN:1583-6258, Vol. 25, Issue 4, 2021, Pages. 11692 - 11703
Received 05 March 2021; Accepted 01 April 2021.

 time interval (FTI), b) Second-time interval (STI) and c) − (mm) by month

 4 Discussion and conclusion
 Having a huge water surface the AS has served as a climate˗adjusting reservoir and mitigated
 sharp weather fluctuations in the Central Asian region (Zmijewski & Becker, 2014). The
 penetrating air masses, mainly from the west to the region during the winter, were warmed up,
 and in the summer cooled over the water area of the AS (Akramkhanov et al., 2012;
 Lioubimtseva, 2014).

 The results showing in FTI, there was a decrease in anomalous changes in three climatic
 parameters (TMP, PRE, and PET), but the STI showed a significant increase in TMP and PET
 due to uncertainty in PRE and anomalous RHM in three parts of the AS. In contrast to NE, the
 process is reflected in the NE part. Anomalies were analyzed in terms of STI and a significant
 decrease in all parts of the AS was recorded, whereas the strongest anomalous negative trend
 corresponded to SE.

 The graph(Figure 2 and Figure 3) of anomalous PET is based on the average annual fluctuation
 of the anomaly TMP in two-time intervals. The anomalous PRE patterns is almost the same as
 that of the SE in the STI, but the three parameters are parallel to each other. In contrast, the
 anomalous RHM change was developed in STI in a non˗parallel way. So, as the TMP and PET in
 the area are reduced, the RHM also decreases. The hydrological state of the AS was assessed
 based on the change of ˗ . At first, we will try to estimate the change in the amount of annual
 precipitation observed on the AS.

 In the period of STI, the annual evapotranspiration rate is also evolving, with a sharp increase in
 the process, but also with the wind velocity observed in the region. The wind velocity around the
 AS and its impact on seawater volumes have been proven by the conclusions based on numerous
 experiments (Roget, Muniz, & Zavialov, 2008), statistical data analysis, and expedition (Zavialov
 et al., 2011). The outcomes of this study indicate that the wind velocity in the region has risen
 correlating with the AS water volumes.The equation of water balance can be used for diagnostic
 assessments of the further development of the situation for different values of the components of
 the water balance. We do not have the means to reliably predict future changes in the river,
 underground sewage, precipitation and evapotranspiration for a long time, so, any deterministic
 forecast is difficult to construct.

 Acknowledgments
 We are grateful to the Nukus branch of Tashkent University of Information Technologies for
 their support in publishing this paper. Also, we are especially grateful to TimurBerdimbetov
 (University of Chinese Academy of Sciences) for his close assistance in the preparation of this
 scientific paper.

 Conflicts of Interest: The authors declare no conflicts of interest.

 Author’s contributions: All authors agreed to publish this version of the manuscript.

 http://annalsofrscb.ro 11700
Annals of R.S.C.B., ISSN:1583-6258, Vol. 25, Issue 4, 2021, Pages. 11692 - 11703
Received 05 March 2021; Accepted 01 April 2021.

 REFERENCES
 [1] Abdurahimov, B. F., & Kurbanov, U. H. (2015). The response of the climate system to
 small temperature perturbations in the Aral Sea region. Bull. Nov. Comp. Center,
 Num.Model. in Atmosph., etc.,, 15, 1-6. Retrieved from
 https://elibrary.ru/contents.asp?id=34222658

 [2] Akramkhanov, A., Kuziev, R., Sommer, R., Martius, C., Forkutsa, O., & Massucati, L. F.
 (2012). Soils and Soil Ecology in Khorezm. In (pp. 37-58).

 [3] Benduhn, F., & Renard, P. (2004). A dynamic model of the Aral Sea water and salt
 balance. Journal of Marine Systems, 47, 35-50.

 [4] Berdimbetov, T., Nietullaeva, S., & Yegizbaeva, A. (2021). Analysis of Impact of Aral Sea
 Catastrophe on Anomaly Climate Variables and Hydrological Processes. International
 Journal of Geoinformatics, 17(1), 65-74. Retrieved from
 https://journals.sfu.ca/ijg/index.php/journal/article/view/1711

 [5] Berdimbetov, T. T., Zhu-Guo, M., Chen, L., & Sana, I. (2020). Impact of Climate Factors
 and Human Activities on Water Resources in the Aral Sea Basin. Hydrology MDPI, 7(30),
 14. doi:https://dx.doi.org/10.3390/hydrology7020030

 [6] Beven, K. (1979). A sensitivity analysis of the Penman-Monteith actual evapotranspiration
 estimates. Journal of Hydrology, 44(3), 169-190. doi:https://doi.org/10.1016/0022-
 1694(79)90130-6

 [7] Bortnik, V., & Chistyaevaya, S. (1990). Hydrometeorology and Hydrochemistry of the
 Seas of the USSR. Leningrad: Gidrometeoizdat (In Russian), Vol. VIII: Aral Sea.

 [8] CAWater-Info. (2015). Portal of Knowledge for Water and Environmental Issues in Central
 Asia.

 [9] Cre´taux, J.-F., & Berge´-Nguyen, M. (2014). Aral Sea Hydrology from Satellite Remote.
 In M. P (Ed.), The Aral Sea, Springer Earth System Sciences Sensing. Berlin Heidelberg.

 [10] Faustin Katchele, O., Ma, Z.-G., Yang, Q., & Batebana, K. (2017). Comparison of trends
 and frequencies of drought in central North China and sub-Saharan Africa from 1901 to
 2010. Atmospheric and Oceanic Science Letters, 10(6), 418-426.
 doi:10.1080/16742834.2017.1392825

 [11] Gafforov, K. S., Bao, A., Rakhimov, S., Liu, T., Abdullaev, F., Jiang, L., . . . Mukanov, Y.
 (2020). The Assessment of Climate Change on Rainfall-Runoff Erosivity in the Chirchik–
 Akhangaran Basin, Uzbekistan. Sustainability, 12(8).
 doi:https://dx.doi.org/10.3390/su12083369

 http://annalsofrscb.ro 11701
Annals of R.S.C.B., ISSN:1583-6258, Vol. 25, Issue 4, 2021, Pages. 11692 - 11703
Received 05 March 2021; Accepted 01 April 2021.

 [12] Gaybullaev, B., Chen, S., & Gaybullaev, D. (2012). Changes in water volume of the Aral
 Sea after 1960. Applied Water Science, 2. doi:https://dx.doi.org/10.1007/s13201-012-0048-
 z

 [13] Harris, I., Osborn, T. J., Jones, P., & Lister, D. (2020). Version 4 of the CRU TS monthly
 high-resolution gridded multivariate climate dataset. Sci Data, 7(1), 109.
 doi:10.1038/s41597-020-0453-3

 [14] Kendall, M. G. (1975). Rank Correlation Methods. London.

 [15] Lioubimtseva, E. (2014). Impact of Climate Change on the Aral Sea and Its Basin. In P. P.
 Micklin (Ed.), (pp. 405-427). Berlin, Germany: Springer-Verlag.

 [16] Mann, H. B. (1945). Non-parametric Tests against Trend. Econometrica, 13, 163–171.

 [17] Micklin, P. (1998). Regional and International Responses to the Aral Crisis. PostSoviet
 Geography and Economics, 39(7), 399-417.

 [18] Micklin, P. (2000). Managing water in Central Asia (Central Asian and Caucasian
 Prospect). London: The Royal Institute of International Affairs.

 [19] Micklin, P. (2007). The Aral Sea Disaster. Annual Review of Earth and Planetary Sciences,
 35(1), 47-72. doi:https://dx.doi.org/10.1146/annurev.earth.35.031306.140120

 [20] Nezlin, N. P., Kostianoy, A. G., & Lebedev, S. A. (2004). Interannual variations of the
 discharge of Amu Darya and Syr Darya estimated from global atmospheric precipitation.
 Journal of Marine Systems, 47(1-4), 67-75. doi:10.1016/j.jmarsys.2003.12.009

 [21] Roget, E., Muniz, M. A., & Zavialov, P. O. (2008). Mixing related to internal waves and
 gyres in the western lobe of the Large Aral Sea. . In EGU General Assembly, Vienna,
 Austria, abstract volume.Sadov, A. V., and V. V. Krasnikov, 1987: Detection of foci of
 subaqueous subsurface water discharge into Aral Sea by remote sensing methods.
 Problemy Osvoeniya Pustyn, (Vol. 1, 28–36). Vienna.

 [22] Small, E. E., Sloan, L. C., & Nychka, D. (2001). Changes in Surface Air Temperature
 Caused by Desiccation of the Aral Sea. Journal of Climate, 14, 284-299.
 doi:https://dx.doi.org/10.1175/1520-0442(2001)0142.0.CO;2

 [23] Xu, Z., Takeuchi, K., & Ishidaira, H. (2003). Monotonic Trend and Step Changes in
 Japanese Precipitation. Journal of Hydrology, 279, 144-150. doi:10.1016/S0022-
 1694(03)00178-1

 [24] Zavialov, P. O., Arashkevich, E. G., Bastida, I., Ginzburg, A. I., Dikarev, S. N., Jitina, L.
 S., & Ijiskiy, A. S. (2011). Aral Sea at the Beginning of the XXI Century (Physics, Biology,
 Chemistry) (in Russian). Moscow: Shirshov Institute of Oceanology of Russian Academy
 of Sciences.

 http://annalsofrscb.ro 11702
Annals of R.S.C.B., ISSN:1583-6258, Vol. 25, Issue 4, 2021, Pages. 11692 - 11703
Received 05 March 2021; Accepted 01 April 2021.

 [25] Zavialov, P. O., Kostianoy, A. G., Emelianov, S. V., Ni, A. A., Ishniyazov, D., Khan, V.
 M., & Kudyshkin, T. V. (2003). Hydrographic survey in the dying Aral Sea. Geophysical
 Research Letters, 30(13). doi:https://dx.doi.org/10.1029/2003gl017427

 [26] Zmijewski, K., & Becker, R. (2014). Estimating the Effects of Anthropogenic Modification
 on Water Balance in the Aral Sea Watershed Using GRACE: 2003–12. Earth Interactions,
 18(3), 1-16. doi:https://dx.doi.org/10.1175/2013ei000537.1

 http://annalsofrscb.ro 11703
You can also read