An Ultra-Portable Vis-NIR Spectrometer with an Integrated Light Source for Chemometric Applications - IOPscience
←
→
Page content transcription
If your browser does not render page correctly, please read the page content below
Journal of The Electrochemical
Society

OPEN ACCESS

An Ultra-Portable Vis-NIR Spectrometer with an Integrated Light Source
for Chemometric Applications
To cite this article: Amruta Ranjan Behera et al 2020 J. Electrochem. Soc. 167 167515

View the article online for updates and enhancements.

                               This content was downloaded from IP address 46.4.80.155 on 08/05/2021 at 17:51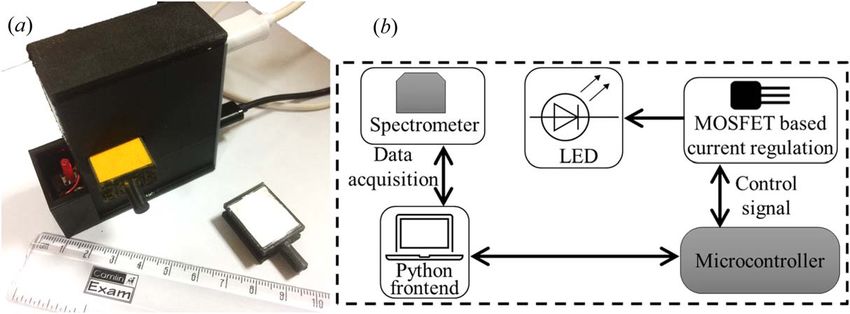
Journal of The Electrochemical Society, 2020 167 167515

                                  An Ultra-Portable Vis-NIR Spectrometer with an Integrated Light
                                  Source for Chemometric Applications
                                  Amruta Ranjan Behera,1,z Avinash Kumar,1 Hasika Suresh,1 Manas Pratap,2 Shankar
                                  Kumar Selvaraja,1 and Rudra Pratap1
                                  1
                                      Centre for Nano Science and Engineering, Indian Institute of Science, Bangalore, India
                                  2
                                      Electrical Engineering and Computer Science, Indian Institute of Science Education and Research, Bhopal, India

                  On-site material inspection and quality analysis of food and agricultural produce require portable sensing systems. We report the
                  development of a miniaturized spectrometer with an integrated light source operating in the visible and near-infrared range, for
                  chemometrics based material-sensing applications. The proposed system uses off-the-shelf light source and detector. The electronic
                  circuit is designed, developed, and tested in-house. To validate the system’s usability, a set of classification experiments are carried
                  out with measured spectra from culinary white powders and medicinal pills. Several classification algorithms are used to build
                  predictive models and the best-suited ones give prediction accuracies of 80% and 92.6% respectively. A regression model built to
                  estimate the curcumin content in turmeric shows a coefficient-of-determination of 0.97 for prediction. With more than 90%
                  repeatability in the measured reflectance spectra, robustness of the device is demonstrated. Realization of a portable spectrometer,
                  along with a framework for building appropriate prediction models, is expected to spur the development of point-of-use material
                  sensing in the Vis-NIR range.
                  © 2020 The Author(s). Published on behalf of The Electrochemical Society by IOP Publishing Limited. This is an open access
                  article distributed under the terms of the Creative Commons Attribution Non-Commercial No Derivatives 4.0 License (CC BY-
                  NC-ND, http://creativecommons.org/licenses/by-nc-nd/4.0/), which permits non-commercial reuse, distribution, and reproduction
                  in any medium, provided the original work is not changed in any way and is properly cited. For permission for commercial reuse,
                  please email: permissions@ioppublishing.org. [DOI: 10.1149/1945-7111/abc7e8]

                  Manuscript submitted August 18, 2020; revised manuscript received October 29, 2020. Published December 3, 2020. This paper is
                  part of the JES Focus Issue on IMCS 2020.

    There is a growing demand for on-site analysis of food and                           free on-site measurement. With an operating range of 400–1000 nm, the
agricultural produce for selecting quality produce and detecting                         spectrometer allows applications in the visible and near-IR range. Since
adulterants. This is advantageous from the viewpoint of saving time                      the reflectance spectra in the near-IR range represent the chemical
and effort needed to procure quality samples. Remote farmlands and                       fingerprint of a material, the device can be used for material sensing
agricultural zones that do not have laboratory facilities in their                       tasks, such as analysis of food products and pharmaceuticals.22–25 Test
vicinity will benefit highly from an on-site analysis.1 Another                           results on reproducibility and robustness of the device is presented.
example of on-site analysis is the different stages of a food-                           Among the reported applications26,27 of chemometrics, classification
processing value chain, where online assessment of process para-                         and regression are two widely used tasks, each with widespread
meters is crucial for real-time quality monitoring. These demands                        applications. In this work, utility of the measured spectra from the
dictate the need for devices that meet the customer expectations on                      device is demonstrated for both the tasks. Two examples are shown to
performance, cost and form-factor.                                                       demonstrate classification. (i) Classification of white culinary powders
    Traditional laboratory techniques like High Performance Liquid                       by their common name, (ii) Classification of medicinal pills based on
Chromatography (HPLC)2–4 and its coupling to mass spectroscopy                           their chemical composition. A regression task is undertaken to quantify
(LC-MS),5–7 spectrophotometric techniques8 by ASTA9 and X-ray                            the curcumin content in powdered turmeric samples using partial least
diffraction10 have been used as the gold standard for quality control.                   squared regression (PLSR) analysis aided with spectral pre-treatment.
However, such analyses require bulky instruments and expensive
chemicals, some are even toxic and hard to dispose effectively. In                                               Materials and Methods
addition, these methods require trained analysts to run the instrument
                                                                                             Two sets of powders are used to demonstrate classification from
and the added time to generate and analyse them. Industries that rely
                                                                                         their reflectance alone. The first set consists of six different white
heavily on these tests for their manufacturing processes lose out on
                                                                                         culinary powders with a similar texture. Names of these powders are
precious time. Additionally, the chemicals used add to the woes of an
                                                                                         listed in Table A·I of the appendix. The second set includes
already vexing problem of waste management. A growing demand for
                                                                                         medicinal pills of ten different chemical compositions. The com-
faster, on-site quality analysis of food and agricultural produce with
                                                                                         mercial names of the 36 pills from these ten categories are listed in
minimal sample preparation and chemical usage, has resulted in
                                                                                         Table A·II of the appendix. Each of these pills are pounded to a fine
adoption of chemometric based techniques. Thus, a portable instru-
                                                                                         powder using a mortar and pestle.
ment that can capture the spectral signature of the materials and a
                                                                                             For the task of prediction using regression analysis, the
robust chemometric model for prediction are highly desirable for an
                                                                                         pharmacologically active curcumin28 is quantified in powdered
on-site analysis. We have focussed our work on building this portable
                                                                                         turmeric samples. The curcuminoids are first quantified by high
spectrometer due to prohibitively high cost of the existing spectro-
                                                                                         performance liquid chromatography (HPLC), which serves as the
meters and the inability to customize their various features.
                                                                                         reference data for prediction. The sample set for this study includes
    Recent developments in internet-of-things technologies along with
                                                                                         commercially procured turmeric powders as well as whole dry
machine learning and cloud computing have renewed the interest in
                                                                                         roots directly collected from farmers and traders. These roots are
spectrometer manufacturers for exploring avenues to miniaturize
                                                                                         first manually cut into smaller pieces of 1 cm × 1 cm, followed by
spectrometers. A list of several miniaturized spectrometers reported
                                                                                         grinding them into a fine powder using a kitchen grinder. This
during the last decade are available in the.11–21 Although several
                                                                                         powder is passed through a 250 μm industrial sieve to maintain
spectrometers are small in size, they require external radiation sources
                                                                                         uniform particle size.
that are mains-powered. This limits their usage on the field. For the
device reported in this work, the built-in light source allows for hassle                                               Experimental
                                                                                            The proposed device (6.5 cm × 2.5 cm × 6.5 cm) consists of a
  z
      E-mail: amruta@iisc.ac.in                                                          spectrometer and an LED light source, placed next to each other in a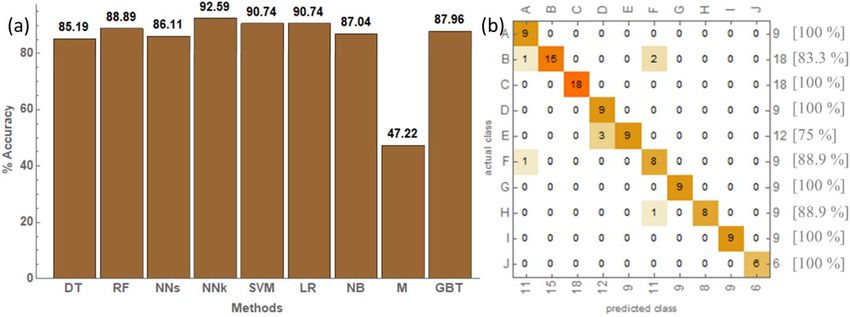
Journal of The Electrochemical Society, 2020 167 167515

Figure 1. (a) Image of the handheld spectrometer along with the sample holders containing barium sulphate (white) and turmeric powder (yellow). (b)
Schematic of the system showing different components.

reflective arrangement. All the components of the device are encased
in a 3D printed thermoplastic holder. Figure 1a shows the complete
spectrometer along with two custom made sample holders con-
taining powdered samples. A schematic of the system with main
components is shown in Fig. 1b. The microcontroller ensures that a
set brightness level for the LED is maintained by regulating the
current flow through a MOSFET. Lighting of the LED and data
acquisition by the spectrometer are synchronized. The integrated
system connects to a computer via USB for power and communica-
tion, making it universal and simple to use. A Python-based interface
running on the computer, communicates the user commands to the
microcontroller and the spectrometer. Spectral data is acquired from
the device through the USB connection to the computer in CSV
format. It has a spectral resolution of 1 nm. The Python-interface
allows the user to adjust the different parameters, such as light
intensity, number of scans-to-average, and integration time. This
device is designed to scan and analyse powdered samples. These
                                                                            Figure 2. Intensity of light from the LED (on Log scale) plotted against
samples are inserted into the slot on the side of the device. The           wavelength.
powdered sample is filled to the brim of the sample holder and the
excess is wiped off with a clean glass slide for a smooth surface on
the scanning area. In this work, fifteen scans are taken for each
                                                                            data are analysed in UnscramblerTM (v.11). The correlation between
sample, with the scans-to-average value set at 35 (this is the number
                                                                            the processed spectra and the curcumin content from HPLC analysis
of times the spectrometer automatically scans a single inserted
                                                                            is examined by the partial least squared regression (PLSR) algo-
sample and averages the reading to produce a single spectrum). After
                                                                            rithm. The model performance is reported with coefficient of
each scan, the powdered sample is disturbed and levelled again to
                                                                            determination (R2) and root-mean-squared error of cross validation
mimic a fresh sample. The measurement time for each sample is less
                                                                            (RMSECV).
than 2 s. There is also a provision for automatically setting the
integration time to have an optimal signal-to-noise ratio. Each
                                                                                                   Results and Discussion
spectrum can be viewed as a graphical image and can be exported
in the text format that is used for further data processing.                    The response of the LED light source is characterized with a well
Measurements carried out to test the light source and detector’s            calibrated spectrometer (Jaz, Oceanoptics) and is presented in Fig. 2.
characteristics are described in the results and discussion section.        The dominant peak between 400–500 nm corresponds to blue light.
                                                                            The response is relatively flat beyond 700 nm. To characterize
    Data analysis.—The acquired raw spectra from our device are             repeatability of the detector, 15 scans are taken from four random
analyzed on two different platforms. To test the device’s ability to        turmeric samples, keeping all the acquisition parameters constant.
distinguish materials based on their reflectance spectra alone, a            Variations among the recorded intensities at different wavelengths
classification task is demonstrated with two example sets. The first          are depicted in Fig. 3a. Except for a few outliers close to 400 nm, the
set includes classifying white culinary powders by their common             variations are below 10%, showing 90% repeatability, which is
names (Table A·I). The second set includes assigning medicinal pills        considered reasonable. As an example of raw measured reflectance
to their respective chemical compositions (Table A·II). Classification       spectra, scans from medicinal pills are also presented here. Figure 3b
models are built with the readily available algorithms in                   shows composition-wise (10 groups later used for classification)
MathematicaTM (Table A·III).29 The model with the highest accu-             averaged spectra of medicinal pills, with the inset showing the
racy is selected to classify individual spectra to their respective         zoomed-in view of the spectral features in the range 650–1000 nm.
classes. The results are reported in terms of a confusion matrix and        The sharp peak between 400–500 nm is due to the higher intensity
percentage accuracy of the classification. Analysis and prediction           corresponding to the characteristic peak from the light source as
with a pre-trained model can be done in less than 5 s using                 described earlier. The variation in peak heights represent traits of the
MathematicaTM. For predicting curcumin in turmeric, the spectral            composition groups.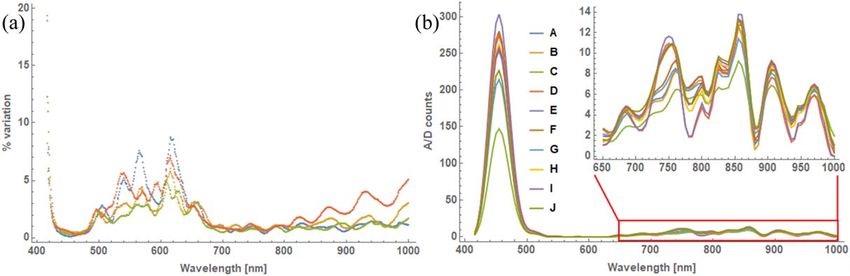
Journal of The Electrochemical Society, 2020 167 167515
Figure 3. (a) Wavelength wise variations in the reflected intensity among 15 measured spectra each from 4 random turmeric samples with all acquisition
parameters remaining constant, (b) The average spectra for ten compositions (of pills) are depicted with inset showing the zoomed-in view of the spectra in the
range 650–1000 nm. Labels correspond to the compositions listed in Table A·II.
Figure 4. (a) Accuracy of prediction models for various methods used to classify white powders, (b) The confusion matrix for the best case of white powders
classification with Naive Bayes method. Labels correspond to the compositions listed in table A-F.
White powders.—The spectra of six culinary powders is col- spectra alone (Fig. 3b). A similar approach is followed as that with
lected in the range of 400–1000 nm. Using the reflectance spectra white culinary powders (Fig. 4). For model building, 15 scans (from
alone, a simple classification model is built to predict the six culinary each pill) are divided into two sets of 12 and 3 as training and test
white powders by their common names (A-I of the appendix). sets, respectively, to ensure each type of pill from all (composition)
Fifteen scans are collected for each of the six powders and is divided categories are represented in the validation set. Thus, the total
into a training set (10 scans each) and a test set (5 scans each). The number for scans in training and test sets are 432 (36 × 12) and 108
training set is processed using each of the nine readily available (36 × 3) respectively. The training set is processed using each of the
algorithms (A-III of the appendix) in MathematicaTM. The models nine classification algorithms (A-III of the appendix). The neural
are applied to the test dataset for validation and the resulting network algorithm is found to give the best accuracy of 92.6% as
accuracies are presented in Fig. 4a. Naïve Bayes algorithm is found shown in Fig. 5a. The validation result of the neural network model
to have the best prediction accuracy of 80%, and the test-set in shown in Fig. 5b with a confusion matrix. The labels (A-J on the
validation result for this model is presented as a confusion matrix in left y-axis and the top x-axis) refer to the chemical compositions of
Fig. 4b. The labels (A-F on the left y-axis and the top x-axis) refer to the medicinal pills. Here the diagonal numbers (representing correct
the names of the culinary powders. The numbers on the right y-axis predictions) sum up to 100, implying 92.6% (100 correct predictions
and bottom x-axis represent the total number of actual and predicted out of 108) accuracy. Among the individual compositions, prediction
samples, respectively. In an ideal case, when all samples are accuracies were reasonable with the worst case being 75% (compo-
predicted as their actual classes, the off-diagonal numbers should sition E).
be zero. Percentage accuracy of prediction for each of the classes Reasonable accuracies from these classification tasks show that
(rows) are denoted on the right y-axis. The prediction is perfect at the device can be used for identification of chemical nature of a
100% for samples B, and F, followed by 80% for samples A, C and material. Applications can range from identifying adulteration in
E. Sample D has the least accuracy of 40%. food products to detection of counterfeit drugs.
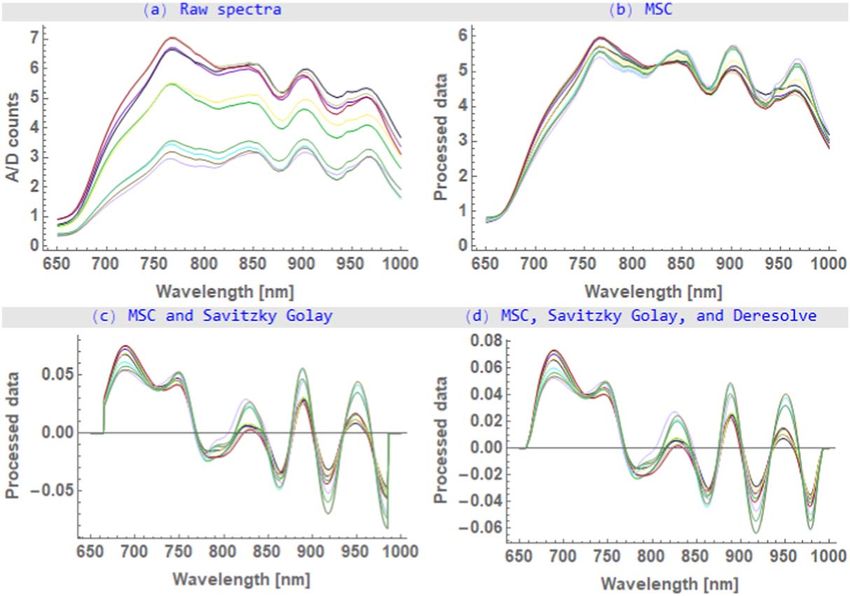
Medicinal pills.—To demonstrate another example of classifica- Turmeric.—Figure 6a shows the raw Vis-NIR spectra of
tion of materials, 36 commercially available medicinal pills be- turmeric samples over 650–1000 nm collected from the device.
longing to 10 different chemical composition groups are used. All The spectra for all the samples (n = 52) are recorded in diffused
the names of the pills and their respective chemical compositions are reflectance mode, with a resolution of 1 nm. The spectra are all
listed in A-II of the appendix. A classification model is built to similar in shape showing absorption bands around 900 nm (third
predict the composition of a sample pill from their reflectance overtone of C–H stretching) and 950 nm (second overtone O–H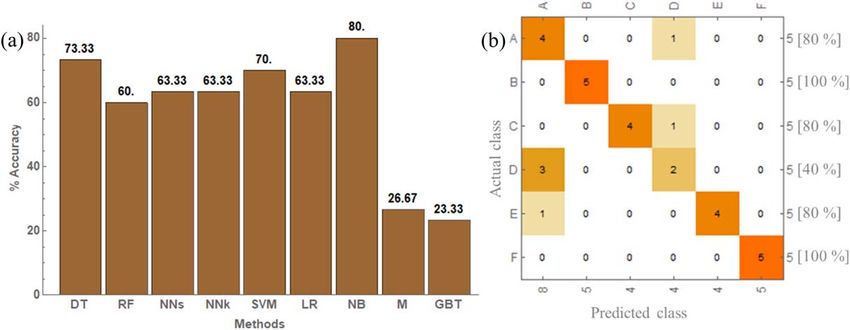
Journal of The Electrochemical Society, 2020 167 167515

Figure 5. (a) Accuracy of prediction models for various algorithms used to classify medicinal pills based on their chemical composition. (b) The confusion
matrix for the best case of medicinal pills with the neural network algorithm. Labels correspond to the compositions listed in table A-J.

Figure 6. Images representing the transformation of the turmeric spectra when subjected to a sequence of pre-processing steps. (a) Raw turmeric spectra from
the instrument. (b) MSC corrected spectra. (c) Spectra after the application of Savitzky-Golay filter. (d) Application of Deresolve filter to smoothen the data.

stretching) and a faint band around 850 nm (third overtone of N–H                 (Fig. 6b). This method is also believed to be the best suited for
stretching).30 These raw spectra contain quantitative information on              correction of spectra where the scatter variation is large in
the chemical constituents corresponding to three such bonds (among                comparison to the chemical variation.32 The absorption bands are
others), namely, O–H bonds (found in water), C–H bonds (found in                  amplified with the Savitzky-Golay first derivative filter along with
CH2 and CH3) and N–H bonds (found in protein). However, it is                     surfacing of a band at 680 nm and a shoulder peak at 750 nm
difficult to individually capture them due to the overtones and                    (Fig. 6c). The resulting data is smoothened with a deresolve step to
combinations. Mathematical pre-treatments and chemometrics                        filter the noise in the processed signal (Fig. 6d).
methods are hence needed to extract useful information from the                      We have built a predictive model for a wide range of curcumin
raw spectra for better prediction of curcuminoids in the turmeric                 content, spanning over 1%–9%. For this model, the training data
samples.31 Multiplicative scatter correction (MSC) is used to correct             consists of 52 samples with 15 scans each (total—780 spectra). The
for baseline shifts caused by both amplification (multiplicative) and              raw spectra are subjected to a combination of pre-processing steps
off-set (additive) arising due to particle size or scattering of light            (Fig. 6), to extract maximum useful information. The processed
Journal of The Electrochemical Society, 2020 167 167515
Conclusions
The results from this work show practical applicability of
miniaturized spectrometers in the Vis-NIR range, combined with
machine learning algorithms, to analyse different chemical composi-
tions and ingredients. The repeatability and the robustness of the
spectral acquisition from our device is also demonstrated. The
device performance is shown with two widely used classes of
chemometric techniques: classification and prediction. Culinary
white powders and medicinal pills are classified by their reflectance
spectra alone with an accuracy of 80% and 92.6% respectively. The
curcumin content in turmeric is predicted using regression analysis
and the coefficient of determination for the validation set is found to
be as high as 0.97. Future research and validation along with
enriched understanding of different machine learning algorithms is
needed to build stronger reliable models. Realization of a portable
spectrometer, along with a framework for identifying the best suited
prediction model, enables the point-of-use material sensing in the
Vis-NIR range.
Acknowledgments
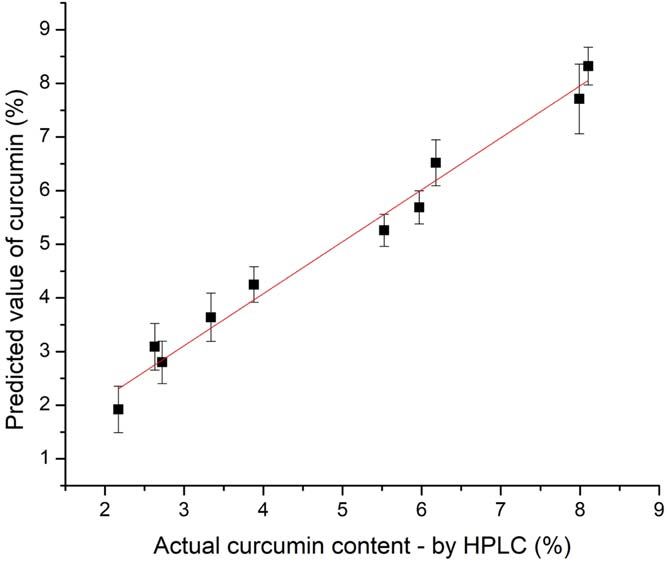
Figure 7. Scatter plot showing the final predicted value of curcumin vs the The authors thank Ranit Pradhan from the department of
actual curcumin content from HPLC. Electrical and Computer Engineering, Amrita Vishwa
Vidyapeetham, Amritapuri, for his assistance in the sample prepara-
spectra are correlated with reference HPLC values using PLSR tion and spectral measurement of pills. This work is primarily
algorithm to quantify total curcuminoids in powdered turmeric catalysed and supported by the Office of the Principal Scientific
samples. The model yields a coefficient-of-determination (R2) of Adviser to the Government of India and partially by a grant from the
0.90 at PLS factor 7. Cross validation is performed on a test data of Government of Karnataka.
10 samples, which yields a root-mean-squared error of cross
validation (RMSECV) of 0.8. Appendix
The final validation results for the test samples (not a part of the
training model) are represented with a scatter plot as shown in Fig. 7. Table A·I. List of white powders used in this work, and the labels
The data points correspond to the mean of the predicted curcumin used to represent them.
value for the 15 scans taken for each sample. The error-bars
represent the standard deviation among them for a particular sample. Labels White powders
The higher the coefficient of determination (R2), the better the
correlation between the actual curcumin value and the predicted A Baking powder
value.33 The R2 is found to be 0.97, showing a strong correlation. B Baking soda
Based on the mean and standard deviation of prediction from 15 C Calcium propionate (C6H10CaO4)
scans of a sample, the variation is found to be between 4%–20% for D Corn flour
the 10 test samples, which can be further improved with continued E Icing sugar (C12H22O11)
addition of spectral data to the training set. F MaidaJournal of The Electrochemical Society, 2020 167 167515
Table A·II. List of pills used in this work, the composition family they belong to, and the labels used to represent them.
Labels Compositions Pill names
A Ranitidine Rantac, Rantac OD, Aciloc-150
B Omeprazole Omee, Lozone-20, Omez, Oskar-20, Ocid-20, OMD
C Rabeprazole Histac-RD, Cyra, Ecorab, Rabipot, Zinirab, Rbson
D Levocetirizine Levocet, Levocetirizine, Okacet-L
E Paracetamol Medomol-650, Crocin-650, Calpol-650, Dolo-650
F Metoprolol Succinate Promolet XL 25, Metol XL 25, Metolar 25
G Glimepiride, Metformin hydrochloride, Voglibose Glycomet Trio 1, Glucorul MV 1, Trivolib 1
H L-Throxine Thyorox 50, Eltroxin, Thyronome
I Amoxicillin, Potassium clavulanate Clavam 625, Clamp 625, Augmentin 625
J Magnesium hydroxide, Aluminium hydroxide Digene, Gelusil
Table A·III. List of methods used for classification and their 11. H. You, Y. Kim, J. H. Lee, and S. Choi, Int. Conf. Ubiquitous Futur. Networks,
ICUFN, 2017, 732 (2017).
abbreviations used for labelling.
12. P. Edwards et al., Sci. Rep., 7, 1 (2017).
13. F. Lee, G. Zhou, H. Yu, and F. S. Chau, Sensors Actuators, A Phys., 149, 221 (2009).
Method name Abbreviations 14. N. A. O’Brien et al., Next-Generation Spectroscopic Technologies, ed. V. M.
A. Druy and R. A. Crocombe (SPIE) 8374, 837404 (2012), http://proceedings.
Decision tree34 DT spiedigitallibrary.org/proceeding.aspx?doi=10.1117/12.917983.
Random forest35 RF 15. L. Leppänen and A. Kontu, Geosciences, 8, 404 (2018), http://mdpi.com/2076-
3263/8/11/404.
Nearest neighbours36 NNs 16. C. L. Weller, I. R. Rukundo, K. M. Eskridge, M.-G. C. Danao, and R. L. Wehling,
Neural network37 NNk J. Near Infrared Spectrosc., 28, 81 (2020), https://osapublishing.org/abstract.cfm?
Support vector machine38 SVM uri=jnirs-28-2-81.
Logistic regression39 LR 17. U. N. Ikeogu and G. J. Nychas, PLoS One, 12, e0188918 (2017).
18. Y. Dixit et al., Meat Sci., 162, 108026 (2020).
Naïve Bayes40 NB 19. B. G. Barthès et al., Geoderma, 338, 422 (2019).
Markov30 M 20. C. Pasquini, Anal. Chim. Acta, 1026, 8 (2018).
Gradient boosted trees41 GBT 21. H. Tang, C. Zhu, G. Meng, and N. Wu, J. Electrochem. Soc., 165, B3098 (2018).
22. P. Williams and K. Norris, Near-Infrared Technol. (Agric. food Ind., St. Paul,
Minnesota) 32, 803 (1988).
ORCID 23. Y. Ozaki, Anal. Sci., 28, 545 (2012), http://japanlinkcenter.org/DN/JST.JSTAGE/
analsci/28.545?lang=en&from=CrossRef&type=abstract.
Amruta Ranjan Behera https://orcid.org/0000-0002-0972-3120 24. J. Rantanen, H. Wikström, R. Turner, and L. S. Taylor, Anal. Chem., 77, 556
Shankar Kumar Selvaraja https://orcid.org/0000-0003-2670-7058 (2005).
25. M. E. Webber et al., Meas. Sci. Technol., 16, 1547 (2005).
References 26. S. Namuduri, B. N. Narayanan, V. S. P. Davuluru, L. Burton, and S. Bhansali,
J. Electrochem. Soc., 167, 037552 (2020).
1. L. Burton, K. Jayachandran, and S. Bhansali, J. Electrochem. Soc., 167, 037569 27. Y. Mekonnen, S. Namuduri, L. Burton, A. Sarwat, and S. Bhansali, J. Electrochem.
(2020). Soc., 167, 037522 (2020).
2. W. Wichitnithad, N. Jongaroonngamsang, S. Pummangura, and P. Rojsitthisak, 28. M. K. Kumar, N. S. Jha, R. Yadav, and S. K. Jha, J. Electrochem. Soc., 166, H556
Phytochem. Anal., 20, 314 (2009). (2019).
3. E. Watanabe, Y. Kobara, K. Baba, and H. Eun, Food Chem., 154, 7 (2014). 29. https://blog.wolfram.com/2017/10/10/building-the-automated-data-scientist-the-
4. N. Kozukue et al., J. Agric. Food Chem., 55, 7131 (2007), https://pubs.acs.org/ new-classify-and-predict/.
sharingguidelines. 30. https://reference.wolfram.com/language/ref/method/DecisionTree.html.
5. R. Hiserodt, T. G. Hartman, C. T. Ho, and R. T. Rosen, J. Chromatogr. A, 740, 51 31. https://reference.wolfram.com/language/ref/method/RandomForest.html.
(1996). 32. https://reference.wolfram.com/language/ref/method/NearestNeighbors.html.
6. O. Esturk, Y. Yakar, and Z. Ayhan, J. Food Sci. Technol., 51, 458 (2014). 33. https://reference.wolfram.com/language/ref/method/NeuralNetwork.html.
7. H. S. Chung et al., Int. J. Environ. Anal. Chem., 97, 99 (2017), https://tandfonline. 34. https://reference.wolfram.com/language/ref/method/SupportVectorMachine.html.
com/doi/abs/10.1080/03067319.2017.1282473. 35. https://reference.wolfram.com/language/ref/method/LogisticRegression.html.
8. K. Sharma, S. S. Agrawal, and M. Gupta, “Development and Validation of 36. https://reference.wolfram.com/language/ref/method/NaiveBayes.html.
UVspectrophotometric method for the estimation ofCurcumin in Bulk Drug and 37. https://reference.wolfram.com/language/ref/method/Markov.html.
Pharmaceutical DosageForms.” Int. J. Drug Dev. & Res., 4, 375 (2012), https:// 38. https://reference.wolfram.com/language/ref/method/GradientBoostedTrees.html.
researchgate.net/publication/285665708, https://www.ijddr.in/drug-development/ 39. Shenk and JS., Handb. Near-infrared Anal., 385, https://ci.nii.ac.jp/naid/10008263819
development-and-validation-of-uv-spectrophotometric-method-for-the-estima- (1992).
tionof-curcumin-in-bulk-drug-and-pharmaceutical-dosage-forms.php?aid=5176. 40. Y. J. Kim, H. J. Lee, H. S. Shin, and Y. Shin, Phytochem. Anal., 25, 445 (2014).
9. Official Analytical Methods of the American Spice Trade Association Method 18.0, 41. M. I. López, E. Trullols, M. P. Callao, and I. Ruisánchez, Journal of Food
p. 81 (2019). Chemistry, 147, 177-181 (2014).
10. B. A. Sarsfield et al., Powder X-ray Diffraction Detection of Crystalline Phases In 42. R. Font, M. Del Río-Celestino, E. Cartea, and A. De Haro-Bailón, Phytochemistry,
Amorphous Pharmaceuticals, www.dxcicdd.com. 66, 175 (2005).You can also read