Knockdown of PNO1 inhibits esophageal cancer progression
←
→
Page content transcription
If your browser does not render page correctly, please read the page content below
ONCOLOGY REPORTS 45: 85, 2021

      Knockdown of PNO1 inhibits esophageal cancer progression
                   GUOWEN WANG1, QICAI LI1, CHUANKUI LI1, GUIXIN DUAN1, HAIWEI SANG1,
                         HAIJUN DONG2, YIFAN YANG1, CHANG MA1 and TAO TAO1

      1
       Department of Thoracic Surgery, The First Affiliated Hospital of Bengbu Medical College, Bengbu, Anhui 233030;
             2
              Department of Thoracic Surgery, Huzhou Central Hospital, Huzhou, Zhejiang 310000, P.R. China

                                        Received July 23, 2020; Accepted March 11, 2021

                                                    DOI: 10.3892/or.2021.8036

Abstract. The present study aimed to investigate the role               Partner of NOB1 homolog (PNO1) is a highly conserved
of partner of NOB1 homolog (PNO1) in esophageal cancer              protein with a K homology (KH) domain at its C‑terminal and
(EC). The expression levels of PNO1 in EC were primarily            two putative nuclear localization signals at its N‑terminal (3,4).
analyzed using data obtained from databases. PNO1 expres‑           In mice, PNO1 was discovered to be involved in immune
sion was also knocked down in EC cells (Eca‑109 and TE1)            responses and proteasome activities (5). Currently, the onco‑
to determine the biological effects of PNO1 on tumorigenesis        genic role of PNO1 in hepatocellular carcinoma and colorectal
in vitro and in vivo. In addition, possible downstream targets      cancer has been determined (6,7). However, the expression
of PNO1 in EC were identified. The expression levels of PNO1        levels, biological effects and mechanisms of action of PNO1 in
were upregulated in the tumor tissues compared with that            EC remain to be elucidated.
noted in normal tissues. Moreover, the knockdown (KD) of                The present study first analyzed the expression levels of
PNO1 suppressed cell proliferation, migration and invasion,         PNO1 in EC tissues using data obtained from The Cancer
and promoted cell apoptosis (P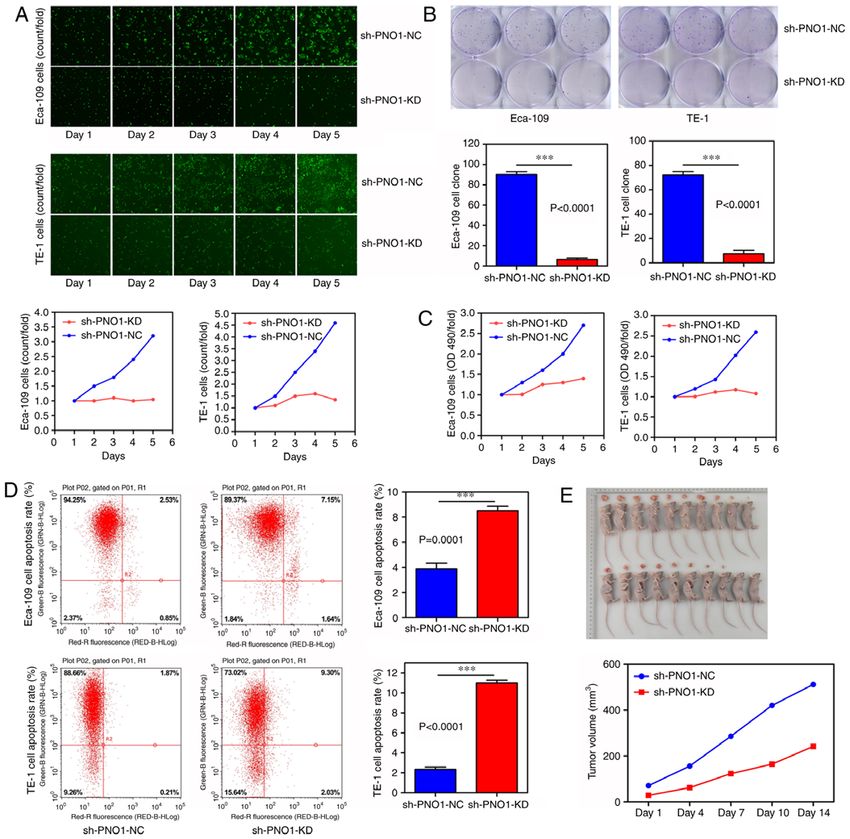
2 WANG et al: EFFECT OF PNO1 ON ESOPHAGEAL CANCER
were used for transfection. Lentiviral vectors were used Cell apoptosis assay. Cell apoptosis assay was performed
for Eca‑109 and TE‑1 cell transfection as previously using an Annexin V Apoptosis Detection kit (eBioscience;
described (11). Images of the cells were obtained under a fluo‑ Thermo Fisher Scientific, Inc.) as previously described (16).
rescence microscope following transfection for 72 h. Reverse Briefly, Eca‑109 and TE‑1 cells (1x10⁶ cells/tube) were stained
transcription‑quantitative PCR (RT‑qPCR) and western blot‑ with 10 µl Annexin V‑allophycocyanin, and apoptotic cells were
ting were used to analyze the transfection efficiency. analyzed by flow cytometry (FACSCalibur, Beckman Coulter).
RT‑qPCR. Total RNA was extracted and reversed transcribed Wound healing assay. The wound healing assay was performed
into cDNA using TRIzol® reagent (Invitrogen; Thermo Fisher as previously described (17) using a Celigo cytometer. Briefly,
Scientific, Inc.) and Promega's Universal Riboclone cDNA Eca‑109 and TE‑1 cells expressing GFP were seeded into
synthesis system (Promega Corp.), respectively, according 96‑well plates at a density of 5x10⁴ cells/well and a scratch
to the manufacturers' protocols. qPCR was subsequently was made in the cell monolayer. The fluorescence indicates
performed using a SYBR Green Master mix (Takara the efficiency of transfection. After scratching, the cells were
Biotechnology Co., Ltd.), using GAPDH as the endogenous cultured in serum‑free DMEM for 24 h. Images of the scratch
control. The following forward and reverse primers sequences were obtained at 0 and 24 h using Celigo which can identify
were used for the qPCR: GAPDH forward, 5'‑TGACTTCAA cells with green fluorescence and images were captured.
CAGCGACACCCA‑3' and reverse, 5'‑CACCCTGTTG CT
GTAGCCAAA‑3'; and PNO1 forward, 5'‑TGTTAAACCCCT Cell Transwell assay. Cell Transwell assay was performed with
AAAGGGAGACC‑3' and reverse, 5'‑CCTTGTCCGTGTCAC Transwell kits (Corning, Inc.) as previously described (18).
ATTCTCT‑3'. Expression levels were quantified using the Briefly, 1x10⁵ cells suspended in 100 µl serum‑free DMEM
2‑ΔΔCq method (12). were seeded into the upper chambers. The lower chambers
were filled with 600 µl DMEM supplemented with 30% FBS.
Western blotting. Total protein was extracted from cells Following culture for 8 h, cells were fixed with 4% parafor‑
using radioimmunoprecipitation lysis buffer (RIPA, Solarbio maldehyde for 30 min and stained with crystal violet aqueous
Technology Co., Beijing, China). The extracted protein solution (0.5%). Cells were subsequently visualized under a
was separated by SDS‑PAGE and transferred onto PVDF microscope (Olympus).
membranes. The membranes were subsequently incubated with
primary antibodies (Table I). Following the primary antibody Cell invasion assay. Cell invasion assay was performed
incubation, the membranes were incubated with anti‑mouse using BioCoat™ Matrigel® Invasion chambers (Corning,
IgG (1:5,000; cat. no. sc‑2005; Santa Cruz Biotechnology, Inc.) as previously described (19). Briefly, 500 µl serum‑free
Inc.) and anti‑rabbit IgG (1:5,000; cat. no. sc‑2004; Santa Cruz medium was plated into both the upper and lower chambers
Biotechnology, Inc.) secondary antibodies. Protein bands were for 2 h at 37˚C to rehydrate the Matrigel matrix. Subsequently,
visualized using a Pierce™ ECL Western Blotting substrate 1x10⁵ cells in 500 µl serum‑free DMEM were seeded into
(Thermo Fisher Scientific, Inc.). the upper chamber and 750 µl DMEM supplemented with
30% FBS was added into the lower chamber. Following incu‑
Celigo cell counting assay. A Celigo cell counting assay bation for 8 h, Giemsa staining solution was added, and images
was performed as previously described (13). Briefly, Eca‑109 were captured using a microscope (Olympus).
and TE‑1 cells were seeded into 96‑well plates at a density
of 2x10³ cells/well. Cells were cultured for a total of 120 h, Protein‑protein interaction analysis. The BioGRID database
and cells were counted with a Celigo® Cell Imaging cytometer (https://thebiogrid.org) (20) was used to identify proteins that
(Nexcelom Bioscience) every 24 h. interacted with PNO1 in humans.
Colony formation assay. A cell colony formation assay was Gene set enrichment analysis (GSEA). GSEA version 3.0 soft‑
performed as previously described (14). Briefly, Eca‑109 ware (software.broadinstitute.org/gsea/index.jsp) was used for
and TE‑1 cells were seeded into 6‑well plates at a density of GSEA (21). A false discovery rate (FDR q‑val) of ≤25% and
800 cells/well. Following the culture of the cells for 2 weeks, nominal P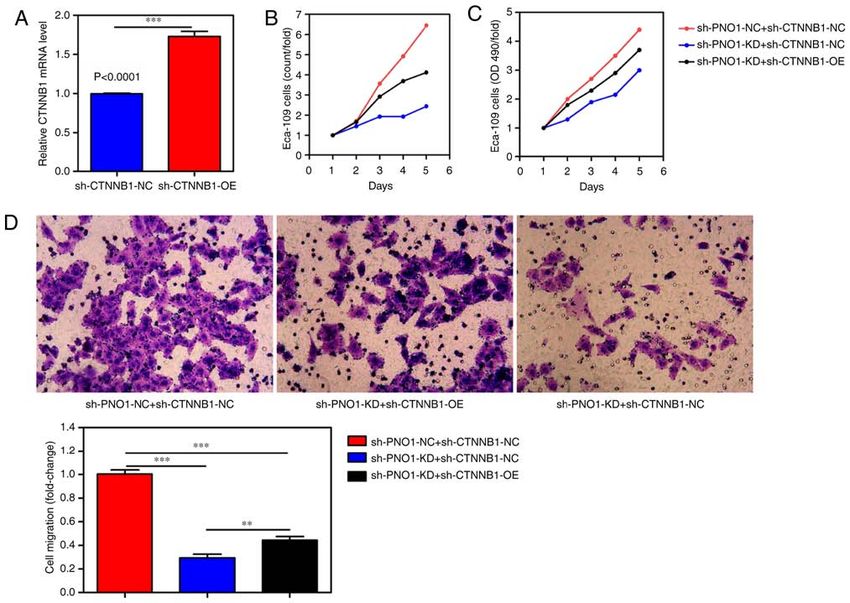
ONCOLOGY REPORTS 45: 85, 2021                                                    3

Table I. List of the primary antibodies used in the western blot analysis.

					Weight
Gene Abbreviation Host Company Cat. no. (kDa) Dilution

Cadherin 1                                            CDH1      Mouse Cell Signaling                 14472s      135      1:100
			Technology,
			                                                                    Inc. (CST)
Mitogen‑activated protein kinase 14                   P38       Rabbit CST                             8690    40         1:300
Phosphorylated‑nuclear factor κB                      p‑NFKB    Rabbit CST                             3033s    65        1:200
Matrix metallopeptidase 9                             MMP9      Rabbit CST                            13667s    84        1:300
Mechanistic target of rapamycin kinase                mTOR      Rabbit CST                             2983    289        1:300
Catenin β1                                            CTNNB1    Rabbit CST                             9562    92         1:300
Phosphorylated‑AKT serine/threonine kinase            p‑AKT     Rabbit CST                             4060    60         1:1,000
Cadherin 2                                            CDH2      Rabbit CST                             13116  140         1:100
Phosphorylated‑mitogen‑activated protein kinase 14    p‑P38     Rabbit CST                             4631    43         1:300
Phosphorylated‑catenin β1                             p‑CTNNB1 Rabbit CST                              2009s   92         1:300
Nuclear factor κB p65                                 NF‑κB p65 Rabbit CST                             8242    65         1:500
MYC proto‑oncogene, bHLH transcription factor         myc       Rabbit Abcam                         ab32072   57         1:100
NFKB inhibitor α                                      NFKBIA    Rabbit Abcam                          ab7217  35.6        1:300
Matrix metallopeptidase 2                             MMP2      Rabbit Abcam                         ab37150   72         1:300
Twist family bHLH transcription factor                Twist     Rabbit Abcam                         ab50581   21         1:300
Fibronectin 1                                         FN1       Mouse Abcam                           ab6328  >250        1:100
AKT serine/threonine kinase 1                         AKT1      Rabbit Abcam                        ab183758   56         1:300
Phosphorylated‑mechanistic target of rapamycin kinase p‑mTOR    Rabbit Abcam                        ab109268 289          1:300
Fartner of NOB1 homolog                               PNO1      Rabbit Santa Cruz                   sc‑133263  31         1:100
			Biotechnology,
			Inc.
Glyceraldehyde‑3‑phosphate dehydrogenase              GAPDH     Mouse Santa Cruz                    sc‑32233      36      1:500
			Biotechnology,
			Inc.

the Guide for the Care and Use of Laboratory Animals of the        and 664 normal samples from databases were analyzed. As
National Institutes of Health [National Research Council (US)      shown in Fig. 1A, PNO1 expression levels were upregulated
Institute for Laboratory Animal Research, 1996] and were           in the tumor tissues compared with that in the 664 normal
approved by the Ethics Committee of The First Affiliated           tissues (P
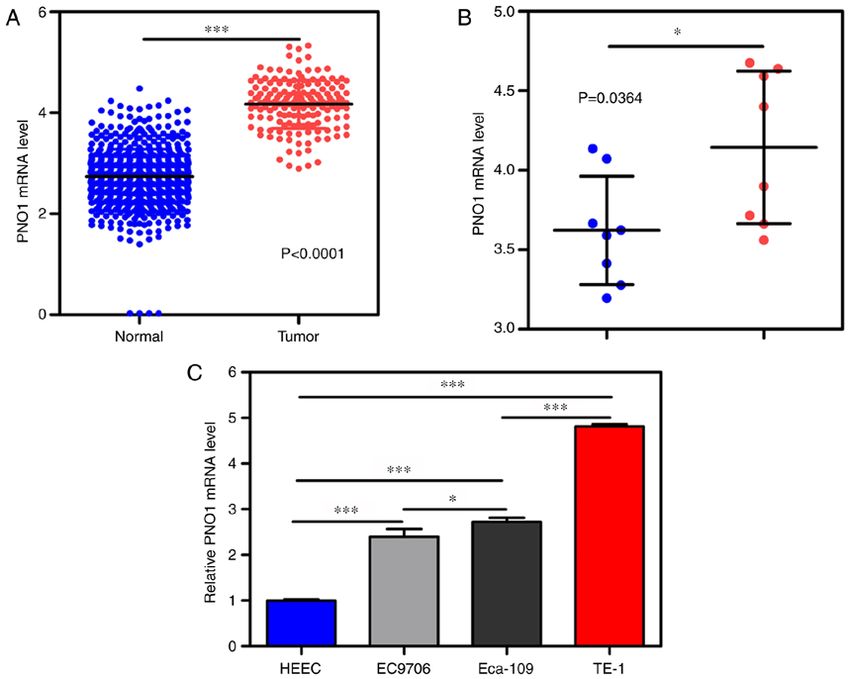
4                                           WANG et al: EFFECT OF PNO1 ON ESOPHAGEAL CANCER

Figure 1. Expression levels of PNO1 in EC. (A) Data from the TCGA database indicated that PNO1 expression levels were upregulated in tumor tissue
(n=159) compared with normal tissues (n=664). (B) Data from TCGA database indicated that PNO1 expression levels were upregulated in tumor tissues (n=8)
compared with normal tissues (n=8). (C) Reverse transcription‑quantitative PCR analysis revealed that PNO1 expression levels were downregulated in normal
cells (HECC) compared with tumor cell lines (TE‑1, Eca‑109 and EC9706). The data are presented as the mean ± SD. *P90 and 70%, respectively.                  cells, while the OD490/fold value of sh‑PNO1‑KD‑transfected
Furthermore, RT‑qPCR (Fig. S1C and D) and western blotting                    TE‑1 cells was decreased by ~2.5‑fold compared with
(Fig. S1E and F) were conducted to verify the transduction                    sh‑PNO1‑NC‑transfected TE‑1 cells (Fig. 2C).
efficiency, and the results were consistent with the fluorescence                 To determine the effects of PNO1 on the apoptosis of
microscopy results (P
ONCOLOGY REPORTS 45: 85, 2021                                                                   5

Figure 2. KD of PNO1 suppresses cell proliferation and promotes cell apoptosis. Results of the (A) Celigo cell counting assay, (B) colony formation assay
and (C) MTT assay demonstrated that the cell proliferative ability was decreased following the KD of PNO1 in Eca‑109 and TE‑1 cells. (D) Results from
flow cytometric analysis revealed that the cell apoptosis ability increased following the silencing of PNO1 in Eca‑109 and TE‑1 cells. (E) Tumor volume was
decreased in the sh‑PNO1 group compared with the sh‑NC group. The data are presented as the mean ± SD. ***P
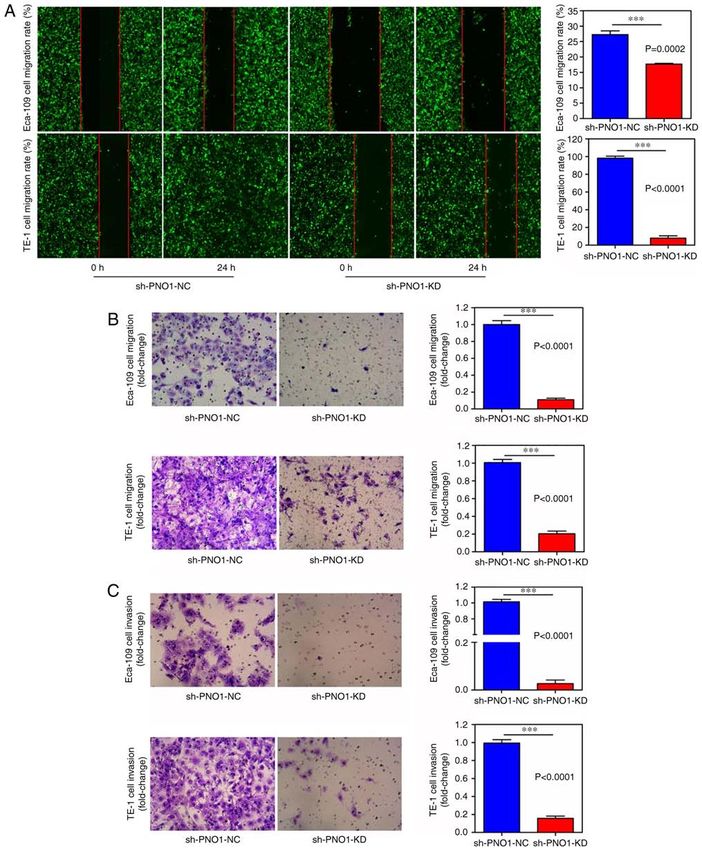
6                                           WANG et al: EFFECT OF PNO1 ON ESOPHAGEAL CANCER

Figure 3. KD of PNO1 promotes cell migration and invasion. (A) Wound healing, (B) Transwell migration and (C) Transwell invasion assays demonstrated that
the cell migration and invasion abilities were reduced following the knockdown of PNO1 in Eca‑109 and TE‑1 cells. The data are presented as the mean ± SD.
***
   P
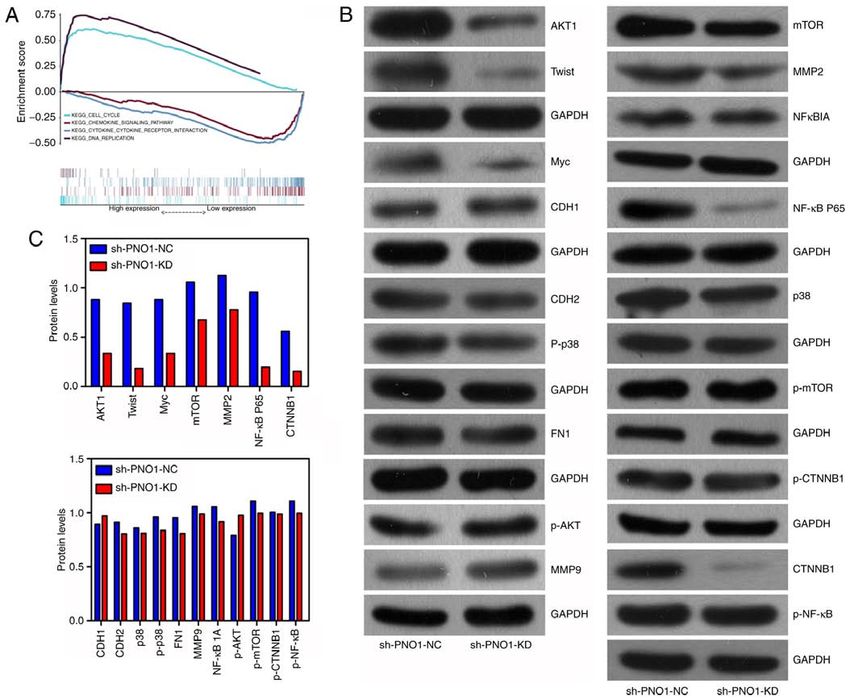
ONCOLOGY REPORTS 45: 85, 2021                                                                 7

Figure 4. Biological mechanisms of PNO1 in esophageal cancer. (A) Gene Set Enrichment Analysis based on data from The Cancer Genome Atlas database
found that pathways related to the cell cycle and DNA replication were upregulated in the PNO1 high expression phenotype, while pathways associated with
chemokine signaling pathways and cytokine‑cytokine receptor interaction were downregulated in the PNO1 low expression phenotype. (B and C) Protein
expression levels of AKT1, Twist, Myc, mTOR, MMP2, NF‑κ B p65 and CTNNB1 were downregulated in sh‑PNO1‑KD‑transfected Eca‑109 cells compared
with sh‑PNO1‑NC‑transfected Eca‑109 cells. Protein expression levels of CDH1, CDH2, p38, p‑p38, FN1, MMP9, NFKBIA, p‑AKT, p‑mTOR, p‑CTNNB1,
p‑NF‑κ B and Slug were similar in the sh‑PNO1‑KD‑transfected Eca‑109 and sh‑PNO1‑NC‑transfected Eca‑109 cells. CDH1, cadherin 1; p‑, phosphorylated;
FN1, fibronectin 1; MMP9, matrix metalloproteinase 9; NFKBIA, NF‑κ B inhibitor α; PNO1, partner of NOB1 homolog; MMP2, matrix metalloproteinase 2;
CTNNB1, β‑catenin 1; KD, knockdown; sh, short hairpin RNA; NC, negative control.

were upregulated, while pathways associated with chemokine                    CTNNB1 may be a potential direct downstream target of
signaling pathways and cytokine‑cytokine receptor interaction                 PNO1 in EC. As shown in Fig. 4B and C, CTNNB1 was
were downregulated in the PNO1 low expression phenotype                       found to be regulated by PNO1. In addition, the results
(Fig. 4A), which indicated that PNO1 may promote EC growth                    obtained from BioGRID identified that CTNNB1 interacted
via regulating genes related to the cell cycle and DNA replication.           with PNO1 (data not shown). Hence, a rescue experiment
Thus, the expression levels of molecules related to the cell cycle            was designed to verify the relationship between CTNNB1
were investigated in Eca‑109 cells. As shown in Fig. 4B and C,                and PNO1 in EC. We here overexpressed CTNNB1 in
the protein expression levels of AKT1, Twist, Myc, mTOR,                      Eca‑109 cells (Fig. 5A) and split Eca‑109 cells into three
matrix metalloproteinase (MMP)2, NF‑κB p65 and CTNNB1                         groups: i) sh‑PNO1‑NC+sh‑CTNNB1‑NC‑transfected
were downregulated in sh‑PNO1‑KD‑transfected Eca‑109 cells                    Eca‑109 cells; ii) sh‑PNO1‑KD+sh‑CTNNB1‑NC‑transfected
compared with in sh‑PNO1‑NC‑transfected Eca‑109 cells.                        Eca‑109 cells; and iii) sh‑PNO1‑KD + sh‑CTNNB1‑over‑
However, the protein expression levels of cadherin (CDH)1,                    expression (OE)‑transfected Eca‑109 cells. Cell counting
CDH2, p38, phosphorylated (p)‑p38, fibronectin 1, MMP9,                       (Fig. 5B), MTT (Fig. 5C) and Transwell assays (Fig. 5D)
NF‑κB inhibitor α, p‑AKT, p‑mTOR, p‑CTNNB1 and p‑NF‑κB                        were performed with the three groups. Compared with the
were similar in both sh‑PNO1‑KD‑transfected Eca‑109 and                       sh‑PNO1‑NC+sh‑CTNNB1‑NC group, the proliferation and
sh‑PNO1‑NC‑transfected Eca‑109 cells (Fig. 4B and C).                         invasion of the sh‑PNO1‑KD+sh‑CTNNB1‑NC‑transfected
8                                           WANG et al: EFFECT OF PNO1 ON ESOPHAGEAL CANCER

Figure 5. CTNNB1 is a potential direct downstream target of PNO1 in esophageal cancer. (A) CTNNB1 expression was overexpressed in the Eca‑109 cells after
transfection. Results of the (B) Celigo cell counting, (C) MTT, and (D) Transwell assays revealed that CTNNB1 overexpression abolished the effects of the
knockdown of PNO1 in Eca‑109 cells. The data are presented as the mean ± SD. **P
ONCOLOGY REPORTS 45: 85, 2021                                                        9

normal tissues. The differential expression of PNO1 indicated          CTNNB1 were not performed. Also, we failed to detect the
that PNO1 may play a role in EC progression. To verify this            expression of PNO1 in fresh samples to verify the results
hypothesis, PNO1 expression was knocked down in Eca‑109                obtained from public databases. Finally, we failed to detect the
and TE‑1 cells, and the results revealed that the cell prolifera‑      transfection efficiency of PNO1 in vivo.
tion, migration and invasion abilities decreased, while the cell           In conclusion, the findings of the present study suggested
apoptosis ability was increased following the KD. In addition, in      that PNO1 may promote EC progression by regulating the
nude mice, a smaller tumor volume was observed following the           expression of AKT1, Twist, Myc, mTOR, MMP2, NF‑κ B p65
KD of PNO1 expression. These results indicated that PNO1 may           and CTNNB1.
promote EC progression. Previous studies have also identified
PNO1 as a tumor‑promoting factor in hepatocellular carcinoma           Acknowledgements
and colorectal cancer. For example, Dai et al reported that the
growth and metastasis of hepatocellular carcinoma was inhibited        Not applicable.
following the silencing of PNO1 (6). Wang et al and Shen et al
knocked down PNO1 expression in colorectal cell lines (PKO             Funding
and HCT116) and found that the cell viability and colony forma‑
tion rate were decreased and that the percentage of cells in the       The Natural Science Key Projects of Bengbu Medical College
G0/G1 phase and undergoing apoptosis increased (5,7). These            (no. BYKY2019087ZD) funded this research.
findings suggested that PNO1 may be an oncogene in EC.
    As described above, PNO1 was identified as an oncogene             Availability of data and materials
in EC. Thus, the mechanism underlying the effects of PNO1 in
EC was determined. Through GSEA, gene sets related to the              The datasets used during the present study are available from
cell cycle and DNA replication were found to be upregulated in         the corresponding author upon reasonable request.
the PNO1 high expression phenotype. These results indicated
that PNO1 may promote EC growth via regulating genes related           Authors' contributions
to the cell cycle and DNA replication. To verify this hypoth‑
esis, the expression levels of molecules related to the cell cycle     TT and GW both made substantial contributions to the concep‑
were analyzed in Eca‑109 cells with or without PNO1 KD.                tion and design of this study. GW, QL, CL, GD, HS, HD, YY
The NF‑κB and Wnt signaling pathways are involved in tumor             and CM made substantial contributions to the analysis and
proliferation, and NF‑κ B and CTNNB1 are key genes in the              interpretation of the data. TT and GW both made substantial
NF‑κB and Wnt signaling pathways, respectively (25,26). Thus,          contributions to writing the manuscript. All authors approved
the expression levels of NF‑κ B and CTNNB1 were analyzed               the final version to be published and are accountable for all
following the KD of PNO1. The results revealed that the expres‑        aspects of the work.
sion levels of both NF‑κB and CTNNB1 were downregulated in
the sh‑PNO1‑KD‑transfected Eca‑109 cells. In addition, the OE          Ethics approval and consent to participate
of CTNNB1 in sh‑PNO1‑KD‑transfected Eca‑109 cells reversed
the decreased proliferation of Eca‑109 cells. However, knock‑          The present study was approved by the Ethics Committee
down of PNO1 failed to change the level of phosphorylated              of the First Affiliated Hospital of Bengbu Medical College
CTNNB1. Two reasons may cause this phenomenon: Firstly, the            (Bengbu, Anhui, China).
level of phosphorylation is a process of modification of proteins
after translation, and the level of total protein also represent its   Patient consent for publication
level before translation. So, CTNNB1 may be phosphorylated
after translation. Secondly, protein level is regulated by upstream    Not applicable.
molecules, while phosphorylated protein is affected by kinases.
Thus, it is possible that PNO1 affected the expression of some         Competing interests
kinases and then the kinases regulated the phosphorylation of
CTNNB1. Although, the level of phosphorylated CTNNB1 did               The authors declare that they have no competing interests.
not change, we can still draw a conclusion that CTNNB1 is a
downstream target of PNO1 in EC.                                       References
    PNO1 was observed to promote EC metastasis in previous
studies, and the expression levels of Twist, Myc and MMP2,              1. Domper Arnal MJ, Ferrández Arenas Á and Lanas Arbeloa Á:
                                                                           Esophageal cancer: Risk factors, screening and endoscopic treat‑
which are genes known to participate in the tumor metastasis               ment in western and eastern countries. World J Gastroenterol 21:
process (27‑29), were also analyzed following the KD of                    7933‑7943, 2015.
PNO1. The results suggested that PNO1 may promote EC                    2. Udagawa H and Akiyama H: Surgical treatment of esophageal
                                                                           cancer: Tokyo experience of the three‑field technique. Dis
metastasis via upregulating Twist, Myc and MMP2 expression                 Esophagus 14: 110‑114, 2001.
levels. Altogether these data suggest that PNO1 may promote             3. Gibson TJ, Thompson JD and Heringa J: The KH domain occurs
EC progression via upregulating NF‑κ B p65, CTNNB1, Twist,                 in a diverse set of RNA‑binding proteins that include the anti‑
                                                                           terminator NusA and is probably involved in binding to nucleic
Myc and MMP2 expression. Our study was consistent with                     acid. FEBS Lett 324: 361‑366, 1993.
previous studies (27‑29).                                               4. Zhou GJ, Zhang Y, Wang J, Guo JH, Ni J, Zhong ZM, Wang LQ,
                                                                           Dang YJ, Dai JF and Yu L: Cloning and characterization of a
    There were limitations to the present research. Experiments            novel human RNA binding protein gene PNO1. DNA Seq 15:
to determine the direct association between PNO1 and                       219‑224, 2004.
10 WANG et al: EFFECT OF PNO1 ON ESOPHAGEAL CANCER
5. Wa ng X, Wu T, Hu Y, Ma rci n k iewicz M, Q i S, 18. Song Y, Dong MM and Yang HF: Effects of RNA interference
Valderrama‑Carvajal H, Luo H and Wu J: Pno1 tissue‑specific targeting four different genes on the growth and proliferation of
expression and its functions related to the immune responses and nasopharyngeal carcinoma CNE‑2Z cells. Cancer Gene Ther 18:
proteasome activities. PLoS One 7: e46093, 2012. 297‑304, 2011.
6. Dai H, Zhang S, Ma R and Pan L: Celecoxib inhibits hepatocel‑ 19. Zengel P, Ramp D, Mack B, Zahler S, Berghaus A, Muehlenweg B,
lular carcinoma cell growth and migration by targeting PNO1. Gires O and Schmitz S: Multimodal therapy for synergic inhibi‑
Med Sci Monit 25: 7351‑7360, 2019. tion of tumour cell invasion and tumour‑induced angiogenesis.
7. Shen A, Chen Y, Liu L, Huang Y, Chen H, Qi F, Lin J, Shen Z, BMC Cancer 10: 92, 2010.
Wu X, Wu M, et al: EBF1‑mediated upregulation of ribosome 20. Chatr‑Aryamontri A, Oughtred R, Boucher L, Rust J, Chang C,
assembly factor PNO1 contributes to cancer progression by Kolas NK, O'Donnell L, Oster S, Theesfeld C, Sellam A, et al:
negatively regulating the p53 signaling pathway. Cancer Res 79: The BioGRID interaction database: 2017 update. Nucleic Acids
2257‑2270, 2019. Res 45D: D369‑D379, 2017.
8. Gao L, Li X, Nie X, Guo Q, Liu Q, Qi Y, Liu J and Lin B: 21. Subramanian A, Tamayo P, Mootha VK, Mukherjee S, Ebert BL,
Integrated analysis of lymphocyte infiltration‑associated Gillette MA, Paulovich A, Pomeroy SL, Golub TR, Lander ES and
lncRNA for ovarian cancer via TCGA, GTEx and GEO datasets. Mesirov JP: Gene set enrichment analysis: A knowledge‑based
PeerJ 8: e8961, 2020. approach for interpreting genome‑wide expression profiles. Proc
9. Zhang X, Wen X, Feng N, Chen A, Yao S, Ding X and Zhang L: Natl Acad Sci USA 102: 15545‑15550, 2015.
Increased expression of T‑box transcription factor protein 21 22. Senapin S, Clark‑Walker GD, Chen XJ, Séraphin B and
(TBX21) in skin cutaneous melanoma predicts better prognosis: A Daugeron MC: RRP20, a component of the 90S preribosome, is
study based on the cancer genome atlas (TCGA) and genotype‑tissue required for pre‑18S rRNA processing in Saccharomyces cerevi‑
expression (GTEx) databases. Med Sci Monit 26: e923087, 2020. siae. Nucleic Acids Res 31: 2524‑2533, 2003.
10. Ritchie ME, Phipson B, Wu D, Hu Y, Law CW, Shi W and 23. Tone Y and Toh‑EA: Nob1p is required for biogenesis of the 26S
Smyth GK: limma powers differential expression analyses for proteasome and degraded upon its maturation in Saccharomyces
RNA‑sequencing and microarray studies. Nucleic Acids Res 43: cerevisiae. Genes Dev 16: 3142‑3157, 2002.
e47, 2015. 24. Vanrobays E, Leplus A, Osheim YN, Beyer AL, Wacheul L
11. Fang KP, Dai W, Ren YH, Xu YC, Zhang SM and Qian YB: and Lafontaine DL: TOR regulates the subcellular distribution
Both Talin‑1 and Talin‑2 correlate with malignancy potential of DIM2, a KH domain protein required for cotranscriptional
of the human hepatocellular carcinoma MHCC‑97 L cell. BMC ribosome assembly and pre‑40S ribosome export. RNA 14:
Cancer 16: 45, 2016. 2061‑2073, 2008.
12. Livak KJ and Schmittgen TD: Analysis of relative gene expres‑ 25. Dolcet X, Llobet D, Pallares J and Matias‑Guiu X: NF‑κ B in
sion data using real‑time quantitative PCR and the 2(‑Delta Delta development and progression of human cancer. Virchows
C(T)) method. Methods 25: 402‑408, 2001. Arch 446: 475‑482, 2005.
13. Vinci M, Gowan S, Boxall F, Patterson L, Zimmerman M, 26. Tanabe S, Aoyagi K, Yokozaki H and Sasaki H: Regulation of
Court W, Lomas C, Mendiola M, Hardisson D and Eccles SA: CTNNB1 signaling in gastric cancer and stem cells. World J
Advances in establishment and analysis of three‑dimensional Gastrointest Oncol 8: 592‑598, 2016.
tumor spheroid‑based functional assays for target validation and 27. Khan MA, Chen HC, Zhang D and Fu J: Twist: A molecular
drug evaluation. BMC Biol 10: 29, 2012. target in cancer therapeutics. Tumour Biol 34: 2497‑2506,
14. Sun R, Wu J, Chen Y, Lu M, Zhang S, Lu D and Li Y: Down regu‑ 2013.
lation of Thrombospondin2 predicts poor prognosis in patients 28. Wang XN, Su XX, Cheng SQ, Sun ZY, Huang ZS and Qu TM:
with gastric cancer. Mol Cancer 13: 225, 2014. MYC modulators in cancer: A patent review. Expert Opin Ther
15. Moodley S, Koorbanally NA, Moodley T, Ramjugernath D and Pat 29: 353‑367, 2019.
Pillay M: The 3‑(4,5‑dimethylthiazol‑2‑yl)‑2,5‑diphenyl tetrazo‑ 29. Wang HL, Zhou PY, Zhang Y and Liu P: Relationships between
lium bromide (MTT) assay is a rapid, cheap, screening test for abnormal MMP2 expression and prognosis in gastric cancer: A
the in vitro anti‑tuberculous activity of chalcones. J Microbiol meta‑analysis of cohort studies. Cancer Biother Radiopharm 29:
Methods 104: 72‑78, 2014. 166‑172, 2014.
16. Fadok VA, Voelker DR, Campbell PA, Cohen JJ, Bratton DL and
Henson PM: Exposure of phosphatidylserine on the surface of
apoptotic lymphocytes triggers specific recognition and removal This work is licensed under a Creative Commons
by macrophages. J Immunol 148: 2207‑2216, 1992. Attribution-NonCommercial-NoDerivatives 4.0
17. Arsic N, Bendris N, Peter M, Begon‑Pescia C, Rebouissou C, International (CC BY-NC-ND 4.0) License.
Gadéa G, Bouquier N, Bibeau F, Lemmers B and Blanchard JM:
A novel function for cyclin A2: Control of cell invasion via RhoA
signaling. J Cell Biol 196: 147‑162, 2012.You can also read