A High-Throughput Soft Agar Assay for Identification of Anticancer Compound

Page created by Eugene Jackson
 
CONTINUE READING
A High-Throughput Soft Agar Assay for Identification of Anticancer Compound
A High-Throughput Soft Agar Assay for Identification
                            of Anticancer Compound

                    STEVEN N. ANDERSON, DANLI L. TOWNE, DAVID J. BURNS, and USHA WARRIOR

      A 384-well soft agar assay was developed to identify potential novel anticancer compounds. Normally used to detect cell trans-
      formation, the assay is used here to quantitate cell proliferation in a 3-dimensional (3-D) anchorage-independent format. HCC827
      cells, which are highly sensitive to epithelial growth factor receptor (EGFR) tyrosine kinase inhibitors, were used to develop the
      method and a set of 9600 compounds used to validate the assay. Results were compared to a monolayer assay using the same
      compound set. The assay provides a robust method to discover compounds that could be missed using traditional monolayer for-
      mats. (Journal of Biomolecular Screening 2007:938-945)

      Key words:     soft agar, HTS, 3-D, anoikis, HCC827

                            INTRODUCTION                                                 found in a traditional screen using monolayers. Thus, a high-
                                                                                         throughput screen (HTS) developed to detect compounds with

G        ROWTH OF CELLS IN SOFT AGAR is one of the hallmark char-
        acteristics of cellular transformation and uncontrolled cell
growth, with normal cells typically not capable of growth in semi-
                                                                                         antiproliferative activity in soft agar would be predicted to be
                                                                                         superior to screening compounds in monolayers.
                                                                                             Using traditional soft agar methods to manually count colonies
solid matrices. Used to detect cancer cell transformation and val-                       would be difficult and cumbersome for an HTS assay. Several dif-
idate cancer targets, soft agar drug sensitivity assays have been                        ferent endpoints have been employed to quantitate colony forma-
used to test anticancer compounds since Hamburger and Salmon                             tion, including manual counting of colonies in 6- or 24-well
developed the human tumor clonogenic assay in 1977.1,2 In addi-                          plates,1,16,17 and in a limited scale by 3-H thymidine incorporation
tion, it has been proposed that testing drugs in a 3-dimensional                         and high-content analysis.18,19 Many of these assay methods
(3-D) format, like soft agar, is superior to using monolayer cul-                        require 3 to 4 weeks of growth before the colonies can be enu-
tures as cell growth in 3-D is more similar to the in vivo cellular                      merated, and the counting of each well is labor intensive. Recently,
environment.3-8 Normal epithelial cells are supported by basement                        some investigators have used metabolic tetrazolium dyes such
membranes providing survival and proliferative signals and undergo                       as MTT ([3-(4,5-dimethylthiazol-2-yl)-2,5-diphenyltetrazolium
apoptosis when placed in suspension culture.9,10 Alternatively,                          bromide])11,20,21 and alamarBlue,22 a redox indicator, to provide an
cancer cells are able to evade attachment-regulated apoptosis                            indirect measure of viable cell number to quantify cell growth in
(anoikis), leading to uncontrolled proliferation. Therefore, assays                      soft agar. Although these methods do not measure colony size,
using anchorage-independent conditions have been developed to                            these assay plates can be read in a standard plate reader, which
discover compounds that cause reversion of transformed cells to                          eliminates manual counting errors and greatly increases through-
normal and inhibit cell growth under anchorage-independent con-                          put required for drug screening studies.
ditions.7,8,11-15 Anchorage-independent assays would be expected                             Here, we describe a 384-well HTS assay designed to discover
to discover not only compounds targeting cancer cell proliferation                       compounds inhibiting the growth of HCC827 human lung cancer
but also unique compounds inducing anoikis that would not be                             cells in soft agar. Optimal conditions for running a robust HTS
                                                                                         assay, including cell density, time of culture, Z′ factor, and DMSO
                                                                                         sensitivity, are determined for this assay format. Results are also
                                                                                         presented for a comparison study of 9600 compounds in a soft
Abbott Laboratories, Global Pharmaceutical Research and Development,                     agar assay screen versus a monolayer screen to evaluate and com-
Department of Biological Screening, Abbott Park, IL.
                                                                                         pare the robustness of the soft agar format. Results of several
Received Mar 13, 2007, and in revised form Jun 25, 2007. Accepted for publi-             known kinase inhibitors, including staurosporine, Tarceva
cation Jun 27, 2007.                                                                     (erlotinib), Zactima (vandetanib), Iressa (gefitinib), and Gleevec
Journal of Biomolecular Screening 12(7); 2007                                            (imatinib), are included in this study to demonstrate the feasibil-
DOI: 10.1177/1087057107306130                                                            ity of HTS soft agar assays for identifying active compounds.

938     www.sbsonline.org                                                                                              © 2007 Society for Biomolecular Sciences
                                                        Downloaded from jbx.sagepub.com by guest on October 12, 2015
384-Well Soft Agar HTS Assay

                MATERIALS AND METHODS                                                              Add 10 µL of 0.6% agar/medium to
                                                                                              384-well nontreated plates to form base layer
Cells                                                                                                               ↓
                                                                                                      Add 50 µL cells in 0.4% agar
   HCC827 cells (ATCC, Manassas, VA) are derived from human                                                         ↓
non–small cell lung carcinoma23,24 and maintained as monolayers                            Within 24 h, add 10 µL of compound in 1x medium
in 162-cm2 Costar flasks (Corning Costar Corporation, Corning,                                                      ↓
NY) using RPMI 1640 Medium supplemented with 10% fetal                                                     Incubate for 7 days
bovine serum (FBS), 10 mM HEPES, 1 mm sodium pyruvate,                                                              ↓
                                                                                   Utilize alamarBlue (7 µL) to quantitatenumbers of cells in each well
4.5 g/L glucose, and 100 U/mL penicillin-streptomycin (all from
                                                                                              Read using plate reader at ex 531: em 615 nm
Invitrogen, Carlsbad, CA). Cultures were maintained at 37 °C in a
humidified atmosphere of 5% CO2 in a Sanyo model MCO-20AIC                        FIG. 1.        Flow diagram of 384-well soft agar assay.
incubator (Sanyo, Bensenville, IL).

Soft agar assay                                                                   Compound preparation
   The method presented here is modified from previously                              IC50 determination. Compounds for IC50 determinations were
published reports1,16,22 and designed for testing anticancer                      prepared as 5-mM stock solutions in DMSO. Compounds were
agents in 384-well plate HTS assays (Fig. 1). Noble agar                          serially diluted to their required concentrations in DMSO and 1 µL
(Sigma, St. Louis, MO) was prepared as a 5% solution of water                     transferred to a Greiner (Monroe, NC) polypropylene 384-well
and autoclaved in order to melt it into solution and for steril-                  plate. Using a Flexdrop automated dispenser (PerkinElmer),
ization. The agar was allowed to solidify and remelted for each                   which was previously rinsed with ethanol to help maintain steril-
assay using a microwave oven. A 0.6% agar/medium base layer                       ity, 70 µL of medium was then added to the drug plate. Next, 10
added to each well prevented cells from attaching and forming a                   µL of compound was transferred from the drug dilution plate to
monolayer on the plastic substrate. Then, 12 mL of 5% agar at                     plates containing cells in soft agar using a Beckman FX robotic
65 °C was mixed with 88 mL of supplemented medium as                              system (Fullerton, CA). The plates were placed back into the incu-
described above at 45 °C. Then, 10 µL of the 0.6% agar was                        bator, and the cells were allowed to grow a minimum of 7 days for
quickly pipetted into Costar nontreated plates (Corning Costar                    the soft agar format and 3 days for the monolayer format.
Corporation) that were previously warmed to 42 °C to prevent
the agar from solidifying to the sides of the plate. Each plate                       Primary screen. Compounds tested in the primary screen were
was tapped on a solid surface to ensure that the agar was on the                  processed in a similar fashion using mixtures of 10 compounds
bottom of the wells. The plates were left at room temperature                     per well as previously described.25 Then, 2.5 µL of the 500-µM
to allow the agar to solidify before placing them into a 42 °C                    compound stock mixtures, solubilized in DSMO, were placed in
incubator to warm before dispensing of the cells.                                 a Greiner 384-well polypropylene plate. Next, 100 µL of medium
   Cells to be seeded within agar were dissociated with trypsin-                  was added to each well as described above and 10 µL of the com-
EDTA (Invitrogen) and suspended in medium. Cells were                             pound solution transferred to the soft agar assay plate to produce
counted, centrifuged, and the resulting cell pellet triturated in                 a final screening concentration of 2 µM. Hits from the mixed drug
medium and kept at 40 °C. Then, 8 mL of 5% agar, cooled to                        plates were confirmed at a 10-µM concentration as single com-
45 °C, was added to each 92 mL of cells/medium, producing a                       pounds before determination of an IC50.
0.4% agar suspension. In addition, 50 µL of cell/agar suspension
was quickly added to each well before the solution solidified                     Monolayer assay format
using a Matrix 12-channel pipettor (Hudson, NH). The plates
were again tapped on a solid surface to ensure that all the con-                     To determine the quality of the soft agar assay, results were
tents of the well settled to the bottom. The plates were kept at                  compared to a monolayer format that was previously performed
room temperature for at least 1 to 2 h to ensure the contents com-                using CyQUANT NF (Invitrogen) as an endpoint. CyQUANT NF
pletely gelled. The plates were transferred into a Sanyo humidi-                  was not used in the soft agar format, for a direct comparison to the
fied incubator overnight before the addition of compounds. Cells                  monolayer format, because the cells could not be easily separated
were incubated with compounds typically for 7 days before                         from the agar. The monolayer assays were performed in Greiner
alamarBlue (Invitrogen) was used to quantitate cell viability in                  black-walled/clear-bottom 384-well Poly-D-Lysine-coated plates
each well. Then, 7 µL of alamarBlue was added to each well and                    and were performed similarly to the soft agar assay with the
allowed to incubate at 37 °C. Plates were read on an Envision                     exception of the culture time reduced to 3 from 7 days. The assay
plate reader (PerkinElmer, Shelton, CT) using excitation/emission                 was terminated by discarding the medium on the cells and adding
wavelengths of 531:615 nm.                                                        25 µL of CyQUANT NF Cell Proliferation Assay reagent to each

Journal of Biomolecular Screening 12(7); 2007                                                                                       www.sbsonline.org   939
                                                 Downloaded from jbx.sagepub.com by guest on October 12, 2015
Anderson et al.

well for 1 h. The fluorescent intensity was measured using a                            A
ViewLux reader with an excitation wavelength of 480 nm and an
emission wavelength of 540 nm.                                                                                            8.E+06

                                                                                          Fluorescent Intensity
                                                                                                                          7.E+06
                                                                                                                          6.E+06
                                                                                                                          5.E+06
Data analysis                                                                                                             4.E+06
                                                                                                                          3.E+06
  IC50s were determined using GraphPad Prism software                                                                     2.E+06
                                                                                                                          1.E+06                                                                Untreated
employing a nonlinear regression analysis.                                                                                0.E+00
                                                                                                                                                                                                Detergent-treated
                                                                                                                                                       100      300     1000    3000     5000   background
                RESULTS AND DISCUSSION                                                                                                                         Number of Cells Seeded

Assay optimization
                                                                                        B
    To establish a robust HTS assay for testing compounds in soft
agar assays, we determined the optimal screening conditions for                                                                               7.E+06

                                                                                                                      Fluorescent Intensity
                                                                                                                                              6.E+06
HCC827 cells. Five different cell concentrations ranging from 100                                                                             5.E+06
to 5000 cells per well were seeded as described above and allowed                                                                             4.E+06
to grow for 7, 10, and 18 days in soft agar. Then, 10 µL of BRIJ35                                                                            3.E+06
                                                                                                                                              2.E+06
solution (0.3% final concentration) was added to control wells                                                                                1.E+06                                            Untreated

within 24 h after seeding to disrupt all cells and served as a nega-                                                                          0.E+00
                                                                                                                                                                                                Detergent-treated
                                                                                                                                                         100      300    1000    3000    5000
tive control for cell growth. AlamarBlue was added to wells, and                                                                                                                                background
                                                                                                                                                                Number of Cells Seeded
the plates were read after 6 h of exposure. Figure 2 illustrates the
results demonstrating that 5000 cells produced the best signal. At
day 7, the signal after 6 h of alamarBlue exposure was 6.3 million                        C
fluorescent units (FUs) compared to 1.6 million FU in the control
detergent-treated wells. A signal-to-noise window of 4 and a Z′                                                                               5.E+06
                                                                                                           Fluorescent Intensity

factor of 0.5 were observed for these conditions. Ten days of incu-                                                                           4.E+06

bation resulted in a less robust response with a window of 3.7 and                                                                            3.E+06

Z′ factor of 0.2. Results on day 18 showed an increased window                                                                                2.E+06

after 6 h of alamarBlue exposure using 3000 cells per well but an                                                                             1.E+06
                                                                                                                                                                                                Untreated
unacceptable Z′ factor of less than 0. From these results, it was                                                                             0.E+00
                                                                                                                                                        100      300     1000    3000           Detergent-treated
determined that future experiments would incorporate 5000 cells                                                                                                                                 background
                                                                                                                                                                Number of Cells Seeded
per well in the testing of compounds.
    In the same experiment, the optimum time for incubation with                   FIG. 2. Determination of optimal culture time in soft agar. (A)
alamarBlue was also determined to optimize the signal. Figure 3                    Seven-day culture, (B) 10-day culture, and (C) 18-day culture. n = 288
illustrates that on day 7, 6 h of exposure to alamarBlue gave                      nontreated wells and n = 48 detergent-treated wells for each cell
optimal results with a Z′ of 0.5. Lower incubation times with                      number indicated. Error bars represent standard deviation.
alamarBlue produced less than optimal results. Plates read on day
10, after cell seeding, were also exposed for longer time periods
with almarBlue to determine if the signal and Z′ factor could be                   cell soft agar assay. Figure 5 shows the concentration response
further increased. Longer times of exposure increased the window                   of HCC827 cells in soft agar to the control compounds both at
and the Z′, but the results indicated a depletion of alamarBlue by                 6 and 24 h of exposure to alamarBlue. Similar IC50s were observed
24 h (results not shown), which may make the assay less sensitive.                 for both time points. As expected, staurosporine, Tarceva,
Thus, it was established from the above optimization assays that                   Zactima, and Iressa demonstrated nanomolar IC50 potencies
compounds would be tested by seeding 5000 cells per well and                       against HCC827 cells in soft agar, whereas lapatinib, a dual
incubated an additional 7 days after compound addition.                            inhibitor of the receptors ErbB1 and ErbB2,26 was less potent and
    Sensitivity of the assay format to DMSO was also determined                    Gleevec, an abl kinase inhibitor,27 was inactive up to 10 µM.
by adding different concentrations of DMSO 24 h after seeding                      Tarceva, Zactima, and Iressa (inhibitors of epidermal growth factor
the cells. Figure 4 illustrates that DMSO concentrations below                     receptor [EGFR] tyrosine kinase) are known to be very potent
0.3% have no effect on the assay at either 7 or 10 days.                           inhibitors of cell proliferation,28-31 with Tarceva and Iressa having
                                                                                   reported nanomolar potency against HCC827 cell proliferation.32,33
Test compounds                                                                     Staurosporine is a well-known broad-spectrum kinase inhibitor,
                                                                                   and it is known to be highly potent in cell proliferation assays.34
   Five kinase inhibitors—lapatinib, Tarceva, Zactima, Iressa,                     Because the control compounds in this 384-well soft agar assay
Gleevec, and staurosporine—were chosen to validate the HCC827                      produced results similar to literature values, a soft agar screen

940   www.sbsonline.org                                                                                                                                           Journal of Biomolecular Screening 12(7); 2007
                                                  Downloaded from jbx.sagepub.com by guest on October 12, 2015
384-Well Soft Agar HTS Assay

     A                                      Time of Incubation w/ AlamarBlue Day 7 (5,000 cells)
                                                                                                                                                                           125   A                                                       EC50
                                                                                                                                                                                                                         Staurosporine    4e-009
                                      8.E+06                                                          Z' = 0.5                                                             100                                           Lapatinib
                                                                                                                                                                                                                                          2e-007
             Fluorescent Intensity

                                      7.E+06

                                                                                                                                                            % Inhibition
                                                                                                                                                                           75                                            Tarceva
                                      6.E+06                                                                                                                                                                             Zactima          4e-009
                                                                                      Z' = 0.3                            FU Totals
                                      5.E+06                                                                                                                               50                                             Iressa          5e-009
                                      4.E+06
                                                                 Z' = 0                                                   FU Background
                                                                                                                                                                           25                                             Gleevec         4e-010
                                      3.E+06
                                                                                                                          (detergent)                                       0
                                      2.E+06                                                                                                                                         -9       -8    -7       -6    -5
                                      1.E+06                                                                                                                               -25            [compound], LogM
                                      0.E+00
                                                         0                2                   4            6
                                                                 Hours alamarBlue
                                                                                                                                                                                                                                            EC50
                                                                                                                                                                           125
                                                                                                                                                                                 B                                        Staurosporine    8e-009
                                                                                                                                                                           100                                            Lapatinib
                                            Time of Incubation w/ AlamarBlue Day 10 (5,000 cells)                                                                                                                                          3e-007
        B

                                                                                                                                                            % Inhibition
                                                                                                                                                                                                                          Tarceva
                                                                                                                                                                            75                                                             5e-009
                                                                                                                                                                                                                          Zactima
                                                                                                                                                                            50                                             Iressa          1e-009
                                      1.E+07
                                                                                                      Z' = 0.64                                                             25                                             Gleevec         1e-010
              Fluorescent Intensity

                                      1.E+07
                                                                                          Z' = 0.38                  FU Totals                                               0
                                      8.E+06                                                                                                                                         -9       -8     -7       -6    -5
                                                                                  Z' = 0.2                                                                                 -25
                                      6.E+06                             Z' = 0                                                                                                           [compound], LogM
                                                                                                                     FU Background
                                      4.E+06                                                                         (detergent)
                                                                                                                                                       FIG. 5. Dose response of control compounds in soft agar at 6 and 24 h
                                      2.E+06
                                                                                                                                                       of exposure to alamarBlue. (A) Concentration response of control com-
                                      0.E+00
                                                     0       2                4         6         8       24
                                                                                                                                                       pounds read after 6 h of alamarBlue exposure. (B) Concentration
                                                                 Hours alamarBlue
                                                                                                                                                       response of control compounds read after 24 h of alamarBlue exposure.
                                                                                                                                                       Each compound was tested in duplicate on separate 384-well plates.
FIG. 3. Determination of optimal incubation time with alamarBlue at                                                                                    Error bars represent standard deviation.
(A) day 7 and (B) day 10. Calculation of Z′ based on n = 225 for non-
treated control and 42 wells of detergent-treated wells. Error bars repre-
sent standard deviation. FU, fluorescent units.                                                                                                        against a random collection of 9600 compounds was performed,
                                                                                                                                                       and the results were compared to a standard screen using HCC827
                                                                                                                                                       cells in a monolayer format.
        A                                            Soft Agar vs. DMSO (5,000 cells) Day 7
                                      120                                                                                                              Soft agar screening assay
                                      100
     Percent Inhibition

                                      80                                                                                                                   Approximately 9600 compounds were screened in a 10
                                      60                                                                                                               mixed-drug format with each drug present in the well at a con-
                                      40
                                                                                                                                                       centration of 2 µM. The scatterplot from the soft agar 6-h
                                      20
                                                                                                                                                       alamarBlue time point (Fig. 6A) demonstrated a very high scat-
                                       0
                                      -20       10               5                    3           1.250           0.625        0.300                   ter, whereas the 24-h alamarBlue time point (Fig. 6B) demon-
                                                                     Percent DMSO Concentration                                                        strated a more reasonable scatter, where potential hits could be
                                                                                                                                                       readily separated from the scatter. Therefore, the 24-h time point
                                                                                                                                                       was used to select hits for the primary screen because we previ-
         B                                           Soft Agar vs. DMSO (5,000 cells) Day 10                                                           ously demonstrated no differences in the IC50 of control com-
                                                                                                                                                       pounds at the 2 alamarBlue exposure times. The monolayer assay
                                       120                                                                                                             results shown in Figure 6C demonstrate a similar scatterplot
                                       100
     Percent Inhibition

                                        80                                                                                                             compared to the soft agar results. Assay wells that contained hits
                                        60                                                                                                             were picked as described in Figure 6, and single compounds were
                                        40
                                        20
                                                                                                                                                       retested at a 10-µM concentration, in duplicate. Figure 7 demon-
                                         0                                                                                                             strates the reproducibility of the soft agar HTS assay. As expected,
                                       -20                                                                                                             single compounds tested at 10 µM with potent IC50s demonstrate
                                       -40       10                  5                    3           1.250        0.625        0.300
                                                                                                                                                       the best activity and best correlation.
                                                                         Percent DMSO Concentration
                                                                                                                                                           Compounds demonstrating activity in either the soft agar or
FIG. 4. Determination of soft agar assay sensitivity to DMSO at
                                                                                                                                                       monolayer format, at 10 µM, were tested in a 6-point dose-response
(A) day 7 and (B) day 10 of culture. n = 288 nontreated wells, n = 48                                                                                  assay using a 1:10 dilution scheme. Compounds were obtained
detergent-treated wells, and n = 4 for each DMSO concentration. Error                                                                                  from 5-mM HTS liquid library stocks, and dose responses were
bars represent standard deviation. FU, fluorescent units.                                                                                              started at either 10 or 30 µM. From the 9600-compound soft agar

Journal of Biomolecular Screening 12(7); 2007                                                                                                                                                                             www.sbsonline.org         941
                                                                                                                      Downloaded from jbx.sagepub.com by guest on October 12, 2015
Anderson et al.

      A                        120
                                80
      Percent Inhibition

                                40
                                 0
                                -40
                                -80
                               -120
                                      0       384    768      1152    1536          1920
                                                     Well Location

                               120
      B
                                80
      Percent Inhibition

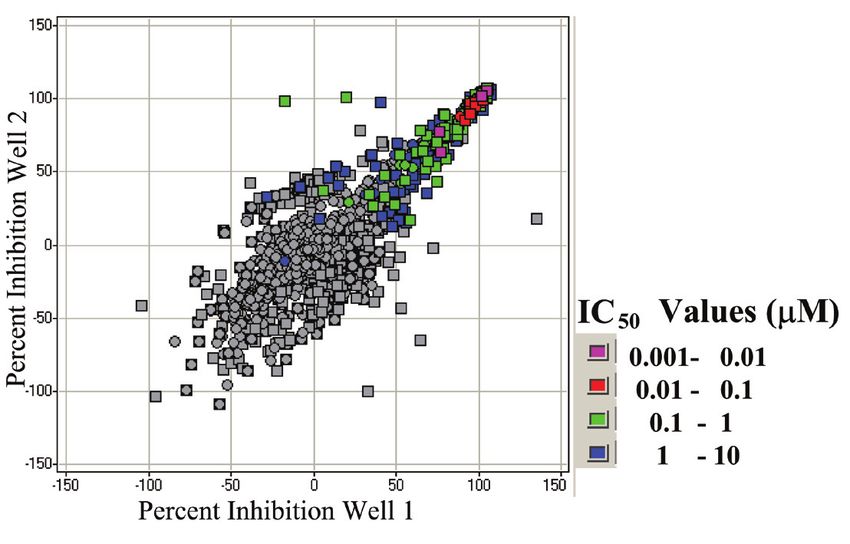
                                40                                                                      FIG. 7. Correlation plot of 10-µM single-point retests on differ-
                                 0                                                                      ent test plates demonstrating reproducibility of the soft agar
                                                                                                        method. The x- and y-axes demonstrate the percent inhibition values
                                -40
                                                                                                        from each plate, whereas the color represents the IC50 values. As
                                -80                                                                     expected, the most potent compounds, in the upper right quadrant,
                               -120
                                      0       384    768      1152    1536          1920                have the best reproducibility.
                                                     Well Location

                                                                                                              Table 1.         Unique Hits from Monolayer Primary Screen
                                120
      C                                                                                                                             Retested from Powders
                                 80
          Percent Inhibition

                                 40                                                                                                    Monolayer             Monolayer                Soft Agar
                                      0
                                                                                                        Compound                      Original IC50          Powder IC50             Powder IC50

                                 -40                                                                     1a                               0.3                    0.5                      5
                                 -80                                                                     2                                0.3                    0.5                      0.5
                               -120                                                                      3                                0.3                    0.4                      0.4
                                          0    384   768       1152   1536          1920
                                                                                                         4                                0.5                    2                        2
                                                                                                         5                                0.5                    0.8                      0.8
                                                     Well Location
                                                                                                         6a                               0.6                    0.8                      8
                                                                                                         7                                0.7                    0.8                      0.5
FIG. 6. Scatterplot of primary soft agar assay at (A) 6 h and (B) 24
                                                                                                         8                                0.7                    0.03                     0.03
h of exposure to alamarBlue. Scatterplot of monolayer assay (C) using
                                                                                                         9                                0.8                    5                       10
CyQUANT endpoint. „, 384-well plate scatter; , 384 wells selected
                                                                                                        10                                0.8                    2                        0.8
for retesting.                                                                                          11                                0.9                    2                        3
                                                                                                        12                                0.9                    2                        2
                                                                                                        13a                               1                      1                        4
screen, 64 compounds with IC50 activities of at least 10 µM                                             14                                1                      3                        2
were discovered. Similarly, 75 compounds were discovered                                                15                                1                      1                        1
                                                                                                        16                                1                     10                       10
with activity of at least 10 µM in the monolayer assay. Although                                        17                                1                  Inactive                 Inactive
there was a high hit rate, the majority of the hits (47 compounds)                                      18                                1                     10                       10
were found in both assay formats. Due to the high hit rate in the                                       19                                1                      6                        6
primary screen mixed-drug format, several compounds were                                                20                                1                      1                        1
identified as active compounds in either the soft agar or mono-                                         21                                1                      0.6                      2
                                                                                                        22                                1                      1                        3
layer format that were not selected as hits in the alternate format.
Therefore, to determine the validity of the soft agar and mono-                                               a. Denotes compound at least 4 times more active in monolayer versus soft agar format.
layer formats, 35 compounds with IC50s of at least 1 µM were
ordered as powders from the Abbott Drug Repository that were
not selected as hits, in either the original soft agar (Table 1) or                                     both formats with few exceptions. Graphs of the compounds
monolayer primary screens (Table 2) and retested as single com-                                         that produced IC50s with greater than a 4-fold difference are pre-
pounds at a 10-µM concentration. As shown in Tables 1 and 2, all                                        sented in Figure 8. Compounds 1, 6, and 13 were more active
of the compounds that were retested produced similar IC50s in                                           in the monolayer format than the soft agar format, whereas

942                 www.sbsonline.org                                                                                                           Journal of Biomolecular Screening 12(7); 2007
                                                                       Downloaded from jbx.sagepub.com by guest on October 12, 2015
384-Well Soft Agar HTS Assay

       Table 2.                     Unique Hits from Soft Agar Primary Screen                             compound 32 was more active in the soft agar format. These
                                         Retested as Powders                                              results confirm the robustness of the soft agar HCC827 cell
                                                                                                          assay, demonstrating similar if not almost equivalent results to an
                                         Soft Agar         Monolayer               Soft Agar
Compound                                Original IC50      Powder IC50            Powder IC50
                                                                                                          established monolayer screening format.

23                                           0.1              10                       10                                                               CONCLUSIONS
24                                           0.2               1                        1
25                                           0.3               1                        2                    The soft agar assay method presented here can be used to
26                                           0.5               4                        4                 screen large numbers of compounds in a simple and robust
27                                           0.5               2                        2                 fashion. The assay had a good signal-to-noise ratio and a posi-
28                                           0.6               1                        2                 tive Z′ factor. The soft agar assay has an advantage over mono-
29                                           0.6               1                        2
                                                                                                          layer techniques measuring cell proliferation because it
30                                           0.7               0.3                      0.9
31                                           0.8               3                        1                 employs cells cultured in a 3-D matrix. Thus, this format
32a                                          1                 8                        2                 should be able to discover compounds that induce anoikis that
33                                           1                10                       10                 would be missed in a monolayer screening assay. Although no
34                                           1                 0.4                      0.4               compounds were discovered in this screening set that induced
35                                           1                 6                        6                 anoikis and possessed significant activity in soft agar versus
      a. Denotes compound at least 4 times more active in soft agar versus monolayer format.              monolayer cultures, compounds inducing anoikis have been

                                                        Compound 1                                                                                          Compound 6
                                  125         Soft Agar IC50 = 10 µM                                                          125                     Soft Agar IC50 = 0.7
                                              Monolayer IC50 = 0.5 µM                                                                                 Monolayer IC50 = 0.1
                                  100                                                                                         100
         Percent Inhibition

                                                                                                               Percent Inhibition

                                  75                                                                                                    75

                                  50                                                                                                    50

                                  25                                                                                                    25

                                   0                                                                                                    0

                                  -25                                                                                               -25
                                                   -1             0                         1                                                          -1             0                   1
                                            Compound Concentration (M)
                                                                                                                                                   Compound Concentration (log µM)

                                                        Compound 13                                                                                         Compound 32
                                  125         Soft Agar IC50 = 10 µM                                                                         125      Soft Agar IC50 = 3 µM
                                  100         Monolayer IC50 = 1.4 µM                                                                                 Monolayer IC50 = 11 µM
             Percent Inhibition

                                                                                                                                             100
                                                                                                                   Percent Inhibition

                                   75                                                                                                        75

                                   50                                                                                                        50

                                   25                                                                                                        25

                                    0                                                                                                         0

                                  -25                                                                                                        -25
                                                   -1                0                       1                                                         -1              0                  1
                                             Compound Concentration (M)                                                                              Compound Concentration (M)

FIG. 8. IC50 determinations of 4 compounds demonstrating differences between monolayer and soft agar results. Each compound was tested in
duplicate on separate 384-well plates. Error bars represent standard deviation.

Journal of Biomolecular Screening 12(7); 2007                                                                                                                              www.sbsonline.org   943
                                                                         Downloaded from jbx.sagepub.com by guest on October 12, 2015
Anderson et al.

previously discovered with up to 30- to 40-fold differences                                16.    Pauli BU, Anderson SN, Mernoli VA, Kuettner KA: Development in an in
reported in soft agar versus monolayer IC50s.35,36 The HTS soft                                   vitro and in vivo epithelial tumor model for the study of invasion. Cancer Res
agar assay described here should prove to be a valuable tool in                                   1980;40:4571-4580.
                                                                                           17.    Kirkels WJ, Pelgrim OE, Hoogenboom AMM, Aalders MW, Debruyne
screening for novel compounds and can be used to rank order
                                                                                                  FMJ, Vouus GP, et al: Patterns of tumor colony development over time in
compounds moving into animal models. We are currently
                                                                                                  soft agar. Int J Cancer 1983;32:399-406.
expanding the number of different cell lines that can be used in                           18.    Akiyoshi T, Wada T, Nakamura Y, Tsuji H: A simplified method for deter-
this soft agar method, optimizing each cell line with respect to                                  mination of tritiated thymidine incorporation into cells from tissue in soft
seeding density and length of alamarBlue incubation, and hope                                     agar culture. Jpn J Surg 1986;16:235-238.
to report our results in future communications.                                            19.    Pole D, Bowen W: Determination of cell colony formation in a high con-
                                                                                                  tent screening assay [Poster 10144]. Poster presented at 10th Annual SBS
                            REFERENCES                                                            Conference and Exhibition, Orlando, FL, 2004.
                                                                                           20.    Alley MC, Scudiero DA, Monks A, Hursey ML, Czerwinski MJ, Fine DL,
 1. Hamburger AW, Salmon SE: Primary bioassay of human tumor stem                                 et al: Feasibility of drug screening with panels of human tumor cell lines
    cells. Science 1977;197:461-463.                                                              using a microculture tetrazolium assay. Cancer Res 1988;48:589-601.
 2. Hamburger AW: The human tumor clonogenic assay as a model system                       21.    Alley MC, Uhl CB, Lieber MM: Improved detection of drug cytotoxicity
    in cell biology. Int J Cell Cloning 1987;5:89-107.                                            in the soft agar colony formation assay through use of a metabolizable
 3 Weaver V, Lelièvre S, Lakins J, Chrenek M, Jones J, Giancotti F, et al: β4                     tetrazolium salt. Life Sci 1982;31:3071.
    integrin-dependent formation of polarized three-dimensional architecture               22.    Ke N, Albers A, Claassen G, Yu DH, Chatterton JE, Hu X, et al: One-
    confers resistance to apoptosis in normal and malignant mammary epithe-                       week 96-well soft agar growth for cancer target validation. BioTechniques
    lium. Cancer Cell 2002;2:205-216.                                                             2004;36:826-833.
 4. Bhadriraju K, Chen CS: Engineering cellular microenvironments to                       23.    Amann J, Kalyankrishna S, Massion PP, Ohm JE, Girard L, Shigematsu H,
    improve cell-based drug testing. DDT 2002;7:612-620.                                          et al: Aberrant epidermal growth factor receptor signaling and enhanced
 5. Discher DE, Janmey P, Wang Y-L: Tissue cells feel and respond to the                          sensitivity to EGFR inhibitors in lung cancer. Cancer Res 2005;65:226-235.
    stiffness of their substrate. Science 2005;310:1139-1143.                              24.    Shimamura T, Ji H, Minami Y, Thomas RK, Lowell AM, Shah K, et al.
 6. Abbott A: Cell culture: Biology’s new dimension. Nature 2003;424:870-872.                     Non-small-cell lungcancer and Ba/F3 transformed cells harboring the
 7. Fukazawa H, Uehara Y: U0126 reverses Ki-ras-mediated transformation                           ERBB2 G776insV_G/C mutation are sensitive to the dual-specific epi-
    by blocking both mitogen-activated protein kinase and p70 S6 kinase                           dermal growth factor receptor and ERBB2 inhibitor HKI-272. Cancer
    pathways. Cancer Res 2000;60:2104-2107.                                                       Res 2006;66:6487-6491.
 8. Fukazawa H, Noguchi K, Murakami Y, Uehara Y: Mitogen-activated pro-                    25.    Xia W, Mullin RJ, Keith BR, Liu LH, Ma H, Rusnak DW, et al: Anti-
    tein/extracellular signal-regulated kinase kinase (MEK) inhibitors restore                    tumor activity of GW572016: a dual tyrosine kinase inhibitor blocks EGF
    anoikis sensitivity in human breast cancer cell lines with a constitutively                   activation of EGFR/erbB2 and downstream Erk1/2 and AKT pathways.
    activated extracellular-regulated kinase (ERK) pathway. Mol Cancer                            Oncogene 2002;21:6255-6263.
    Ther 2002;1:303-309.                                                                   26.    Holtz MS, Slovak ML, Zhang F, Sawyers CL, Forman SJ, Bhatia R, et al:
 9. Fukazawa H, Noguchi K, Masumi A, Murakami Y, Uehara Y: BimEL is                               Imatinib mesylate (STI571) inhibits growth of primitive malignant prog-
    an important determinant for induction of anoikis sensitivity by mitogen-                     enitors in chronic myelogenous leukemia through reversal of abnormally
    activated protein/extracellular signal-regulated kinase kinase inhibitors.                    increased proliferation. Blood 2002;99:3792–3800.
    Mol Cancer Ther 2004;3:1281-1288.                                                      27.    Bianco C, Tortora G, Bianco R, Caputo R, Veneziani BM, Caputo R,
10. Frisch SM, Screaton RA: Anoikis mechanisms. Curr Opin Cell Biol                               et al: Enhancement of antitumor activity of ionizing radiation by combined
    2001;13:555-562.                                                                              treatment with the selective epidermal growth factor receptor-tyrosine
11. Fukazawa H, Mizuno S, Uehara Y: A microplate assay for quantitation of                        kinase inhibitor ZD1839 (Iressa). Clin Cancer Res 2002;8:3250-3258.
    anchorage-independent growth of transformed cells. Anal Biochem 1995;                  28.    Amador ML, Oppenheimer D, Perea S, Maitra A, Cusati G, Iacobuzio-
    228:83-90.                                                                                    Donahue C, et al: An epidermal growth factor receptor intron 1 polymor-
12. Fukazawa H, Nakano S, Mizuno S, Uehara Y: Inhibitors of anchorage-                            phism mediates response to epidermal growth factor receptor inhibitors.
    independent growth affect the growth of transformed cells on poly(2-                          Cancer Res 2004;64:9139-9143.
    hydroxyethyl methacrylate)-coated surfaces. Int J Cancer 1996;67:876-882.              29.    Ciardiello F, Caputo R, Bianco R, Damiano V, Pomatico G, De Placido S,
13. Kuppumbatti YS, Bleiweiss IJ, Mandeli JP, Waxman S, Mira-y-Lopez R:                           et al: Antitumor effect and potentiation of cytotoxic drugs activity in human
    CRBP suppresses breast cancer cell survival and anchorage-independent                         cancer cells by ZD-1839 (Iressa), an epidermal growth factor receptor–
    growth. J Natl Cancer Inst 2000;92:475-480.                                                   selective tyrosine kinase inhibitor. Clin Cancer Res 2000;6:2053-2063.
14. Bretland AJ, Lawry J, Sharrard RM: A study of death by anoikis in cul-                 30.    Ono M, Hirata A, Kometani T, Miyagawa M, Ueda S, Kinoshita H, et al:
    tured epithelial cells. Cell Proliferation 2001;34:379-382.                                   Sensitivity to gefitinib (Iressa, ZD1839) in non-small cell lung cancer cell
15. Zagon IS, McLaughlin PJ: Opioid growth factor (OGF) inhibits anchor-                          lines correlates with dependence on the epidermal growth factor (EGF)
    age independent growth in human cancer cells. Int J Oncol 2004;24:                            receptor/extracellular signal-regulated kinase 1/2 and EGF receptor/Akt
    1443-1448.                                                                                    pathway for proliferation. Mol Cancer Ther 2004;3:465-472.

944   www.sbsonline.org                                                                                                   Journal of Biomolecular Screening 12(7); 2007
                                                          Downloaded from jbx.sagepub.com by guest on October 12, 2015
384-Well Soft Agar HTS Assay

31. Qian X, LaRochelle WJ, Ara G, Wu F, Petersen KD, Thougaard A, et al.                    36.    Sheets MP, Warrior UP, Yoon H, Mollison KW, Djuric SW, Trevillyan JM,
    Activity of PXD101, a histone deacetylase inhibitor, in preclinical ovar-                      et al: A high-capacity scintillation proximity assay for the discovery and
    ian cancer studies. Mol Cancer Therapeutics 2006;5:2086-2095.                                  evaluation of ZAP-70 tandem SH2 domain antagonists. J Biomol Screen
32. Coldren CD, Helfrich BA, Witta SE, Sugita M, Lapadat R, Zeng C, et al:                         1998;3:139-144.
    Baseline gene expression predicts sensitivity to gefitinib in non–small cell
    lung cancer cell lines. Mol Cancer Res 2006;4:521-528.
33. Senderowicz AM: Development of cyclin-dependent kinase modulators
    as novel therapeutic approaches for hematological malignancies. Leukemia                                                               Address correspondence to:
    2001;15:1-9.                                                                                                                                        Usha Warrior
34. Feldman RI, Wu JM, Polokoff MA, Kochanny MJ, Dinter H, Zhu D,                                                                                 Abbott Laboratories
    et al: Novel small molecule inhibitors of 3-phosphoinositide-dependent                                                             Department R4PN, Building J35
    kinase-1. J Biol Chem 2005;280:19867-19874.                                                                                                200 Abbott Park Road
35. Golas JM, Lucas J, Etienne C, Golas J, Discafani C, Sridharan L, et al: SKI-                                                          Abbott Park, IL 60064-6181
    606, a Src/Abl inhibitor with in vivo activity in colon tumor xenograft mod-
    els. Cancer Res 2005;65:5358-5364.                                                                                               E-mail: usha.warrior@abbott.com

Journal of Biomolecular Screening 12(7); 2007                                                                                                     www.sbsonline.org      945
                                                           Downloaded from jbx.sagepub.com by guest on October 12, 2015
You can also read