Myeloid-derived suppressor cell (MDSC) key genes analysis in rat anti-CD28-induced immune tolerance kidney transplantation
←
→
Page content transcription
If your browser does not render page correctly, please read the page content below
Original Article

Myeloid-derived suppressor cell (MDSC) key genes analysis in rat
anti-CD28-induced immune tolerance kidney transplantation
Tianying Yang1,2#, Jiawei Li1,2#, Yichen Jia1,2#, Chunchen Yang3, Ruirui Sang3, Tongyu Zhu1,2, Ming Xu1,2,
Ruiming Rong1,2,3, Cheng Yang1,2,4
1
Department of Urology, Zhongshan Hospital, Fudan University, Shanghai, China; 2Shanghai Key Laboratory of Organ Transplantation, Shanghai,
China; 3Department of Transfusion, Zhongshan Hospital, Fudan University, Shanghai, China; 4Fudan Zhangjiang Institute, Shanghai, China
Contributions: (I) Conception and design: R Rong, C Yang, T Yang, J Li; (II) Administrative support: M Xu, T Zhu; (III) Provision of study materials
or patients: Y Jia, R Sang; (IV) Collection and assembly of data: T Yang, J Li, Y Jia; (V) Data analysis and interpretation: T Yang, J Li, Y Jia; (VI)
Manuscript writing: All authors; (VII) Final approval of manuscript: All authors.
#
These authors contributed equally to this work.
Correspondence to: Prof. Cheng Yang. Department of Urology, Zhongshan Hospital, Fudan University; Shanghai Key Laboratory of Organ
Transplantation, 180 Fenglin Road, Shanghai 200032, China. Email: esuperyc@163.com; yang.cheng1@zs-hospital.sh.cn.

                 Background: In the field of transplantation, inducing immune tolerance in recipients is of great
                 importance. Blocking co-stimulatory molecule using anti-CD28 antibody could induce tolerance in a rat
                 kidney transplantation model. Myeloid-derived suppressor cells (MDSCs) reveals strong immune suppressive
                 abilities in kidney transplantation. Here we analyzed key genes of MDSCs leading to transplant tolerance in
                 this model.
                 Methods: Microarray data of rat gene expression profiles under accession number GSE28545 in the
                 Gene Expression Omnibus (GEO) database were analyzed. Running the LIMMA package in R language,
                 the differentially expressed genes (DEGs) were found. Enrichment analysis of the DEGs was conducted in
                 the Database for Annotation, Visualization and Integrated Discovery (DAVID) database to explore gene
                 ontology (GO) annotation and their Kyoto Encyclopedia of Genes and Genomes (KEGG) pathways. Their
                 protein-protein interactions (PPIs) were provided by STRING database and was visualized in Cytoscape.
                 Hub genes were carried out by CytoHubba.
                 Results: Three hundred and thirty-eight DEGs were exported, including 27 upregulated and 311
                 downregulated genes. The functions and KEGG pathways of the DEGs were assessed and the PPI network
                 was constructed based on the string interactions of the DEGs. The network was visualized in Cytoscape; the
                 entire PPI network consisted of 192 nodes and 469 edges. Zap70, Cdc42, Stat1, Stat4, Ccl5 and Cxcr3 were
                 among the hub genes.
                 Conclusions: These key genes, corresponding proteins and their functions may provide valuable
                 background for both basic and clinical research and could be the direction of future studies in immune
                 tolerance, especially those examining immunocyte-induced tolerance.

                 Keywords: Transplant tolerance; differentially expressed genes (DEGs); bioinformatics analysis; gene ontology
                 (GO); protein-protein network

                 Submitted May 23, 2020. Accepted for publication Oct 28, 2020.
                 doi: 10.21037/tau-20-943
                 View this article at: http://dx.doi.org/10.21037/tau-20-943

© Translational Andrology and Urology. All rights reserved.                Transl Androl Urol 2021;10(1):204-214 | http://dx.doi.org/10.21037/tau-20-943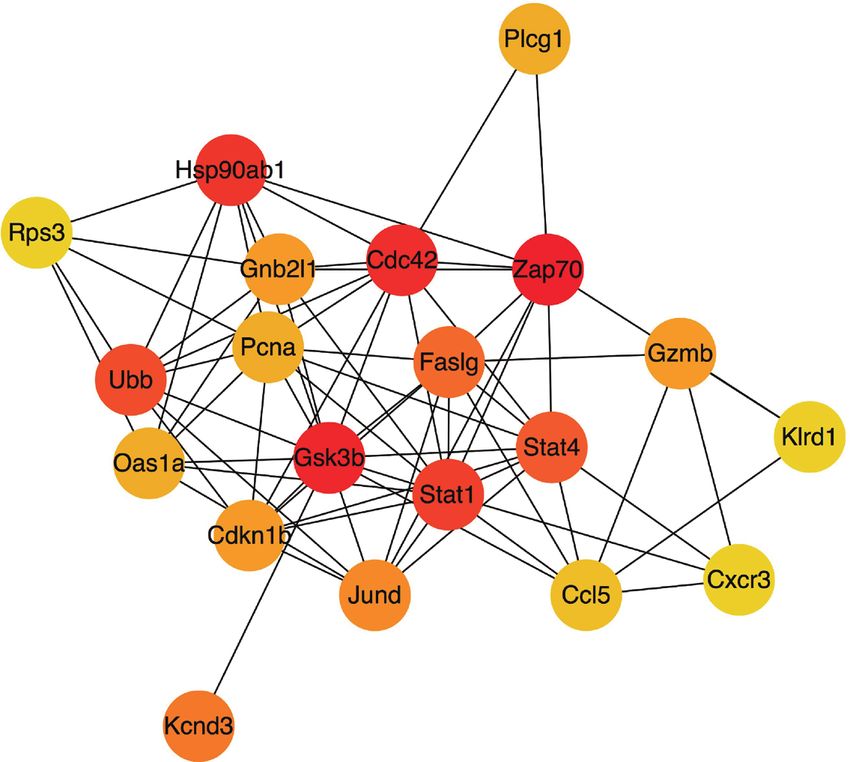
Translational Andrology and Urology, Vol 10, No 1 January 2021                                                                            205

Introduction                                                        identified based on use of the Linear Models for Microarray
                                                                    Data (LIMMA) package in the R environment. Gene
Immunological tolerance is the state in which the immune
                                                                    ontology (GO) and Kyoto Encyclopedia of Genes and
system shows unresponsiveness towards specific antigens
                                                                    Genomes (KEGG) pathways were analyzed in the Database
like allografts while normally responding to other
                                                                    for Annotation, Visualization and Integrated Discovery
harmful foreign antigens (1,2). In kidney transplantation,
                                                                    (DAVID). A protein-protein interaction (PPI) network was
the high rejection rate as well as many morbidities like
                                                                    built in the STRING database and visualized in Cytoscape.
nephrotoxicity are critical (3,4). Because of the rare
                                                                    Utilizing these bioinformatic tools, the gene expression
appearance of spontaneous tolerance in normal cases (5),
                                                                    profiles of tolerant and syngenic samples after kidney
the ability to induce immune tolerance in transplant
                                                                    transplantation could be better visualized.
recipients would be of great significance. Current methods
                                                                       We present the following article in accordance with
for inducing kidney transplantation immune tolerance
                                                                    the MDAR reporting checklist (available at http://dx.doi.
are bone marrow transplantation (6), using regulatory
                                                                    org/10.21037/tau-20-943).
immune cells including myeloid-derived suppressor cells
(MDSCs) (7), regulatory T cells (Tregs) (8), regulatory B
cells (9) and mesenchymal stem cell (MSC) infusion (10).            Methods
   MDSCs are heterogeneous progenitor and immature
myeloid cells (11). They play a significant role in immune          Microarray data
tolerance by virtue of multiple strong cell-cell interactions       From the Gene Expression Omnibus (GEO) database
with T cells. MDSCs can secrete reactive oxygen species             (https://www.ncbi.nlm.nih.gov/geo/), we extracted
and nitric oxide to suppress T cell responses (12) and              microarray data from accession number GSE28545
disrupt cell binding by nitration of tyrosine (13). Recent          (species: Rattus norvegicus; platform: GPL2996; samples:
reports from Vanhove showed that MDSCs in rat kidney                GSM706861–GSM706865) (15), which compared the levels
transplant recipients treated with anti-CD28 could induce           of blood MDSCs from three tolerant allogeneic kidney
immune tolerance (14,15).                                           transplant recipients with two syngenic kidney transplant
   In transplant tolerance, Tregs are thought to play a             recipients at 100 days post-transplantation, which is the only
leading role (8) and MDSCs can regulate and interact                dataset in GEO database focusing on the following issue
with Tregs in direct and indirect ways by building a graft-         with great data integrity. To verify the feasibility for cross-
to-periphery gradient to recruit Tregs and maintain                 comparison, we used the value distribution of the GEO2R
tolerance (15). MDSCs also have the remarkable ability              tool (17) (https://www.ncbi.nlm.nih.gov/geo/geo2r/) in the
to regulate the differentiation of Tregs through cell-              GEO database. All procedures performed in this study were
cell contacts and the production of cytokines (11,14).              in accordance with the Declaration of Helsinki (as revised
Finally, MDSCs cooperate with Tregs to prolong allograft            in 2013).
survival (16). These studies suggest that cell therapies based
on MDSCs may become an important research direction
                                                                    Data processing and identification of DEGs
for the induction of transplant tolerance.
   Microarrays are a widely used high-throughput tool               To determine DEGs in tolerant and syngenic kidney
which can generate gene expression profiles, and further            transplant recipients, the affy and LIMMA packages in
analysis of microarray data may reveal the etiology of              Bioconductor were used in the R language environment (2),
phenotypic differences. A previous study published a gene           which also helped us in statistical analysis. Comparisons
expression profile comparing blood MDSCs in syngenic and            between expression values were carried out in R language by
tolerant rat kidney transplant recipients (15). In this study,      Bayes tests. T-tests were applied to the original expression
we performed further analysis of this microarray data to            data, and DEGs were selected based on a threshold
better understand the factors affecting transplant tolerance.       corresponding adjusted P value 1.5. The gplots package in Bioconductor was used to
public gene expression profiles, differentially expressed           display the heatmap of the DEGs using different colors to
genes (DEGs) in the tolerant and syngenic samples were              visualize the regulated DEGs.

© Translational Andrology and Urology. All rights reserved.      Transl Androl Urol 2021;10(1):204-214 | http://dx.doi.org/10.21037/tau-20-943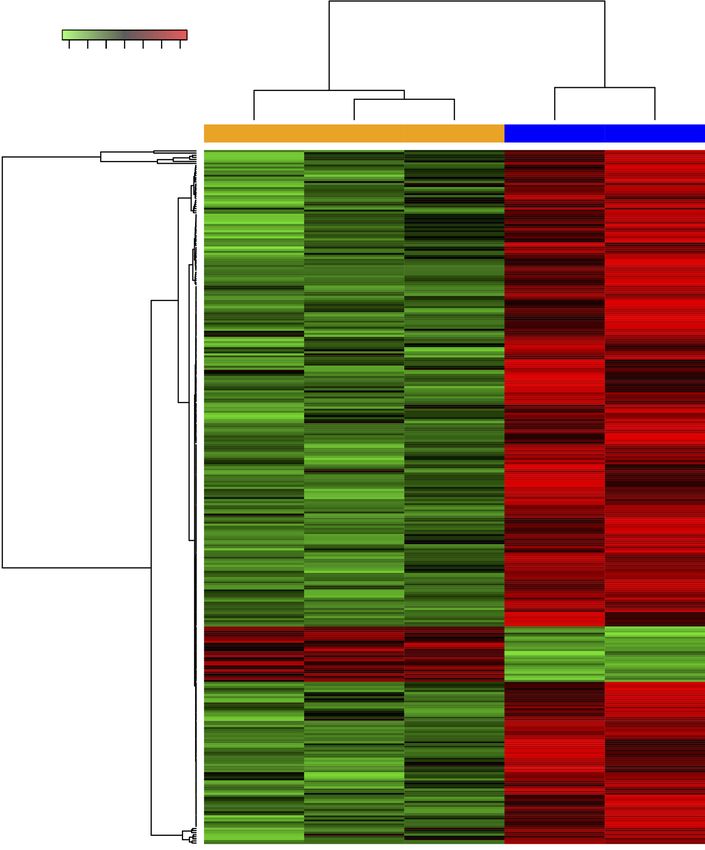
206                                                                     Yang et al. MDSC key genes analysis in transplant tolerance

Enrichment analysis of DEGs                                         transplant recipients compared to syngenic samples. The
                                                                    heatmap of the DEGs is shown in Figure 2.
Enrichment analysis of the DEGs was conducted in the
DAVID database (https://david.ncifcrf.gov/) (18) using GO
and KEGG pathway analysis (19). In GO, biological process           Enrichment analysis for the DEGs
(BP), cellular components (CC) and molecular function
                                                                    From the GO analysis in the DAVID database, the top six
(MF) of the DEGs were analyzed using a threshold P value
                                                                    GO terms in BP, CC and MF are displayed in Figure 3. In
10, while the threshold for KEGG
                                                                    the BP ontology, we found that response-related items were
pathways was P5.
                                                                    the most significant GO categories, including response to
                                                                    organic cyclic compound (17 genes) and response to drug
PPI network construction                                            (22 genes). In addition, positive regulation of transcription
                                                                    was also among the top categories, including DNA-
By inputting the gene symbols of all DEGs into the
                                                                    templated positive regulation of transcription (19 genes)
STRING database (https://string-db.org/) (20), the
                                                                    and positive regulation of transcription from the RNA
interactions between proteins were predicted, with Rattus
                                                                    polymerase II promoter (26 genes). Inflammatory response
norvegicus as the chosen species and the medium confidence
                                                                    (12 genes) and immune response (11 genes) were also
score set at 0.4. After exporting the string interactions, the
                                                                    enriched.
network was visualized using Cytoscape software (http://
                                                                       In the CC ontology, most genes were associated with
www.cytoscape.org/) (21).
                                                                    the plasma membrane (98 genes). Neurons were also
                                                                    closely related to the DEGs, with the most prominent
Hub gene analysis                                                   enriched categories including neuronal cell body (29 genes),
                                                                    dendrite (24 genes), neuron projection (19 genes) and axon
CytoHubba (http://apps.cytoscape.org/apps/cytohubba)
                                                                    (18 genes).
was used to determine the hub genes in the entire PPI
                                                                       In the MF ontology, binding-related items made up
network (22). CytoHubba provides 12 algorithms to
                                                                    the majority of the categories, with protein binding (56
determine the significance of the nodes. After calculating
                                                                    genes) as most enriched, followed by calcium ion binding
the node scores in different algorithms, the hubba nodes
                                                                    (18 genes), protein complex binding (11 genes) and enzyme
indicating hub genes were selected.
                                                                    binding (11 genes). In addition, other enriched categories
                                                                    in MF were related to protein activity: for instance,
Statistical analysis                                                protein homodimerization activity (19 genes) and protein
                                                                    heterodimerization activity (14 genes).
According to the results calculated as above, DEGs whose
                                                                       Furthermore, through KEGG pathway analysis, we
P value 1.5 were selected.
                                                                    found that neuroactive ligand-receptor interaction category
Statistical analyses were performed with R language. A
                                                                    (15 genes) was most closely related to the DEGs, verifying
t-test was used to compare tolerant and syngeneic samples.
                                                                    the results of the CC ontology. Ras signaling pathway
Two-tailed statistical tests with P≤0.05 were considered as
                                                                    (12 genes) was the primary term, followed by immune-
statistically significant.
                                                                    related pathways including natural killer cell mediated
                                                                    cytotoxicity (7 genes) and T cell receptor signaling pathway
Results                                                             (7 genes). The genes included in the KEGG pathways are
                                                                    shown in Table 1.
Identification of DEGs

Given that the distribution of value data was at the
                                                                    PPI network construction
same level, the feasibility for cross-comparison could
be ensured (Figure 1). Based on the expression values in            The string interactions among the DEGs were exported
dataset GSE28545, 338 DEGs were obtained. Among the                 from STRING and imported into Cytoscape. The entire
DEGs, 27 genes were upregulated and 311 genes were                  PPI network consisted of 192 nodes and 469 edges and is
downregulated in samples from tolerant allogeneic kidney            shown in Figure 4, in which upregulated genes are colored

© Translational Andrology and Urology. All rights reserved.      Transl Androl Urol 2021;10(1):204-214 | http://dx.doi.org/10.21037/tau-20-943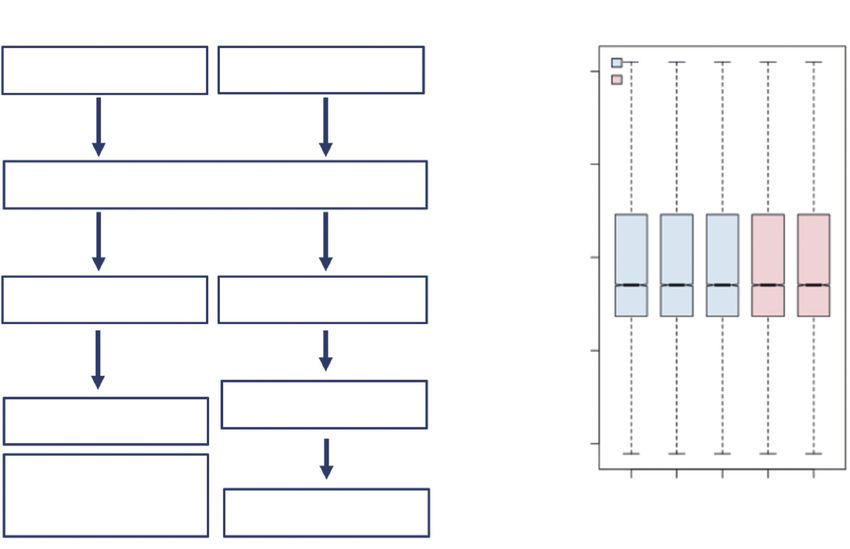
Translational Andrology and Urology, Vol 10, No 1 January 2021                                                                                                          207

          A                                                                                    B
                               Extracted from GSE28545                                                    GSE28545/GPL2996, selected sample

                                                                                                                   A
                      Tolerant                             Syngenic                                14
                                                                                                                   B

                                  Cross comparison

                                                                                                   12
                               Differentially expressed genes

                                         Analysis
                                                                                                   10

                       DAVID                               STRING

                                                                                                     8

                                                          PPI network
                   Gene ontology
                                                                                                     6
                                                                 Visualize
                       KEGG

                                                                                                            GSM706861

                                                                                                                        GSM706862

                                                                                                                                    GSM706863

                                                                                                                                                GSM706864

                                                                                                                                                            GSM706865
                      pathway
                                                           Cytoscape

Figure 1 The general design of the analysis. (A) Flowchart and major procedures for the bioinformatics analysis of GSE28545; (B) the value
distribution of each sample. The blue values are from the tolerant samples (GSM706861–GSM706863) and the red values are from syngenic
samples (GSM706864 and GSM706865); cross-comparisons can be performed when these values are at the same level. DAVID, Database for
Annotation, Visualization and Integrated Discovery; PPI, protein-protein interaction; KEGG, Kyoto Encyclopedia of Genes and Genomes.

red. Meanwhile, the sizes of the nodes were continuously                        Discussion
mapped, with nodes of smaller P values having a rather
                                                                                Anti-CD28 therapy has been presented as an effective
large size.
                                                                                immune regulatory strategy by preventing T cell co-
                                                                                stimulation while favoring co-inhibition, since inhibitory
Hub gene analysis                                                               signals transmitted through CTLA-4, PD-L1 and B7
                                                                                would not be affected (23). Preventing CD28 access to its
In cytoHubba, we selected the top 15 hub genes ranked by                        ligands with the CD80/86 antagonists abatacept (Orencia1;
degree of connectivity. The degrees of connectivity for the                     Bristol-Myers Squibb, New York, NY, USA) and belatacept
hub genes are listed in Table 2. Frequently studied genes like                  (Nulogix1; Bristol-Myers Squibb) has demonstrated
Zap70, Cdc42, Stat1, Stat4, Ccl5 and Cxcr3 are in this list and                 immunosuppressive efficacy in the clinic (24). The most
are also among the most frequent genes determined by other                      ideal clinical application for MDSC therapy is tolerance
algorithms. Precisely calculated by cytoscape, these genes                      induction. MDSCs play an important role in anti-graft
have the strongest interactions with each other (Figure 5)                      rejection and immune tolerance induction. The therapeutic
and the other DEGs, and formed the key cluster of the                           value of MDSCs has been recognized in patients with
whole PPI interaction, so we predict they will play key roles                   cancer, inflammation and autoimmune disease (7).
in immune tolerance in the case.                                                   In this study, we identified DEGs in MDSCs comparing

© Translational Andrology and Urology. All rights reserved.                  Transl Androl Urol 2021;10(1):204-214 | http://dx.doi.org/10.21037/tau-20-943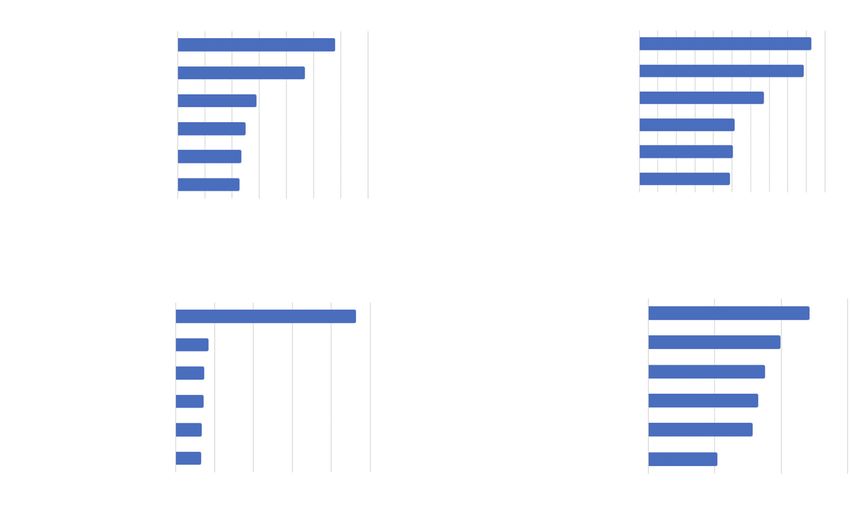
208                                                                         Yang et al. MDSC key genes analysis in transplant tolerance

                           Color key

                  −1.5          0      1

                          Row Z-score

                                                      Tolerant   Tolerant           Tolerant            Syngenic            Syngenic

Figure 2 Heatmap of the differentially expressed genes (DEGs). The left three columns represent the tolerant samples and the two right
columns show the syngenic samples. Each row represents one single DEG. Red and green colors represent high and low expression,
respectively. The brighter color indicates greater variation.

© Translational Andrology and Urology. All rights reserved.          Transl Androl Urol 2021;10(1):204-214 | http://dx.doi.org/10.21037/tau-20-943
Translational Andrology and Urology, Vol 10, No 1 January 2021 209
A Biological process B Cellular components
Response to organic cyclic compound Plasma membrane
Response to drug Neuronal cell body
Positive regulation of Dendrite
transcription, DNA-templated
Inflammatory response Neuron projection
Immune response Axon
Positive regulation of transcription Integral component of plasma membrane
from RNA polymerase II promoter
0 1 2 3 4 5 6 7 0 1 2 3 4 5 6 7 8 9 10
−log10 (P value) −log10 (P value)
C Molecular function D KEGG pathway
Protein binding Neuroactive ligand-receptor interaction
Calcium ion binding Ras signaling pathway
Protein complex binding Natural killer cell mediated cytotoxicity
Protein homodimerization activity Pathways in cancer
Enzyme binding T cell receptor signaling pathway
Protein heterodimerization activity Hematopoietic cell lineage
0 2 4 6 8 10 0 1 2 3
−log10 (P value) −log10 (P value)
Figure 3 The top five Gene Ontology (GO) functions for the DEGs, including biological process (A), cellular component (B), molecular
function (C) and KEGG pathway (D). The horizontal ordinate is −log10 (P value), so the smaller P values are larger along the abscissa.
DEGs, differentially expressed genes; KEGG, Kyoto Encyclopedia of Genes and Genomes.
Table 1 The detailed KEGG pathway for the DEGs
Term Count P value Genes
Neuroactive ligand-receptor interaction 15 0.004 HCRTR2, CRHR1, F2RL2, SSTR5, GABRG2, GALR1, GZMA, GLRA3,
TBXA2R, CHRND, GRIN3B, ADRA2C, TAAR5, CHRNA3, CHRNA2
Ras signaling pathway 12 0.011 GNG8, LAT, CDC42, PLCG1, GAB2, ETS1, FGF9, FGF14, ZAP70,
FGF23, RIN1, FGF10
Natural killer cell mediated cytotoxicity 7 0.019 LAT, PLCG1, ZAP70, GZMB, FCGR3A, KLRD1, HCST
Pathways in cancer 16 0.024 RET, FGF14, FGF9, FGF23, FGF10, FADD, STAT1, FZD4, BIRC2,
GNG8, CDC42, LAMB2, CDKN1B, PLCG1, GSK3B, AXIN2
T cell receptor signaling pathway 7 0.028 LAT, CDC42, PLCG1, CD3D, CD8B, GSK3B, ZAP70
tolerant and non-tolerant recipients of rat kidney induced immune tolerance.
transplants. We then analyzed their functions by GO Through GO annotation in the DAVID database, we
annotation and KEGG pathway enrichment. Finally, the analyzed the biological function of the DEGs. First, in
interrelationships among them were investigated using PPI the CC ontology, we found that the majority of the DEGs
network construction. As a result, hub genes were identified were enriched in cell membrane-related items, while other
which may play important roles in MDSC function and DEGs were enriched in non-membrane-related items such
could be potential targets for therapy involving MDSC- as extracellular matrix and actin cytoskeleton. The results
© Translational Andrology and Urology. All rights reserved. Transl Androl Urol 2021;10(1):204-214 | http://dx.doi.org/10.21037/tau-20-943210 Yang et al. MDSC key genes analysis in transplant tolerance Figure 4 The protein-protein interaction (PPI) network, showing the string interactions between the DEGs. The upregulated genes are colored red while the downregulated genes are blue. DEGs, differentially expressed genes reflect that tolerance likely occurs through complex cellular significant enrichment in the DEGs, followed by calcium molecular mechanisms involving both membrane and non- ion binding, protein complex binding and enzyme binding. membrane structure. Thus, in the BP GO category, our KEGG pathway analysis can reveal more precise data showed that the most significant items were stimulus- biological functions of genes than GO analysis. In the related terms such as extra-cellular response. Other present study, three pathways were enriched, including enriched categories in BP included items associated with cytokine-cytokine receptor interaction and pathways in response to organ cyclic compound, response to drug, immune tolerance which may participate in neuroactive positive regulation of transcription and immune responses. ligand-receptor interaction, Ras signaling pathway, natural In the CC ontology, DEGs showed associations with plasma killer cell mediated cytotoxicity and pathways in cancer. membrane, neuronal cell body, dendrite, neuron projection Some of these pathways have already been documented and axon. In the MF ontology, protein binding showed a in recent studies; for example, Ras signaling plays an © Translational Andrology and Urology. All rights reserved. Transl Androl Urol 2021;10(1):204-214 | http://dx.doi.org/10.21037/tau-20-943
Translational Andrology and Urology, Vol 10, No 1 January 2021                                                                               211

 Table 2 The enriched hub genes calculated by degree                   needed. In addition, evidence indicates that some DEGs
 Gene                            Degree                   P value      may contribute to the induction of immune tolerance by
 Zap70                              29                   0.019
                                                                       anti-CD28. By binding of tSH2 domain and the doubly-
                                                                       phosphorylated ITAM motifs of CD3 chains, ZAP70 is
 Cdc42*                             25                   0.010
                                                                       recruited in the T-cell receptor (TCR) complex (26), and
 Stat1                              20                   0.032         contributed to T cell-mediated immunological diseases (27).
 Ubb*                               19                   0.038         The frequency of ZAP70 cells was significantly correlated
                                                                       with monocytic MDSCs (M-MDSCs) level (28). GzmB
 Stat4                              18                   0.041
                                                                       expression was found in both mice and human MDSC,
 Kcnd3*                             15                   0.013
                                                                       B16F10 melanoma cells decreased in invasive potential
 Jund*                              14                   0.045         co-cultured with perforin/GzmB −/− MDSCs (29). STAT4
 Cdkn1b*                            13                   0.017         are major hubs regulating MDSC-derived macrophages
                                                                       in anti-tumor process (30). Another study focusing
 Gzmb                               13                   0.001
                                                                       on in head and neck squamous cell carcinoma showed
 Plcg1*                             12                   0.031         STAT1 inhibits MDSC accumulation in T cell-mediated
 Pcna                               12                   0.015         antitumor immune responses (31). For example, CCL5
 Ccl5                               11                   7.11E-06      was shown to contribute to MDSC immunosuppression by
                                                                       establishing a graft-to-periphery CCL5 gradient in tolerant
 Rps3*                              10                   0.042
                                                                       kidney allograft recipients which controlled recruitment
 Cxcr3                              10                   0.032         of Tregs to the graft, where they likely participated in
 Klrd1*                             10                   0.003         maintaining tolerance (15). Another study suggested that
 *, genes were never reported in the research of MDSC, while           administration of resveratrol into IL-10−/− mice induced
 those of normal font have reports showing connectivity with           immunosuppressive CD11b+/Gr-1+ MDSCs in the colon,
 MDSC.                                                                 which correlated with reversal of established chronic colitis
                                                                       and downregulation of mucosal and systemic CXCR3+-
                                                                       expressing effector T cells as well as inflammatory cytokines
important role during myeloid development. Studies have                in the colon (32). Jiang et al. demonstrated that suppression
also shown recruitment of macrophages and MDSCs into                   of IL-6-dependent suppressor of cytokine signaling 3 in
the tumor stroma resulting in suppression of the anti-tumor            MDSCs induced phosphorylation of JAK1, JAK2, TYK2,
response (25).                                                         STAT1 and STAT3 proteins, which correlated with T
   With 192 nodes and 469 edges constituting the entire                cell suppression in MDSCs in vitro (33). Taken together,
PPI network, a series of hub proteins was observed to form             these studies suggest that the DEGs identified in our study
a local network including Espn, Cdkn1b, F2d4, Gorasp1,                 may contribute to anti-CD28-induced immune tolerance
Pnck and Acvr1c. For hub gene analysis, the affy and                   through complex mechanisms.
LIMMA packages in Bioconductor were employed in the
R language environment. Using these tools, we obtained
                                                                       Conclusions
338 DEGs in MDSCs from rat transplant recipients treated
with and without anti-CD28, including 27 upregulated and               In summary, our study provided preliminary research
311 downregulated DEGs. Among the DEGs, a number                       into the mechanisms of MDSCs in anti-CD28-induced
of them showed a remarkable fold change (greater than 5)               immune tolerance in rat kidney transplantation. DEGs
in anti-CD28-treated rats compared with non-treated rats,              in tolerant and immunoreactive groups were screened by
including Zap70, Stat1, Stat4, Gzmb, Pcna, Ccl5 and Cxcr3,             computational bioinformatics methods. In addition, hub
with 29, 20, 18, 13, 12, 11 and 10 degrees of connectivity,            genes and signaling pathways were identified as potential
respectively. Therefore, we hypothesize that the DEGs are              targets in MDSCs from immune tolerant rats. Greater
potential biomarkers for distinguishing or predicting anti-            insights may thus be obtained into the etiology and
CD28-induced immune tolerance. However, the mechanism                  mechanisms of transplant tolerance with potential clinical
remains unclear and further verification experiments are               applications for kidney transplant patients.

© Translational Andrology and Urology. All rights reserved.         Transl Androl Urol 2021;10(1):204-214 | http://dx.doi.org/10.21037/tau-20-943
212 Yang et al. MDSC key genes analysis in transplant tolerance
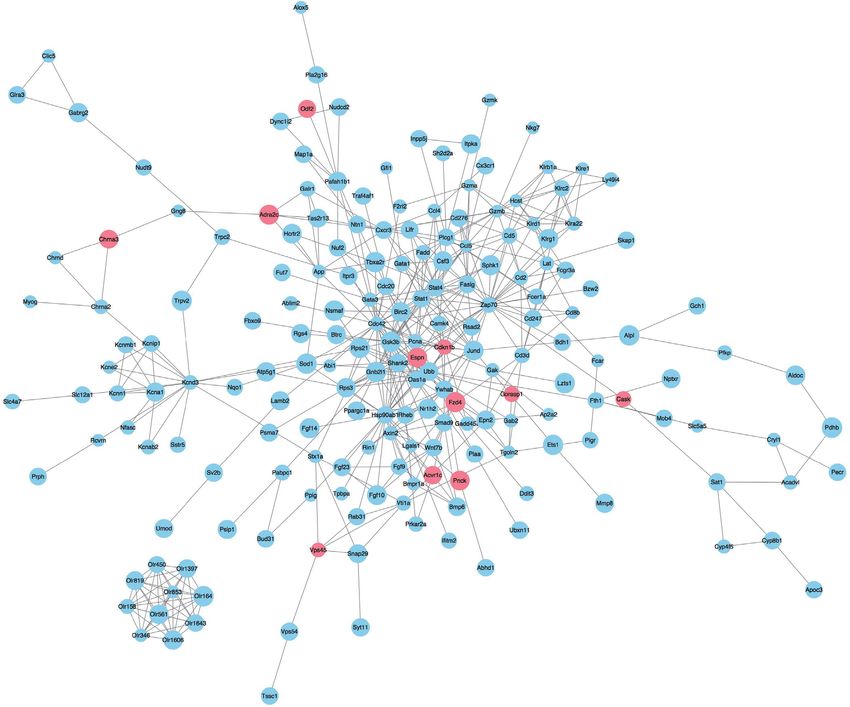
Figure 5 The hub genes in the protein-protein interaction (PPI) network. The top 15 hub genes ranked by degree of connectivity are shown
as a cluster.
Acknowledgments Ethical Statement: The authors are accountable for all
aspects of the work in ensuring that questions related
Funding: This study was supported by the National Key
to the accuracy or integrity of any part of the work are
R&D Program of China (2018YFA0107501 to Ruiming
appropriately investigated and resolved. All procedures
Rong, 2018YFA0107502 to Cheng Yang), the National
performed in this study were in accordance with the
Natural Science Foundation of China (81770747 to
Declaration of Helsinki (as revised in 2013).
Ruiming Rong, 81770746 to Cheng Yang), Shanghai
Rising-Star Program (19QA1406300 to Cheng Yang) and
the Medical, Health Talents Training Plan for the Excellent Open Access Statement: This is an Open Access article
Youth of Shanghai Municipal (2018YQ50 to Cheng Yang) distributed in accordance with the Creative Commons
and 2019 Shanghai Youth Talent Development Program. Attribution-NonCommercial-NoDerivs 4.0 International
License (CC BY-NC-ND 4.0), which permits the non-
commercial replication and distribution of the article with
Footnote the strict proviso that no changes or edits are made and the
Reporting Checklist: The authors have completed the MDAR original work is properly cited (including links to both the
reporting checklist. Available at http://dx.doi.org/10.21037/ formal publication through the relevant DOI and the license).
tau-20-943 See: https://creativecommons.org/licenses/by-nc-nd/4.0/.
Peer Review File: Available at http://dx.doi.org/10.21037/ References
tau-20-943
1. Sykes M. Immune tolerance in recipients of combined
Conflicts of Interest: All authors have completed the ICMJE haploidentical bone marrow and kidney transplantation.
uniform disclosure form (available at http://dx.doi. Bone Marrow Transplant 2015;50 Suppl 2:S82-6.
org/10.21037/tau-20-943). The authors have no conflicts of 2. Ritchie ME, Phipson B, Wu D, et al. limma powers
interest to declare. differential expression analyses for RNA-sequencing and
© Translational Andrology and Urology. All rights reserved. Transl Androl Urol 2021;10(1):204-214 | http://dx.doi.org/10.21037/tau-20-943Translational Andrology and Urology, Vol 10, No 1 January 2021 213
microarray studies. Nucleic Acids Res 2015;43:e47. 17. Barrett T, Wilhite SE, Ledoux P, et al. NCBI GEO:
3. Lamb KE, Lodhi S, Meier-Kriesche HU. Long-term renal archive for functional genomics data sets--update. Nucleic
allograft survival in the United States: a critical reappraisal. Acids Res 2013;41:D991-5.
Am J Transplant 2011;11:450-62. 18. Huang DW, Sherman BT, Tan Q, et al. DAVID
4. Morris H, DeWolf S, Robins H, et al. Tracking donor- Bioinformatics Resources: expanded annotation database
reactive T cells: Evidence for clonal deletion in tolerant and novel algorithms to better extract biology from large
kidney transplant patients. Sci Transl Med 2015;7:272ra10. gene lists. Nucleic Acids Res 2007;35:W169-75.
5. Cippà PE, Fehr T. Spontaneous tolerance in kidney 19. Kanehisa M, Goto S, Sato Y, et al. Data, information,
transplantation--an instructive, but very rare paradigm. knowledge and principle: back to metabolism in KEGG.
Transpl Int 2011;24:534-5. Nucleic Acids Res 2014;42:D199-205.
6. Kawai T, Leventhal J, Wood K, et al. Summary of the 20. Szklarczyk D, Franceschini A, Wyder S, et al. STRING
Third International Workshop on Clinical Tolerance. Am v10: protein-protein interaction networks, integrated over
J Transplant 2019;19:324-30. the tree of life. Nucleic Acids Res 2015;43:D447-52.
7. Zhang W, Li J, Qi G, et al. Myeloid-derived suppressor 21. Saito R, Smoot ME, Ono K, et al. A travel guide to
cells in transplantation: the dawn of cell therapy. J Transl Cytoscape plugins. Nat Methods 2012;9:1069-76.
Med 2018;16:19. 22. Chin CH, Chen SH, Wu HH, et al. cytoHubba:
8. Martin-Moreno PL, Tripathi S, Chandraker A. Regulatory identifying hub objects and sub-networks from complex
T Cells and Kidney Transplantation. Clin J Am Soc interactome. BMC Syst Biol 2014;8 Suppl 4:S11.
Nephrol 2018;13:1760-4. 23. Poirier N, Mary C, Dilek N, et al. Preclinical efficacy
9. Peng B, Ming Y, Yang C. Regulatory B cells: the cutting and immunological safety of FR104, an antagonist anti-
edge of immune tolerance in kidney transplantation. Cell CD28 monovalent Fab' antibody. Am J Transplant
Death Dis 2018;9:109. 2012;12:2630-40.
10. Casiraghi F, Perico N, Gotti E, et al. Kidney transplant 24. Poirier N, Dilek N, Mary C, et al. FR104, an antagonist
tolerance associated with remote autologous mesenchymal anti-CD28 monovalent fab' antibody, prevents
stromal cell administration. Stem Cells Transl Med alloimmunization and allows calcineurin inhibitor
2020;9:427-32. minimization in nonhuman primate renal allograft. Am J
11. Gabrilovich DI, Nagaraj S. Myeloid-derived suppressor Transplant 2015;15:88-100.
cells as regulators of the immune system. Nat Rev 25. Clark CE, Hingorani SR, Mick R, et al. Dynamics of the
Immunol 2009;9:162-74. immune reaction to pancreatic cancer from inception to
12. Kusmartsev S, Su Z, Heiser A, et al. Reversal of invasion. Cancer Res 2007;67:9518-27.
myeloid cell-mediated immunosuppression in patients 26. Gangopadhyay K, Manna B, Roy S, et al. An allosteric hot
with metastatic renal cell carcinoma. Clin Cancer Res spot in the tandem-SH2 domain of ZAP-70 regulates T-cell
2008;14:8270-8. signaling. Biochem J 2020;477:1287-308.
13. Nagaraj S, Gupta K, Pisarev V, et al. Altered recognition 27. Takeuchi Y, Hirota K, Sakaguchi S. Impaired T cell
of antigen is a mechanism of CD8+ T cell tolerance in receptor signaling and development of T cell-mediated
cancer. Nat Med 2007;13:828-35. autoimmune arthritis. Immunol Rev 2020;294:164-76.
14. Dugast AS, Haudebourg T, Coulon F, et al. Myeloid- 28. Zahran AM, Moeen SM, Thabet AF, et al. Monocytic
derived suppressor cells accumulate in kidney allograft myeloid-derived suppressor cells in chronic lymphocytic
tolerance and specifically suppress effector T cell leukemia patients: a single center experience. Leuk
expansion. J Immunol 2008;180:7898-906. Lymphoma 2020;61:1645-52.
15. Dilek N, Poirier N, Usal C, et al. Control of transplant 29. Dufait I, Pardo J, Escors D, et al. Perforin and Granzyme
tolerance and intragraft regulatory T cell localization by B Expressed by Murine Myeloid-Derived Suppressor
myeloid-derived suppressor cells and CCL5. J Immunol Cells: A Study on Their Role in Outgrowth of Cancer
2012;188:4209-16. Cells. Cancers (Basel) 2019;11:808.
16. Adeegbe D, Serafini P, Bronte V, et al. In vivo induction 30. Bayik D, Tross D, Klinman DM. Factors Influencing the
of myeloid suppressor cells and CD4(+)Foxp3(+) T Differentiation of Human Monocytic Myeloid-Derived
regulatory cells prolongs skin allograft survival in mice. Suppressor Cells Into Inflammatory Macrophages. Front
Cell Transplant 2011;20:941-54. Immunol 2018;9:608.
© Translational Andrology and Urology. All rights reserved. Transl Androl Urol 2021;10(1):204-214 | http://dx.doi.org/10.21037/tau-20-943214 Yang et al. MDSC key genes analysis in transplant tolerance
31. Ryan N, Anderson K, Volpedo G, et al. STAT1 inhibits Interferon Cytokine Res 2003;23:591-600.
T-cell exhaustion and myeloid derived suppressor cell 33. Jiang M, Chen J, Zhang W, et al. Interleukin-6 Trans-
accumulation to promote antitumor immune responses Signaling Pathway Promotes Immunosuppressive Myeloid-
in head and neck squamous cell carcinoma. Int J Cancer Derived Suppressor Cells via Suppression of Suppressor
2020;146:1717-29. of Cytokine Signaling 3 in Breast Cancer. Front Immunol
32. Singh UP, Singh S, Iqbal N, et al. IFN-gamma-inducible 2017;8:1840.
chemokines enhance adaptive immunity and colitis. J
Cite this article as: Yang T, Li J, Jia Y, Yang C, Sang R, Zhu T,
Xu M, Rong R, Yang C. Myeloid-derived suppressor cell key
genes analysis in rat anti-CD28-induced immune tolerance
kidney transplantation. Transl Androl Urol 2021;10(1):204-214.
doi: 10.21037/tau-20-943
© Translational Andrology and Urology. All rights reserved. Transl Androl Urol 2021;10(1):204-214 | http://dx.doi.org/10.21037/tau-20-943You can also read