A study of preparing silver iodide nanocolloid by electrical spark discharge method and its properties
←
→
Page content transcription
If your browser does not render page correctly, please read the page content below
www.nature.com/scientificreports
OPEN A study of preparing silver
iodide nanocolloid by electrical
spark discharge method and its
properties
Kuo‑Hsiung Tseng1*, Chu‑Ti Yeh1, Meng‑Yun Chung1, Yur‑Shan Lin1 & Ning Qui2
This study employed an electric discharge machine (EDM) and the Electrical Spark Discharge Method
(ESDM) to prepare silver iodide nanocolloid (AgINC). Povidone–iodine (PVP-I) was dissolved in
deionized water to create a dielectric fluid. Silver material was melted using the high temperature
generated by an electric arc, and the peeled-off material was reacted with PVP-I to form AgI
nanoparticles (AgINPs). Six discharge pulse wave parameter combinations (Ton–Toff) were employed,
and the resultant particle size and suspension of the prepared samples were examined. The results
revealed that AgINPs were successfully created using the ESDM. When Ton–Toff was set at 90–90 μs,
the zeta potential of the AgINC was − 50.3 mV, indicating excellent suspension stability. The AgINC
particle size was 16 nm, verifying that the parameters yielded AgINPs with the smallest particle
size distribution and highest zeta potential. Ultraviolet–visible spectrum analyser was performed
to analyse the samples, and the spectra indicated that the characteristic wavelength was 420 nm
regardless of the Ton–Toff values. X-ray diffraction analysis determined that the AgINPs exhibited
two crystal structures, namely β-AgI and Ag. Transmission electron microscopy was performed
and revealed that the particles were irregularly shaped and that some of the larger particles had
aggregated. The crystal structure was determined to be a mixture of Ag and β-AgI, with a lattice
spacing of 0.235 nm and 0.229 nm, respectively. The lattice spacing of the Ag was 0.235 nm. X-ray
diffraction analysis indicated that the prepared AgINC were composed of only Ag and I; no additional
chemical elements were detected.
Abbreviations
EDM Electric discharge machine
ESDM Electrical spark discharge method
AgINC Silver iodide nanocolloids
PVP-I Povidone–iodine
AgINPs AgI nanoparticles
AgI Nano silver iodide
NPs Nanoparticles
NCs Nanocolloids
DLS Dynamic light scattering
UV–Vis Ultraviolet–visible spectrum analyser
XRD X-ray diffraction
TEM Transmission electron microscope
EDS Energy-dispersive X-ray spectroscopy
PDI Polydispersity index
ICDD International Centre for Diffraction Data
Nanomaterials are crucial in the development and application of n anotechnology1. Various effects occur when
the size of a particle is reduced, such as small size, surface, quantum size, and quantum tunnelling effects. These
1
Department of Electrical Engineering, National Taipei University of Technology, Taipei 10608, Taiwan,
ROC. 2Innolux Corporation., Southern Taiwan Science Park, Kaohsiung City 82151, Taiwan, ROC. *email:
khtseng@ee.ntut.edu.tw
Scientific Reports | (2021) 11:20457 | https://doi.org/10.1038/s41598-021-99976-5 1
Vol.:(0123456789)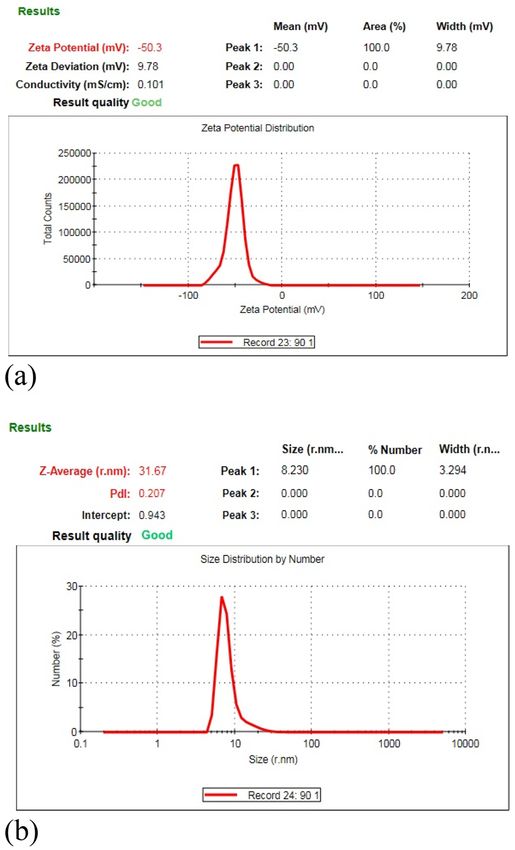
www.nature.com/scientificreports/
Figure 1. Schematic of an EDM.
effects cause materials to exhibit various macroscopic characteristics. Nano silver iodide (AgI) has various appli-
cations, including in photocatalysis, sensors, and fast ionic conductors2–5. For example, polytype AgI nanoplates
enable successful battery operation at room t emperature6. AgI is an essential material with a crystal structure
similar to that of ice; hence, it is often used to induce cloud s eeding7,8. The unique photoelectrical properties and
excellent conductivity of AgI render it a material with high potential in commercial a pplications9,10.
Current methods for preparing nano AgI are precipitation reaction, laser ablation, reverse microemulsion, and
ultrasonic spray p yrolysis11–14. Although the precipitation reaction method is simple and inexpensive, particles
aggregate easily. The ultrasonic spray pyrolysis method can be used to prepare particles with nanostructures.
A liquid-phase substance is used as the precursor in ultrasonic spray pyrolysis, which yields highly pure and
dispersed products. Nevertheless, this method requires the use of costly materials and considerable e nergy15.
In this study, an electrical discharge method similar to the submerged arc t echnique16 was used to prepare
nanoparticles (NPs). This processing technique is called the Electrical Spark Discharge Method17 (ESDM). Both
methods use two electrodes as workpieces, and an electric arc is generated to process the electrode materials. The
workpieces are considered processors or processed objects according to user need. The submerged arc technique
must be performed in a vacuum chamber while maintaining the dielectric fluid at a low temperature. By contrast,
the ESDM does not entail a vacuum environment and requires only a dielectric fluid at normal temperature
and normal pressure. The principle of the spark discharge generation t echnique18 is also quite similar to that of
the method used in this study; however, it is mainly used to prepare aerosols, whereas the products examined
in this study were colloids.
The ESDM preparation process does not require additional chemical agents or dispersants to generate nano-
colloids (NCs) with favourable characteristics. The process is simple, fast, and environmentally friendly and
reduces the likelihood of harming the human body or polluting the environment. In this study, six pulse wave
parameter values (Ton–Toff) were configured using an electric discharge machine (EDM), and the different
Ton–Toff values were used to prepare AgINC through the ESDM method. Next, the characteristics of the AgINC
were analysed using precision instruments. Finally, dynamic light scattering (DLS) analysis was performed to
determine which Ton–Toff value produced AgINC with superior characteristics and could thus serve as the most
suitable parameter for AgINC preparation.
Materials and methods
Principle of electrical spark discharge method (ESDM). In the ESDM, electrical energy is converted
into thermal energy. The method is a thermal processing technique in which electrodes are used to melt mate-
rials quickly. The upper and lower electrodes are composed of conductive materials and are not in direct con-
tact; hence, no physical force is generated. Figure 1 depicts the configuration of an EDM. The upper and lower
electrodes are placed in a highly insulating dielectric fluid, and a direct current pulse from tens to hundreds of
volts is produced between the electrodes19. A servo control system is used to control the upper electrode, which
slowly approaches the lower electrode. When the two electrodes are sufficiently close, the electrical field strength
between the small tips of the electrodes surpasses the insulation strength of the dielectric fluid. This leads to an
electrical breakdown and generates a spark between the two electrodes, inducing an discharge20. The resulting
high temperature can melt or even vaporize the electrodes, creating small particles that randomly disperse.
The particles that enter the dielectric fluid are then rapidly cooled and consolidated to form NPs. Finally, as the
Ton–Toff cycle ends, the surfaces of the two electrodes are cooled by the dielectric fluid, and the insulation is
recovered until the next Ton–Toff cycle begins. The repeated cycle enables the preparation of NCs. Ton is the
discharge pulse time. Because conservation of the electrode material is desired, the pulse duration might be
extended, which expands the plasma region. This increase reduces the density of the plasma region, and the
overall result is a reduction of effectiveness. Toff is the time between active pulse discharges. The electrodes
require time to return to isolation status and the vaporized metallic particles time to cool and solidify. The
Scientific Reports | (2021) 11:20457 | https://doi.org/10.1038/s41598-021-99976-5 2
Vol:.(1234567890)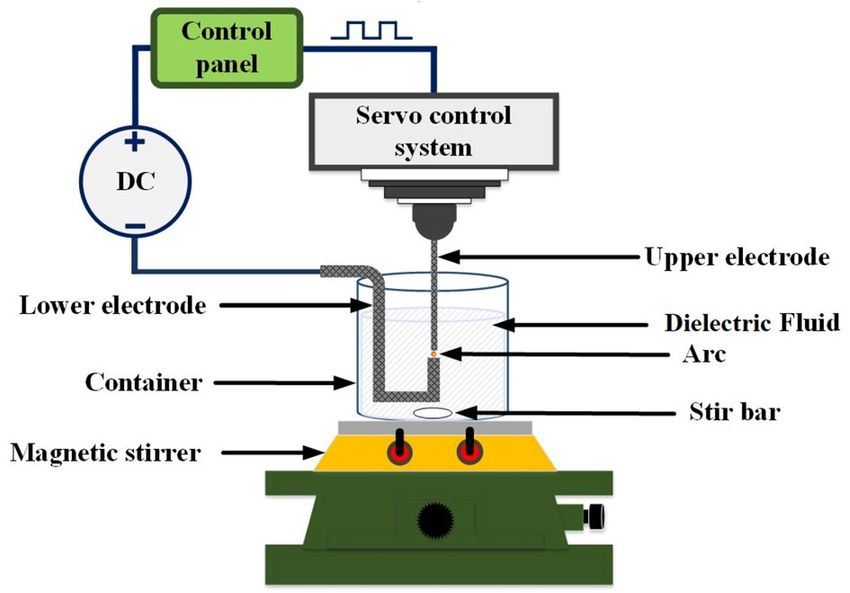
www.nature.com/scientificreports/
Figure 2. ESDM process: (a) voltage generation, (b) ionization effect, (c) melting effect, (d) termination of
electric discharge, and (e) recovery of insulation.
discharge pulse wave parameter values (Ton–Toff) affect the accuracy of the electrical discharge machining and
electrode consumption rate.
Figure 2 details the ESDM process. Vgap and Igap represent the voltage and the current between the two
ff21,22.
electrodes, respectively. Ton and Toff respectively represent the time the current pulse is turned on and o
(a) Voltage generation: The upper and lower electrodes are submerged in dielectric fluid. A direct current
source is connected to the two electrodes. When the electrical field strength at the tips surpasses the insu-
lation strength of the dielectric fluid, electrons are ejected from the lower electrode to the upper electrode
to form an electric arc with a temperature of 5000–6000 K 23.
(b) Ionization effect: When an electrical breakdown occurs in the dielectric fluid, electrons are ejected from
the lower electrodes; the valence electrons in the outermost shell of the atoms are excited to form cations.
The electrons travel rapidly toward the upper electrode and reinduce the ionization effect to form an ioni-
zation channel24. This causes the current to increase and generate a gap current. At this moment, the gap
is approximately 20–30 µm25.
(c) Melting effect: When these ions impact the metal electrode surface, kinetic energy is converted into thermal
energy to form an electric arc, the high temperature of which causes the surface metal to detach and melt.
Accordingly, metal particles are produced from the metal electrode surface.
(d) Termination of electric discharge: The ionization channel quickly disappears. The metal particles and ions
generated during the melting process become suspended in the dielectric fluid.
(e) Recovery of insulation: When the surface temperature of the metal electrodes decreases, the insulation abil-
ity and pressure resistance of the dielectric fluid are recovered. Metal particles are scattered in the dielectric
fluid.
Preparation of AgINC using the ESDM. This study used the ESDM to prepare AgINC. Silver lines with
99.99% purity were used as electrodes. A total of 1 mL of povidone–iodine (PVP-I) was mixed with 199 mL
of deionized water to prepare dielectric fluid. The fluid’s pH was 6.2 and its electrical conductivity 57 μS/cm.
Parameters of the preparation environment are listed in Table 1. Different Ton–Toff parameters were employed
to prepare the AgINC samples. The current segment setting was IP = 1 in level.
Apparatus settings. An ultraviolet–visible spectrum analyser (UV–Vis, Thermo-Helios Omega, Thermo
Fisher Scientific Inc., Waltham, MA, USA) was used to examine the optical properties of the AgINC. The start
and stop wavelength were 190 and 600 nm, respectively. The scanning speed and interval were 240 nm/min and
1 nm, respectively. A zetasizer (Zetasizer Nano ZS90, Malvern Zetasizer, Worcestershire, UK) was used to obtain
the suspension stability and particle size distribution. An absolute value of zeta potential over 30 mV indicated
favourable suspension s tability26. The light source of the zetasizer was a He–Ne laser (633 nm). The scattering
angle to measure particle size was 90°. The dispersant setting was water at 25 °C, viscosity was 0.8872 cP, and
refractive index was 1.330. X-ray diffraction (XRD) was used to analyse the crystal structure. The range of the
2θ was 10°–60°, step size was 0.05, and time per step was 0.5 s. The sample was in powder form. At varying pres-
sure and temperature, AgI exhibits different crystal structures. The most researched structures are the α-, β-, and
γ-phases. α-AgI exhibits a body-centred cubic crystal system; β-AgI has a wurtzite hexagonal crystal system;
and γ-AgI exhibits a zincblende cubic crystal system. Under normal temperature and pressure, the stable crystal
structures of AgI are the β- and γ-phases27. Therefore, AgI prepared using general methods usually contains
a mixture of β- and γ-phases28. Transmission electron microscopy (TEM, JEM-2100F, JEOL Ltd., Japan) was
Scientific Reports | (2021) 11:20457 | https://doi.org/10.1038/s41598-021-99976-5 3
Vol.:(0123456789)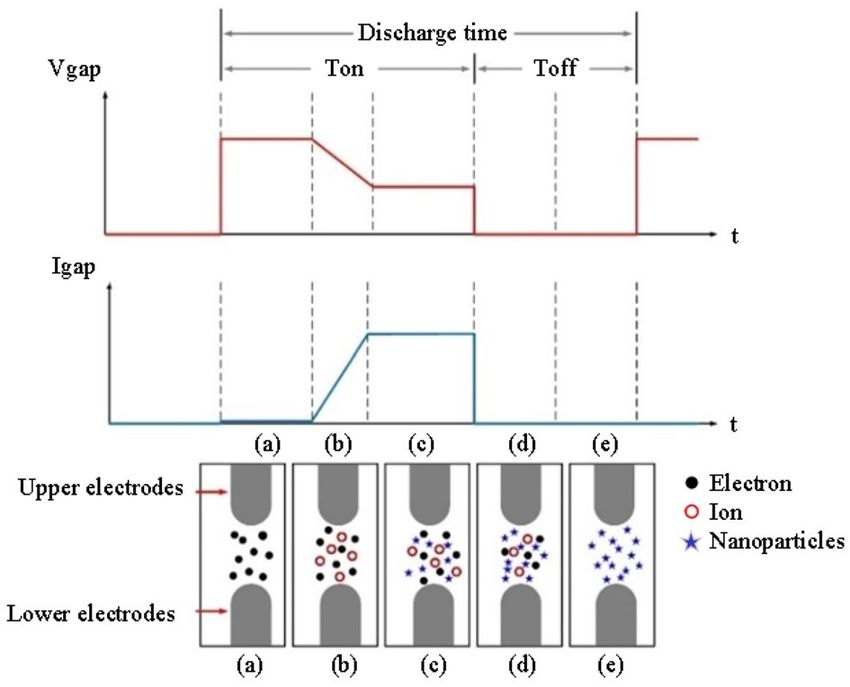
www.nature.com/scientificreports/
Ton-Toff 10–10, 30–30, 50–50, 70–70, 90–90, 110–110 (µs)
Temperature 25 °C
Atmospheric pressure 1 atm
Material Ag wire, 99.99%
Upper electrode: 1 mm
Diameter of material
Lower electrode: 2 mm
Volume of dielectric fluid 200 ml
Dielectric fluid Povidone-iodine (1 ml) + deionized water (199 ml)
Current segment setting IP = 1 in level
Voltage 140 V
Discharge time 5 min
Table 1. EDM parameters for preparing AgINC.
used to analyse particle shape, size, and structure. The energy was as high as 200 kV, and the magnification was
10,000X, 40,000X, and 80,000X. An energy-dispersive X-ray spectroscopy (EDS, JEM-2100F, JEOL Ltd., Japan)
instrument, which was attached to the TEM device, was used to conduct elemental analysis.
Results
Formation of AgINPs. H2O and PVP-I was used as the dielectric fluid, which thus comprised H + and O
H−.
During the discharge process, a high-energy spark was created to melt solid Ag, which was then progressively
vaporized to form Ag atoms. Under the catalytic effect of the electrical field, the Ag atoms lost their electrons
to form Ag+ ions. When the electrical field strength reached 500 kV/cm (the discharge gap was 20 μm, and the
discharge voltage was approximately 100 V), the Ag atoms were decomposed into A g0, Ag+, and e − and reacted
with I3− and H2O to form AgI. OH−, which carries a negative charge, reacted with H2O to form colloids through
hydrogen bonding. In detail, I was embedded in the PVP-I during the electrical field discharge. I − dissociated
and became the structure PVP+…I−. During this period, A g0 dissociated into Ag+ and e− under the electrical
field; thus, Ag+ and I− combined to form AgI, and P VP+ and e− were reduced to PVP0. Simultaneously, the
PVP0 coated the surface of AgI, which provided protection for the AgI, and the OH groups on the PVP were
suspended in water by hydrogen bonds. Figure 3(a) illustrates the ionization process of the AgI and Fig. 3(b) the
mechanism of AgINP suspension.
Zetasizer and UV–Vis results of AgINC prepared using the ESDM. The sample used in the analysis
was prepared using Ton–Toff = 90–90 μs. Figure 4(a) presents the zeta potential of the AgINC sample created
using the optimal parameter setting. The zeta potential reached − 50.3 mV, indicating that the sample exhibited
outstanding suspension stability. Figure 4(b) presents the particle size distribution of the sample. The most com-
mon particle size was 16 nm (radius = 8 nm).
Figure 5 presents the UV–Vis analysis results for the AgINP samples. The results revealed that the charac-
teristic wavelength was 420 nm for all AgINC samples regardless of the Ton–Toff values. The position of the
absorption peak will be displayed at the wavelength where the particle size accounts for the largest proportion
and change due to the difference of particle size. AgINPs prepared by ESDM have a large size range which makes
the peak not shifting. Ton–Toff = 30–30 μs yielded the largest absorbance value (0.914), whereas 110–100 μs
yielded the smallest absorbance value (0.605).
Table 2 compiles the analysis results acquired using UV–Vis and the zetasizer. The Z-average is the average
particle size obtained using the cumulants technique in DLS and is based on the scattered light intensity (%).
Size (r.nm) is determined by converting the intensity (%) into a number (%), with the particle number used as
a reference to estimate the particle size. The polydispersity index (PDI) is the distribution coefficient used to
describe the distribution of the polymer molecular weight or the distribution width of the particle size. Width
refers to the distribution width. For the different Ton–Toff parameters, the peaks of the particle size distribu-
tions were all under 50 nm, indicating that most of the prepared samples were nanosized. The results indicated
that the optimal zeta potential (− 50.3 mV) was achieved when Ton–Toff was 90–90 μs, showing the excellent
suspension stability of the corresponding sample. For this parameter value, the PDI was 0.20, and the width was
3.2 nm (in radius). In consideration of both the particle size distribution and the zeta potential, the smallest
particle distribution and the optimal stability suspension were achieved when Ton–Toff was 90–90 μs, which
was thus the optimal preparation parameter setting.
XRD and TEM of AgINC. Figure 6 presents the results of the XRD analysis. The AgINC sample was deter-
mined to consist of AgI (International Centre for Diffraction Data [ICDD]: 01–072-0260) and Ag (ICDD:
00–001-1167). The ICDD report of AgI suggested that the crystal system of this compound was hexagonal. This
indicated that the crystal orientation of AgI was β, which differs from the crystal orientation of AgI synthesized
through other methods. The Bragg angles of the β-AgI were 22.337°, 23.675°, 25.322°, 39.205°, 42.643°, and
46.313°, which respectively corresponded to the (100), (002), (101), (110), (103), and (112) crystal orientations.
The Bragg angles of Ag were 38.1° and 44.4°, which corresponded to the (111) and (200) crystal orientations. The
ICDD report suggested that Ag was present in the cubic system.
Scientific Reports | (2021) 11:20457 | https://doi.org/10.1038/s41598-021-99976-5 4
Vol:.(1234567890)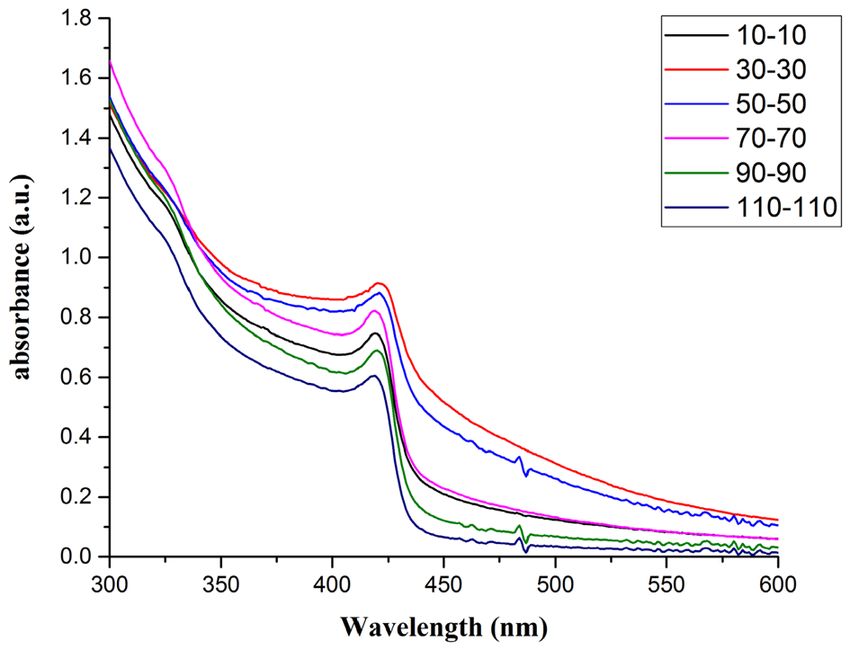
www.nature.com/scientificreports/
Sublimation
Melting Vaporization Ionization
Solid Liquid Gas Plasma
Energy
Ag Ag0
Ag0 Ag++e-
Electrical field(E.F.)
I3-
H+
O O
(a.q.)
PVP-I+H2O
O
+H2O
N N N
CH2 CH CH2 CH CH2 CH
n m
3Ag++I3- 3AgI0
(a)
I3-
H+
O O
N N N O
CH2 CH CH2 CH CH2 CH
I3-
I3- n m H+
O O
H+ N N N O
O O
N N N O
CH2 CH CH2 CH CH2 CH
CH2 CH CH2 CH CH2 CH
n m
n m
H2O H2O
H2O H2O
I3- I3-
N
O
H+
O
N N O
AgI N
O
H+
O
N N O
CH2 CH CH2 CH CH2 CH nanoparticle CH2 CH CH2 CH CH2 CH
n m
n m
H2O
- -
o
+
H H+
I3-
H2O H2O
+
H
N
O O
N N O
I3-
I3-
H+
CH2 CH CH2 CH CH2 CH O O
N N N O
n m H+
O O CH2 CH CH2 CH CH2 CH
N N N O
n m
CH2 CH CH2 CH CH2 CH
n m
(b)
Figure 3. (a) Ionization of AgI; (b) suspension of AgINPs.
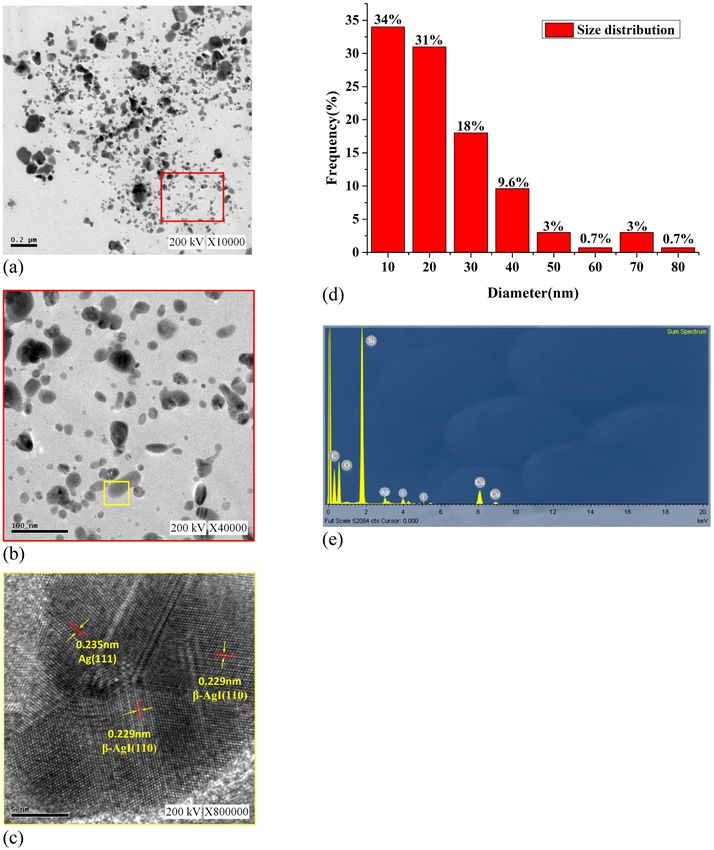
Figure 7 presents the analysis results acquired through TEM and the EDS analyser attached to the TEM
instrument (see the Supplementary Data). The samples is fabricated under 90–90 μs parameter. Figure 7(a)
presents the image taken using a proportional scale of 0.2 µm. Affected by the Van der Waals force, it can be
seen that the distance between small-sized AgINPs is larger, indicating better dispersion. On the contrary, the
distance between large AgINPs is small, and some large particles are stacked and aggregate which indicates the
poor dispersion.Fig. 7(b) presents the magnified image (proportional scale of 100 nm) of the area in the red
frame in Fig. 7(a); this image indicates that the AgINPs had an irregular shape. An irregularly shaped particle was
analysed using TEM. Figure 7(c) presents the magnified image (proportional scale of 5 nm) of the area within
the yellow frame in Fig. 7(b); the image indicates that the lattice spacings of the β-AgI and Ag were 0.229 and
0.235 nm, respectively. Figure 7(d) presents the particle size statistics. The statistical results of Fig. 7(d) mainly
comes from Fig. 7(b). The proportions of the AgINPs with a particle size of 0–10, 11–20, 21–30, 31–40, 41–50,
51–60, 61–70, and 71–80 nm were 34%, 31%, 18%, 9.6%, 3%, 0.7%, 3%, and 0.7%, respectively. Particles of size
0–10 nm were the most common. Figure 7(e) presents the elemental analysis results acquired using EDS. C
represents organic matter, and O represents oxide. Si represents the silicon detector in the equipment, and Cu
represents the substrate (copper net) used in the sample analysis. The results verified that the prepared AgINC
sample did not contain any elements other than Ag and I. Table 3 provides the EDS analysis results of the AgINC.
The mass fraction was 45.34 wt% for Ag and 54.66 wt% for I. The mole fraction was 49.39 at% for Ag and 50.61
at% for I. This indicated that the ratio of Ag and I in the prepared AgINPs was indeed 1:1, with no additional
chemical elements present.
Discussion. The characteristics of the AgINC samples prepared using the ESDM were analysed using UV–
Vis, EDS, XRD, and TEM to yield the following results.
1. Synthesis mechanism: Electric discharge machining was conducted on the Ag electrode in a dielectric fluid
The high energy and high electrical field ionize Ag metal into A g+, and the PVP-I in the dielectric fluid
g+ combines with I3− in the dielectric fluid and generates AgI molecules. Finally, the AgI
forms I3−. Next, A
molecules form AgINPs that are suspended in the dielectric fluid and aggregate into AgINC.
Scientific Reports | (2021) 11:20457 | https://doi.org/10.1038/s41598-021-99976-5 5
Vol.:(0123456789)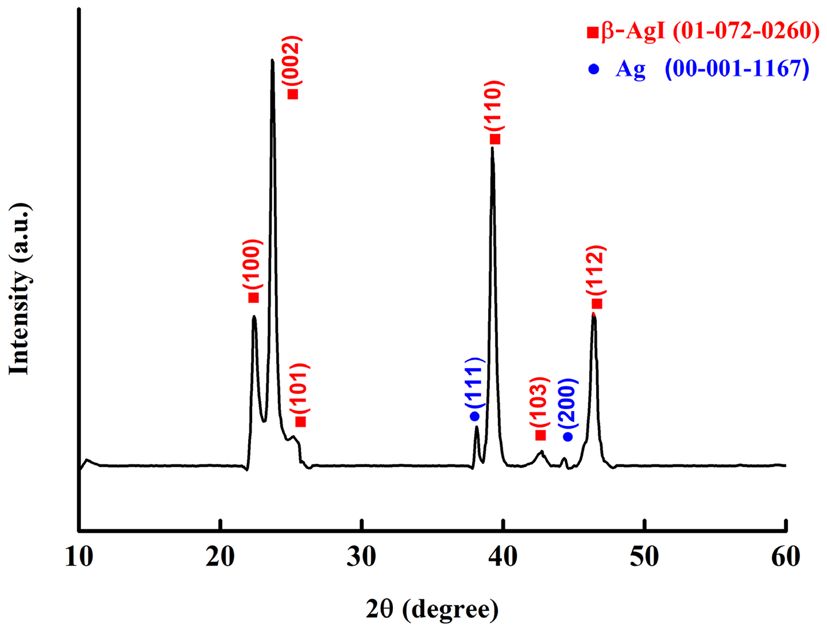
www.nature.com/scientificreports/

                                            Figure 4.  AgINC (a) zeta potential and (b) size distribution.

                                            Figure 5.  UV–Vis analysis results.

          Scientific Reports |   (2021) 11:20457 |               https://doi.org/10.1038/s41598-021-99976-5   6

Vol:.(1234567890)
www.nature.com/scientificreports/
Ton-Toff (μs) Absorbance Zeta potential (mV) Size (r. nm) Z-average (r. nm) PDI Width (r. nm)
10–10 0.747 − 43.0 18 38 0.27 5.6
30–30 0.914 − 46.4 22 39 0.24 6.3
50–50 0.883 − 47.4 23 39 0.21 6.5
70–70 0.822 − 46.6 17 31 0.24 5.0
90–90 0.691 − 50.3 8 31 0.20 3.2
110–110 0.605 − 42.3 12 29 0.23 3.9
Table 2. Results for absorbance, zeta potential, and particle size distribution.
Figure 6. XRD analysis results.
2. Characteristic wavelength and absorbance: In the UV–Vis analysis, the characteristic wavelength of the
prepared AgINPs was discovered to be 420 nm, which matched the optical characteristics of this particle.
This indicated that all six Ton–Toff parameters were feasible for preparing AgINPs. However, the absorb-
ance spectrum of the prepared AgINPs exhibited peaks that ranged from 0.605 to 0.914. This indicated that
absorbance was indeed influenced by Ton–Toff. The six Ton–Toff parameters involve different discharge
and cut-off times. When AgINC exhibited high absorbance, the discharge success rate in the manufacturing
process was higher, but the product characteristics were not necessarily superior. The DLS technique was
required for more precise evaluation of sample characteristics.
3. Suspension: The absolute zeta potential values of the AgINC samples prepared using the six Ton–Toff values
were higher than 30 mV without any other dispersant being added. The samples exhibited favourable sus-
pension stability. Ton–Toff = 90–90 μs yielded the optimal zeta potential (− 50.3 mV). This indicated that the
AgINC prepared with this parameter setting had the greatest suspension stability and dispersibility. Thus,
90–90 μs is the most suitable parameter for the preparation of AgINC.
4. Particle size distribution: AgINPs were examined using DLS under the Number (%) condition. The size (r.
nm) and z-average (r. nm) values of the six Ton–Toff parameters were lower than 50 nm. This indicated that
the prepared products were nanosized. Comparison of the Ton–Toff parameters revealed that the smallest size
(r. nm) of 8 nm was obtained when the parameters were 90–90 μs. Accordingly, the radius of most AgINPs
in the AgINC was 8 nm with a z-average (r. nm) of 31.67 nm; the z-average is the average particle size of
AgINPs after light intensity analysis. Ton–Toff = 90–90 μs was confirmed to be the most suitable combination
for the preparation of AgINC with favourable characteristics according to the DLS analysis results.
5. XRD: The results suggested that the prepared AgINC were composed of β-AgI and Ag. Two possibilities
exist for the presence of the Ag crystals. First, AgI is extremely photosensitive. The samples were prepared in
the presence of indoor light, and XRD analysis entails applying a high-energy radiation beam to the sample
surface. This caused the AgI to be reduced to Ag. Second, Ag crystals might have formed when the A g+ ions
in the colloid were not completely bound with I− ions during the preparation process.
6. TEM: The sample prepared under 90–90 μs was subjected to TEM. The analysis revealed that most of the
large particles had aggregated. Observation of the sample surface revealed that the AgINPs had irregular
shapes. The lattice spacing of nanosilver was determined to be 0.235 nm, and that of AgINPs was 0.229 nm.
These figures are consistent with those published by the ICDD. In the EDS analysis, the ratio of Ai to I in the
AgINPs was nearly 1:1, with 49.39 at% Ag and 50.61 at% I. This verified that the prepared AgINPs contained
no additional chemical elements.
Scientific Reports | (2021) 11:20457 | https://doi.org/10.1038/s41598-021-99976-5 7
Vol.:(0123456789)www.nature.com/scientificreports/
Figure 7. TEM analysis results at (a) 0.2 µm, (b) 100 nm, (c) 5 nm, (d) size distribution, and (e) EDS analysis.
Element Peak area Area sigma K factor Abs Corrn Weight% Sigma Atomic%
Ag 15,803 391 1.724 1.000 45.34 0.75 49.39
I 17,491 304 1.877 1.000 54.66 0.75 50.61
Table 3. EDS analysis of AgINC prepared using the ESDM.
Scientific Reports | (2021) 11:20457 | https://doi.org/10.1038/s41598-021-99976-5 8
Vol:.(1234567890)www.nature.com/scientificreports/
Conclusion
This study employed an EDM to perform the ESDM. PVP-I was dissolved in deionized water to create a dielec-
tric fluid, and an electric arc was generated to melt the metal electrodes and thus prepare AgINC. The synthesis
environment was maintained at normal pressure and temperature, and no additional chemical reagent except
iodine was added. According to the study results, the following conclusions may be drawn.
The characteristic wavelengths of the AgINPs prepared with various Ton–Toff parameters were all 420 nm.
Absorbance was affected by Ton–Toff. The AgINC prepared using Ton–Toff = 90–90 μs had the highest suspen-
sion stability (− 50.3 mV) and smallest particle size (8 nm). This indicates that 90–90 μs is the most suitable
parameter combination for preparing AgINC. The characteristics of AgINC prepared at 90–90 μs were analysed
using XRD and TEM. The XRD analysis results indicated that the AgINC had two crystal orientations, β-AgI
and Ag. TEM analysis indicated that the particle size of most AgINPs was smaller than 20 nm. In addition, the
EDS analysis revealed that the AgINC were composed only of Ag and I, with no other elements present in the
product. In conclusion, the ESDM is a fast, simple, and environmentally friendly AgINC preparation method.
Received: 2 October 2020; Accepted: 5 October 2021
References
1. Bhushan, B. Introduction to nanotechnology. Springer handbook of nanotechnology. Springer, Berlin, Heidelberg, pp. 1–19, 2017.
2. Hu, C. et al. Plasmon-induced photodegradation of toxic pollutants with Ag-AgI/Al2O3 under visible-light irradiation. J. Am.
Chem. Soc. 132, 857–862 (2010).
3. Hötzel, G. & Weppner, W. Potentiometric gas sensors based on fast solid electrolytes. Sens. Actuator 12, 449–453 (1987).
4. Fujishiro, F., & Mochizuki, S. Photo-induced reversible spectral change in several AgI-oxide particle composites. Physica B 376,
827–830 (2006).
5. Hull, S. Superionics: Crystal structures and conduction processes. Rep. Prog. Phys. 67, 1233–1314 (2004).
6. Guo, Y.-G. High-performance rechargeable all-solid-state silver battery based on superionic AgI nanoplates. Electrochem. Com-
mun. 8(7), 1179–1184 (2006).
7. Fajardo, C. et al. Potential risk of acute toxicity induced by AgI cloud seeding on soil and freshwater biota. Ecotoxicol. Environ. Saf.
133, 433–441 (2016).
8. Vonnegut, B. The nucleation of ice formation by silver iodide. J. Appl. Phys. 18, 593–595 (1947).
9. Prager, P. R. Growth and characterization of AgI polytypes. Prog. Crystal Growth Charact. 7, 451–492 (1983).
10. Kartini, E., Sakuma, T., Basar, K. & Ihsan, M. Mixed cation effect on silver-lithium solid electrolyte (AgI) 0.5 (LiPO3) 0.5. Solid
State Ionics 179(19–20), 706–711 (2008).
11. Ismail, R. A. Preparation of silver iodide nanoparticles using laser ablation in liquid for antibacterial applications. IET Nanobio-
technol. 12(6), 781–786 (2018).
12. Chen, S., Ida, T. & Kimura, K. A novel method for large-scale synthesis of AgI nanoparticles. Chem. Commun. 23, 2301–2302
(1997).
13. Tamura, S. et al. Colloidal silver iodide: Synthesis by a reverse micelle method and investigation by a small-angle neutron scattering
study. J. Electroanal. Chem. 559, 103–109 (2003).
14. Validžić, I. L., Janković, V., Uskoković, D. P. & Nedeljković, J. M. Formation of silver iodide particles from thermodynamically
stable clusters using ultrasonic spray pyrolysis. J. Eur. Ceram. Soc. 27, 927–929 (2007).
15. Deng, X. Y., Xiang, L. & Jin, Y. Advances on synthesis of nano-powders by liquid chemical methods. Mod. Chem. Ind. 22(1), 19–21
(2002).
16. Lo, C.-H., Tsung, T.-T. & Lin, H.-M. Preparation of silver nanofluid by the submerged arc nanoparticle synthesis system (SANSS).
J. Alloys Compd. 434, 659–662 (2007).
17. Kuo-Hsiung, T., Yur-Shan, L., Yun-Chung, L., Der-Chi, T., & Leszek, S. Deriving optimized PID parameters of nano-Ag colloid
prepared by electrical spark discharge method. Nanomaterials 10(6), 1091 (2020).
18. Meuller, B. O. Review of spark discharge generators for production of nanoparticle aerosols. Aerosol Sci. Technol. 46(11), 1256–1270
(2012).
19. Hockenberry, T. O. The role of the dielectric fluid in electrical discharge machining. SAE Technical Paper, 1968.
20. Yeo., S. H., Tan, P. C., & Kurnia, W. Effects of powder additives suspended in dielectric on crater characteristics for micro electrical
discharge machining. J. Micromech. Microeng. 17, 91–98 (2007).
21. Tseng, K.-H. Novel preparation of reduced graphene oxide-silver complex using an electrical spark discharge method. Nanomateri-
als 9(7), 979 (2019).
22. Tseng, K.-H., Hsieh, C.-L. & Chung, M.-Y. Fabrication of nano-bismuth colloids in deionized water by electrical discharge machine.
Nanotechnology 31(425704), 1–6 (2020).
23. Gostimirovic, M., Kovac, P., Sekulic, M. & Skoric, B. Influence of discharge energy on machining characteristics in EDM. J. Mech.
Sci. Technol. 26(1), 173–179 (2012).
24. Tabrizi, N. S. Generation of nanoparticles by spark discharge. J. Nanopart. Res. 11(2), 315 (2009).
25. Kohut, A. From plasma to nanoparticles: Optical and particle emission of a spark discharge generator. Nanotechnology 28(47),
475603 (2017).
26. Ushikubo, F. Y. Zeta-potential of micro-and/or nano-bubbles in water produced by some kinds of gases. IFAC Proc. 43(26), 283–288
(2010).
27. Sun, S. R. & Xia, D. G. An ab-initio calculation study on the super ionic conductors α-AgI and Ag2X (X=S, Se) with BCC structure.
Solid State Ionics 179, 2330–2334 (2008).
28. Burley, G. Kinetics and mechanism of the low-cubic to hexagonal phase transformation of silver iodide. J. Phys. Chem. 68, 1111–
1114 (1964).
Acknowledgements
The authors would like to thank the Precision Research and Analysis Center, National Taipei University of Tech-
nology, for technical supporting this research. The authors thank Dr. Der-Chi Tien (Department of Electrical
Engineering, National Taipei University of Technology, Taiwan) for assistance and helpful discussions.
Scientific Reports | (2021) 11:20457 | https://doi.org/10.1038/s41598-021-99976-5 9
Vol.:(0123456789)www.nature.com/scientificreports/
Author contributions
Project administration, K.-H.T.; resources, K.-H.T.; supervision, K.-H.T.; funding acquisition, K.-H.T.; data
curation, C.-T.Y. and Y.-S.L.; formal analysis, N.Q.; methodology, Y.-S.L. and N.Q.; validation, M.-Y.C., Y.-S.L.;
writing—original draft, N.Q. and Y.-S.L.; writing—review and editing, C.-T.Y. and M.-Y.C. All authors have read
and agreed to the published version of the manuscript.
Funding
The Ministry of Science and Technology (MOST 108–2221-E-027–050-).
Competing interests
The authors declare no competing interests.
Additional information
Supplementary Information The online version contains supplementary material available at https://doi.org/
10.1038/s41598-021-99976-5.
Correspondence and requests for materials should be addressed to K.-H.T.
Reprints and permissions information is available at www.nature.com/reprints.
Publisher’s note Springer Nature remains neutral with regard to jurisdictional claims in published maps and
institutional affiliations.
Open Access This article is licensed under a Creative Commons Attribution 4.0 International
License, which permits use, sharing, adaptation, distribution and reproduction in any medium or
format, as long as you give appropriate credit to the original author(s) and the source, provide a link to the
Creative Commons licence, and indicate if changes were made. The images or other third party material in this
article are included in the article’s Creative Commons licence, unless indicated otherwise in a credit line to the
material. If material is not included in the article’s Creative Commons licence and your intended use is not
permitted by statutory regulation or exceeds the permitted use, you will need to obtain permission directly from
the copyright holder. To view a copy of this licence, visit http://creativecommons.org/licenses/by/4.0/.
© The Author(s) 2021
Scientific Reports | (2021) 11:20457 | https://doi.org/10.1038/s41598-021-99976-5 10
Vol:.(1234567890)You can also read