Analysing potential bond contributions in a low-carbon transition - Quantitative framework
←
→
Page content transcription
If your browser does not render page correctly, please read the page content below

Quantitative framework

Analysing potential bond contributions
in a low-carbon transition
This paper was prepared by the Organisation for Economic Co-operation and Development (OECD). This report is
 circulated under the responsibility of the Secretary-General of the OECD. The opinions expressed and arguments
 employed herein do not necessarily reflect the official views of OECD member countries.

 This input paper has been prepared by the author as a contribution to the G20 Green Finance Study Group
 (GFSG) but has not been endorsed by it nor does it represent the official views or position of the GFSG or any of
 its members.

 Please cite this publication as:

 OECD (2016), A quantitative framework for analysing potential bond contributions in a low-carbon transition.

This document and any map included herein are without prejudice to the status of or sovereignty over any territory, to
the delimitation of international frontiers and boundaries and to the name of any territory, city or area.

© OECD 2016. Applications for permission to reproduce or translate all or part of this material should be made to:
rights@oecd.org.
ACKNOWLEDGEMENTS

     This note is an output of the OECD Environment Directorate, directed by Simon Upton, and the
subsidiary Climate, Biodiversity and Water Division led by Simon Buckle. The author of this note is
Christopher Kaminker (OECD Environment Directorate), under the supervision of Robert Youngman and
Simon Buckle (OECD Environment Directorate). The author is thankful in particular to Hideki Takada
(OECD Environment Directorate) for his valuable research assistance, and to Ma Jun (People’s Bank of
China and G20 Green Finance Study Group co-chair) and Robert Youngman for their guidance, comments
and encouragement.

     The OECD would like to thank Bloomberg Philanthropies for generous support for and substantive
contributions to this project, with special thanks to Kevin Sheekey and Meridith Webster. A separate
“Policy Perspectives” brochure on green bonds, which introduced key messages from this note, was
produced jointly with Bloomberg Philanthropies and benefited from input and advice provided by Daniel
Firger, Lenora Suki and Curtis Ravenel, who also co-hosted a joint OECD-Bloomberg side event at the
Château de la Muette during COP21. Thanks are also due to Lee Cochran for her contributions to the
OECD’s outreach and communications for the project. The note benefited from insights gained from the
OECD’s Green Investment Financing Forums (in June 2014 and May 2015), the Green Bond Quantitative
Consultation hosted by Bloomberg during the BNEF Summit (April 2015) and the G20 Green Finance
Study Group meetings of 2016. It also draws on broader work undertaken by the OECD on “Public
Policies for Facilitating Green Long-Term Infrastructure Investment”, which is generously supported by
voluntary contributions from the Japanese Ministry of Finance.

     The note was informed by a review of the academic literature conducted by John Parsons, Michael
Mehling and Joshua Hodge of the Massachusetts Institute of Technology (MIT). The OECD worked with
Vivid Economics to develop a quantitative model that underpins the analysis exhibited in this note. Robin
Smale led and co-ordinated the contribution from Vivid Economics, developed by Karim Aitchabane and
advised by Samuel Fankhouser. Fabian Kesicki and Michael Waldron (IEA) co-ordinated the data and
review process for the IEA’s scenarios used in the construction of the quantitative model. Hideki Takada
(OECD) and Ma Jun (People’s Bank of China) provided specific input and review for the Japanese and
Chinese markets, respectively. The author is grateful to this project team for their expert comments and
review throughout the development of the report as well as to project advisors Sean Kidney and Beate
Sonerud (Climate Bonds Initiative), Mark Fulton (Energy Transition Advisors), Sean Flannery (Meister
Consultants); and Daniel Firger, Lenora Suki, Ethan Zindler and Nathan Serota (Bloomberg).

     The author would like to thank his colleagues at the OECD and IEA Secretariats who provided
valuable comments and review to the report: Richard Baron, Greg Briner, Tyler Bryant, Simon Buckle,
Serdar Celik, Jane Ellis, Mats Isaakson, Fabian Kesicki, André Laboul, Stephen Lumpkin, Iota Nassr, Joel

                                                   1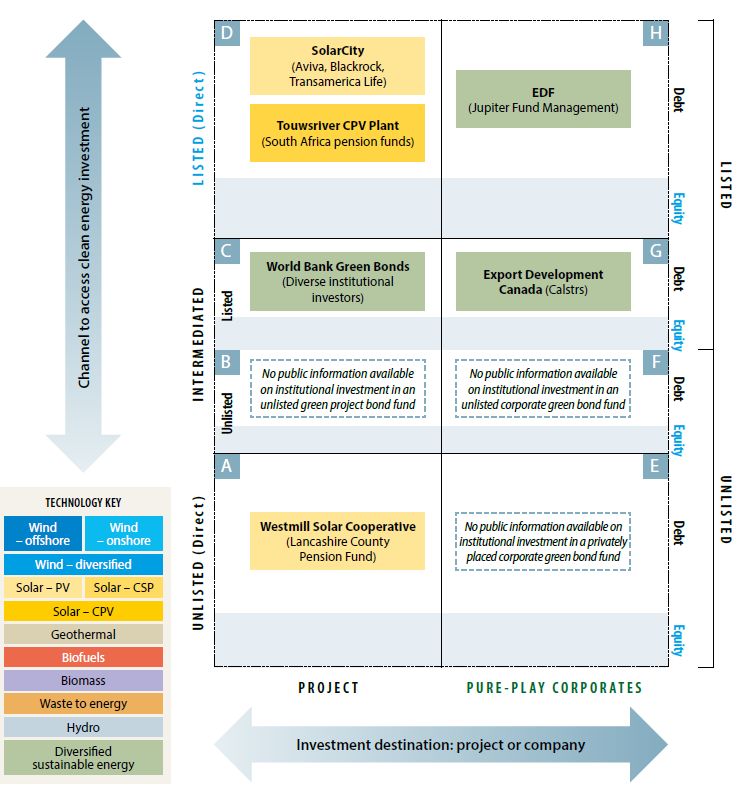
Paula, Andrew Prag, Michael Waldron, Gert Wehinger, and Simon Upton. In addition, the author would
like to thank the following expert reviewers for their inputs, comments and guidance: Roberta Benedetti
del Rio (Generation Investment Management), Murray Birt (Deutsche Bank), Gordon Clark (Oxford
University), Christopher Flensborg (SEB), Branimir Gruic (Bank for International Settlements), Anadi
Jauhari (EEEIG), Eila Kreivi (EIB), Kyung-Ah Park (Goldman Sachs), Nicholas Pfaff (ICMA), Heike
Reichelt (World Bank), and Mike Wilkins (S&P).

    This work benefitted from review and comments provided by the “Greening the Bond Markets” sub-
group of the G20 Green Finance Study Group, co-chaired by the People’s Bank of China and the Bank of
England as well as the OECD/G20 Taskforce on Institutional Investors and Long-Term Financing. The
OECD/G20 Taskforce comprises government delegates to the OECD Insurance and Private Pensions
Committee (IPPC) and its Working Party on Private Pensions (WPPP), as well as the OECD Committee on
Financial Markets (CMF), the International Organisation of Pension Supervisor (IOPS) and other G20
government delegates.

                                                  2
TABLE OF CONTENTS
ACKNOWLEDGEMENTS ............................................................................................................................1
EXECUTIVE SUMMARY .............................................................................................................................4
1. Organising Framework ............................................................................................................................8
1.1. Objectives ..........................................................................................................................................8
1.2. Sectors assessed.................................................................................................................................8
1.3. Geographic coverage .........................................................................................................................9
1.4. Methodology ...................................................................................................................................10
2. High level quantitative results ...............................................................................................................14
2.1. Debt to equity breakdown ...............................................................................................................14
2.2. High level results in context ............................................................................................................16
3. Results by type of bond..........................................................................................................................20
3.1. Financial Sector Bonds....................................................................................................................20
3.2. Asset Backed Securities ..................................................................................................................22
3.3. Project bonds ...................................................................................................................................24
3.4. Sovereign, sub-sovereign, municipal and agency bonds .................................................................24
4. Geographic results and variations ..........................................................................................................26
4.1. United States ...................................................................................................................................28
4.2. European Union...............................................................................................................................29
4.3. China ...............................................................................................................................................30
4.4. Japan ................................................................................................................................................32
5. Detailed results by physical asset sector ................................................................................................33
5.2. Low-emission vehicle financing and bonds ....................................................................................34
5.3. Renewable energy bonds .................................................................................................................35
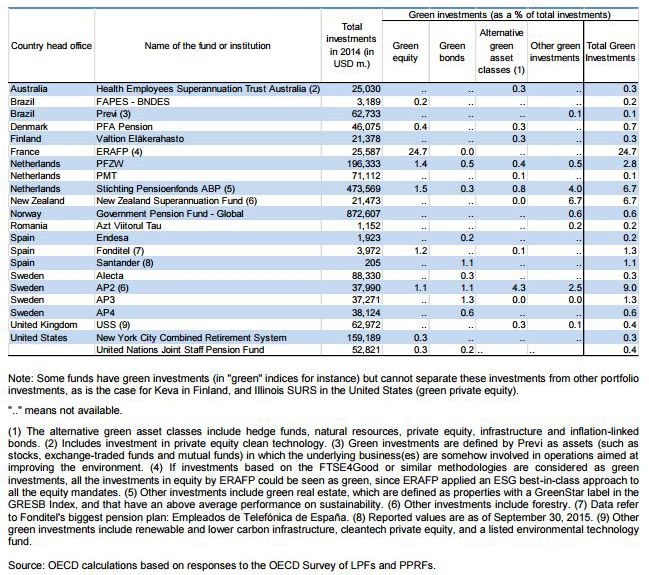
6. Implications for institutional investors ..................................................................................................37
6.1. Implications for asset allocation ......................................................................................................37
6.2. Mapping channels for institutional investment in green bonds .......................................................38
.......................................................................................................................................................................41
ANNEX 1.A METHODOLOGY, MODEL STRUCTURE, ASSUMPTIONS AND SOURCES FOR
CAPITAL STRUCTURE DATA ..................................................................................................................41
ANNEX 1.B FINANCIAL BREAKDOWN ASSUMPTIONS ...................................................................47
ANNEX 1.C. MODEL OUTPUT BY BOND, GEOGRAPHY AND SECTOR (BASELINE SCENARIO)
.......................................................................................................................................................................55
ANNEX 1.D ANNOTATIONS FOR FIGURE 1.23 ....................................................................................57
REFERENCES ..............................................................................................................................................60
3EXECUTIVE SUMMARY
This analysis considers scenarios for the potential contribution of the bond markets to meet low-
carbon investment financing needs in a 2oC energy pathway. 1 The IEA has estimated investment needs in
the renewable energy, energy efficiency and LEV sectors to 2035, consistent with an expectation that
countries will take policy actions leading to a 2oC emissions pathway or scenario (“a 2DS”).
Building on these investment scenarios, this work applies assumptions based on current trends in
regional financial markets to synthetically break down the aggregated investment needs by source of
finance and type of financial instrument. The analysis converts investments into their constituent equity
and debt components. Focusing on debt, the analysis considers the role that the bond markets can play to
finance this investment.
Investment needs over the two decades are considered for renewable energy, the energy efficiency
portion of building investments, and low-emission vehicles (LEVs) 2. These three sectors accounted for
75% of outstanding labelled green bonds as of June 2015. For purposes of simplicity, the analysis refers to
bonds issued in the renewable energy, energy efficiency and LEV sectors as “low-carbon bonds”, and does
not speculate on what portion will be labelled green in 2035. 3
Other segments of labelled green bond and unlabelled climate bond markets relate to low-carbon
public transportation, climate adaptation, clean water, waste management, agriculture, land remediation,
industrial gas treatment and other key areas of environmentally-related investment. These sectors are
beyond the scope of this analysis but are clearly important areas of green finance where the bond markets
can (and do) play a significant role. 4
The analysis covers debt securities markets in China, the EU, Japan and the US, which represent
almost 70% of the global annual investment needs projected for the next five years. These markets
currently have significantly more established debt securities markets than other regions, and are the largest
globally, accounting for around 75% of the global debt securities markets valued at 97 trillion in 2014. 5
1
The concept of “green finance” as used by the G20 Green Finance Study Group is broader than the concept of a 2oC
energy investment pathway, as the former contains financing needs for addressing other environment challenges in
addition to climate action. Nevertheless, low-carbon investment will be a central aspect of any green finance
agenda.
2
LEV includes hybrid vehicles, plug-in and electric vehicles and fuel-cell vehicles.
3
In practice as of 2015, 11% of the wider “climate-aligned” bond market is explicitly labelled as green, and although
the green labelled segment has been growing, reaching a conclusion as to the proportion of green labelling in 2035 is
beyond the scope of this work.
4
As perspective, in China approximately 40% of “green investment” needs will be for low-carbon projects (including
public transport) in the period 2014-2020, with the other 60% being needed in these other sectors such as water
(supply, savings and remediation), waste treatment, sewage, land remediation and industrial gas treatment.
5
Debt securities outstanding from all sectors amounted to USD 39 trillion in the US, USD 21 trillion in the EU, USD
9.7 trillion in Japan and USD 4.3 trillion in China. New gross issuance in 2014 amounted to USD 19 trillion in these
markets.
4Debt (lending) and bond financing needs are estimated to continue to grow significantly in capital
expenditure terms, while decreasing somewhat as a proportion of investment. Debt is seen as covering 60%
of total investment needs between 2015 and 2025, while this ratio decreases steadily to 52% in 2035. The
mix of financing types ranges significantly across the types of assets. For renewables, the debt to equity
ratio remains about level at 75%. Current financing and purchasing trends show that a significant
proportion of energy efficiency and LEV investment is done through consumer finance or equity.
Assuming that this continues to be the case, and given the increasingly large size of LEV and energy
efficiency investment needs relative to renewables over the period, equity and self (cash) finance are
estimated to continue to make a large and growing contribution to financing low-carbon energy
investment.
The role of bonds in financing investment depends on the maturity of the technology, the
characteristics of the projects including the scale at project level, as well as the type of investor. The results
of the analysis suggest that by 2035 in a 2DS, bonds for low-carbon energy investments have the potential
to scale to as much as USD 4.7-5.6 trillion in outstanding securities globally and USD 620-720 billion in
annual issuance in the markets studied. While these figures may seem large on an absolute basis, they are
small (approximately 4%) relative to the scale of issuance in debt securities markets generally.
The analysis suggests that the 2020s have the potential to be the beginning of the “golden years” for
bond issuance in the low-carbon sectors. As low-carbon technologies mature, they become more familiar
to bond markets which can become substantial contributors to the financing and re-financing of new-build
assets. As the costs of assets fall and as policy stabilises, the role played by bonds could expand rapidly.
The analysis examines the potential for different types of bond to finance a range of sectors and sub-sectors
of low-carbon investments studied; displaying a picture of the volume of outstanding securities through to
2035 and the speed at which they could potentially scale up.
Revitalising the concept of securitisation, which was tarnished during the 2007-2008 financial crisis is
important to the scaling up of low-carbon infrastructure finance and has emerged as a key area of focus for
policy makers generally. This revitalisation may be achieved in large measure by standardising the assets
and by making the process, and the market activity it spurs, safer, simpler and more transparent.
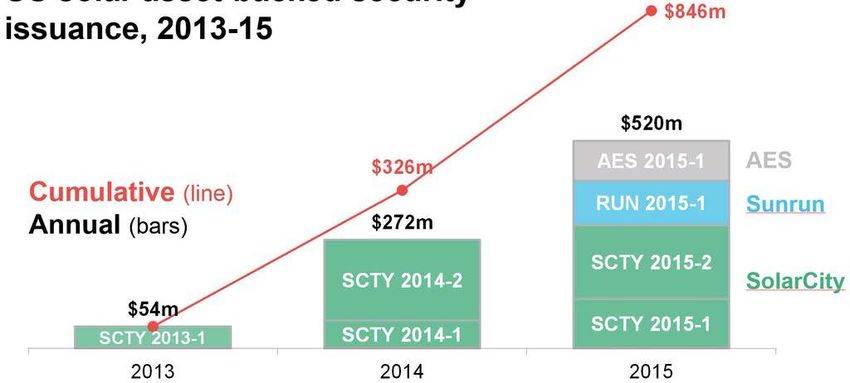
Accordingly, a need to activate and scale up issuance of asset-backed securities (ABS) is identified, with
solar PV and leases of LEVs being seen as a particularly suitable target; as demonstrated by ABS issued in
2014-2016 from these sectors (e.g. SolarCity and Toyota).
By 2035 in the baseline scenario, almost a third of outstanding bonds from the low-carbon sectors
studied could be in the form of ABS. Conservative assumptions used for these scenarios based on the
literature available in 2015 suggest there is potential to “surprise to the upside” based on observed market
activity in 2015-16 beginning to diverge significantly from forecasts (e.g. in LEV sales and solar PV
deployment).
ABS have a disproportionately large potential to scale since they are less likely to be constrained by
government fiscal and budgetary constraints in the case of government (i.e. municipal) bonds, and by
balance sheet constraints in the case of corporate and Sovereign, Supranational and Agency (SSA) bonds
seen as accounting for USD 240 billion and 640 billion (8% and 14%) of bonds outstanding in 2035.
Efforts to support green securitisation must be undertaken in a prudent, judicious and transparent manner
5so that green ABS markets emerge with integrity and with due consideration for any financial stability
issues.
The results also reveal the prominent role loans play in financing low-carbon investment needs to
2035. Financial institutions are expected to continue to be the largest provider of loans to all three sectors
given their specific expertise in the arranging of credit for the earlier stages of infrastructure development
project cycle through to project operation, at which point other sources of debt capital including bond
markets can be called on to re-finance the debt. While financial institutions have a major role to play in
arranging the debt financing for low-carbon infrastructure through loans and through underwriting and
investing in bonds, they notably also can act as issuers of “financial sector” bonds to raise capital AND
fund their lending activities.
Financial institutions are expected to continue to use bond markets to raise capital to finance their
low-carbon related lending, which can lead to financial sector issuance of bonds that finance this on-
balance sheet lending (e.g. ABN AMRO’s 2015 EUR 500 million green bond). This segment of the market
has the potential to add up to USD 1 trillion to the total bonds outstanding in 2025 and over USD 1.7
trillion in 2035.
The scenarios highlight geographical variations and some similarities. For instance, financial sector
issuance potential is seen as strong in all four markets accounting for the largest low-carbon bond sector in
China, the EU and Japan.
In the US, a higher share of ABS is possible than in other markets in 2035 representing the largest
share followed closely by financial sector bonds. This is due to the higher level of maturity of the financial
markets in general and securitisation markets in particular. US utilities are among the most active users of
bond finance, and are reflected as such in this analysis. Over time it is assumed that a portion of corporate
borrowing by US utilities will be substituted by project bonds and ABS. US municipal authorities are also
prominent issuers in bond markets to finance their infrastructure-related expenditure and this is expected to
continue.
In the EU, ABS have the potential to be the second largest bond type, with the financial sector playing
a more prominent role than in the US. ABS could accumulate a large market share but may cede some of
this share over time to corporate and project bonds. The increase in project bonds reflects the Europe 2020
Project Bond Initiative which is targeted at increasing reliance on bond financing at the project level.
Corporate bond issuance is likely to be significant given the active role European utilities have played in
the EU corporate bond market. There could also be strong involvement of governments in raising funds
through the bond market to implement energy efficiency and renewable energy programmes. Many options
are possible in Europe and much will depend on the direction policy takes and the strength of corporate
utility balance sheets, which have deteriorated in recent years.
In Japan, overall the assumptions drawn from the literature and used to examine the Japanese
market’s potential result in a low degree of securitisation and bond issuance in Japan. Investment needs for
a 2DS in general are lower compared to the other three markets and bond issuance as a percentage of
investment needs is also lower. In 2015-2016, a market for low-carbon project bonds emerged in Japan,
and this is expected to continue to grow.
6In China, corporate and project bonds may take the greater share while ABS expands alongside a
maturing debt capital market. China has been largely successful in creating a market for infrastructure
bonds. The prospect of participation by financial and corporate entities in China was realised in early 2016
following the release of guidance, regulations and requirements for green bond issuance by the People’s
Bank of China. As of April 2016, green bond issuance in China had already reached USD 5.3 billion, with
forecasts for annual issuance surpassing USD 46 billion in 2016; a figure already close to that shown in the
scenario for 2020 of around USD 52 billion in annual issuance potential.
The current policy push to reduce reliance on the banking sector in China could hasten the
development of an ABS market and bond markets in general. Sub-sovereign development banks working
in conjunction with policy banks, are seen as having the potential to play a pivotal role in the early
development of a low-carbon bond market in China.
Bond issuance must occur at a scale, and in a format, with which institutional investors are
comfortable. The analysis suggests that institutional investors have the potential to shift their asset
allocations over time and absorb the increasing supply of low-carbon bonds.
The speed at which green bond markets develop and mature hinges on many variables, including
policy and regulatory factors, market conditions and financing trends. Additionally, the evolving green
bond market faces a range of specific challenges and barriers to its further evolution and growth. A key
foundation for future market growth is that governments adopt policies supportive of expanded low-carbon
project pipelines and bond market development. Banks, corporates and other market participants would
then be in a position to scale up their investments in line with expanded physical asset deployment
requirements envisaged under a 2DS. Project bonds and ABS can also play a vital role in helping to fill
investment gaps directly and through capital recycling. The analysis suggests that if there is concerted
attention by policy makers and market participants, the bond markets can be relied on as a critical
foundation for raising the debt capital that will be needed for the transition to a low-carbon economy.
71. Organising Framework
1.1. Objectives
This analysis contains the first quantifications 6 of debt financing, and bond financing in
particular, to meet the 2oC energy investment scenarios (2DS) set forth by the IEA. 7 The concept of “green
finance” as used by the G20 Green Finance Study Group is broader than the concept of a 2oC energy
investment pathway, as the former contains financing needs for addressing other environment challenges
(such as water, air pollution and land contamination) in addition to climate action. Nevertheless, a 2oC
energy investment scenario will be a central aspect of any green finance agenda.
The objectives of this analysis are three-fold:
1. To assess how much debt finance is needed to meet the IEA’s 2DS between 2015 and 2035 in the
four markets studied;
2. To assess how the bond market might evolve from 2015 to 2035 to provide part of these needs,
taking into account projected policy and technology development as well as financial innovation;
and
3. To analyse the implications of the transformation of the bond market for the institutional
investors that have driven the growth of the green bond market to date.
1.2. Sectors assessed
The focus of this analysis is on bond financing for the renewable energy, energy efficiency and
low-emission vehicle (LEVs) sectors. According to IEA (2014: 199), these sectors are key components of
the low-carbon assets included in the 2DS (between 80-90% depending on the scenario as measured by
total investment), and were selected because sufficiently granular data and assumptions for these sectors
are available [to 2035]. The scope extends only to the energy efficiency portion of building investment
though investment in other forms of energy efficiency such as in industry is another integral component of
the 2DS pathway. Other elements of aggregate green building investment are also likely to have significant
potential for bond financing, but could not be included in the analysis.
6
OECD is working with Vivid Economics to build scenario models for market evolution.
7
The IEA World Energy Outlook “450 Scenario” sets out an energy pathway consistent with the goal of limiting the
global increase in temperature to 2°C by limiting concentration of greenhouse gases in the atmosphere to around 450
parts per million of CO2.The 2°C Scenario (2DS) is the focus of the IEA’s Energy Technology Perspectives (ETP).
The 2DS describes an energy system consistent with an emissions trajectory that recent climate science research
indicates would give an 80% chance of limiting average global temperature increase to 2°C. It sets the target of
cutting energy-related CO2 emissions by more than half in 2050 (compared with 2009) and ensuring that they
continue to fall thereafter. The 2DS acknowledges that transforming the energy sector is vital, but not the sole
solution: the goal can only be achieved if CO2 and GHG emissions in non-energy sectors are also reduced. The 2DS
is broadly consistent with the World Energy Outlook 450 Scenario through 2035. (Source: IEA 2014, 2015)
8Renewable energy, energy efficiency in building investment and LEVs accounted for 75% or
USD 50 billion out of 66 USD billion in outstanding labelled green bonds as of June 2015, and 79% of
annual green labelled issuance in 2015. Other segments of labelled green bond and unlabelled climate bond
markets relate to low-carbon public transportation, climate adaptation, clean water, waste management,
agriculture and forestry and other key areas of environmentally-related investment (CBI/HSBC, 2015).
These sectors are beyond the scope of this analysis (and some sectors like adaptation are not included in
the IEA’s 2DS figures) but are clearly important areas of green finance where the bond markets can (and
do) play a significant role. As perspective, the CCICED (2015) estimates that in China approximately 40%
of “green investment” needs will be for low-carbon projects in the period 2014-2020, with the other 60%
being needed for sectors such as water (supply, savings and remediation), waste treatment, sewage, land
remediation and industrial gas treatment. 8
For simplicity, the analysis refers to bonds issued in the renewable energy, energy efficiency in
buildings and LEV sectors as “low-carbon bonds”, and does not speculate on what portion will be labelled
green in 2035. In practice, as of 2015, 11% of the wider “climate-aligned” bond market was explicitly
labelled as green and this share has been growing (CBI/HSBC, 2015). It is, however, difficult to predict
what this share may be in 2035. 9
1.3. Geographic coverage
The quantification of the potential for low-carbon future bond financing presented in the analysis
covers China, the EU, Japan and the US, which together represent 68% of the global annual energy sector
supply investment needs (including fossil fuels) projected for the next five years and 52% in 2035 in a 2DS
(Table 1.1). These four markets were chosen to analyse given they have significantly more established
bond markets than other regions (along with sufficiently robust statistics that can be used for analysis).
They are also the largest markets, accounting for 76% or USD 74 trillion of the global debt securities
markets valued at 97 trillion in 2014. Debt securities outstanding from all sectors (government, corporate,
municipal, ABS, etc.) amounted to USD 39 trillion in the US, USD 21 trillion in the EU, USD 9.7 trillion
in Japan and USD 4.3 trillion in China. 10 New (gross) debt securities issuances in 2014 amounted to USD
19 trillion in these markets. 11
8
If sufficiently granular data and assumptions were to be made available, the framework constructed for the purposes
of this analysis could in theory be applied to these other sectors as well.
9
With increasingly clearer understandings of the economic benefits of the green label being applied to bonds (as
discussed in OECD/ICMA/CBI/China GFC (2016), it may be reasonable to assume that the percentage of bonds
labelled as green would increase in the future. For example, recent public sector-led efforts to grow a green labelled
bond market in China and India suggest that in those markets, at the very least, the percentage of bonds potentially
eligible for carrying a green label will be higher in the future than at present.
10
By the end of 2015, outstanding bonds in China amounted to RMB 47.9tn (USD 7.4tn). Gross bond issuance in
China in 2015 amounted to USD 3.4tn. Source: PBOC
11
Gross issuance. OECD analysis based on IEA (2014, 2012), Climate Bonds Initiative (2015), BIS (2015), SIFMA
(2015), ECB (2015), JSRI (2015), ADB (2015) and Goldman Sachs (2015).
9Table 1.1. Annual investment needs for renewable energy, energy efficiency in buildings and low-emission
vehicles in a 2DS compared to global all energy sector needs (2015-2035, 2012 USD)
2015-2020 (1) 2021-2025 2026-2030 2031-2035
RE, EE and LEV
investment needs
in 4 markets 573 bn 1 315 bn 1 264 bn 2 262 bn
(China, EU, Japan
& US)
All global
investment needs
for energy supply 839 bn 2 230 bn 2 404 bn 4 340 bn
and energy
efficiency
Share 68% 59% 53% 52%
Note: (1) Figures are annualised over the five year periods.
Source: OECD analysis based on IEA (2014, 2012)
1.4. Methodology
In its World Energy Investment Outlook (2014) and Energy Technology Perspectives (2012), the
IEA estimated investment needs in the renewable energy, energy efficiency and LEV sectors to 2035,
based on scenarios in which countries take policy actions leading to a 2oC emissions pathway. Building on
these investment scenarios, this analysis applies assumptions based on current trends in regional financial
markets to synthetically break down the aggregated investment needs by source of finance and type of
financial instrument (See Annex 1.A for methodology and assumptions). Figure 1.1 shows the steps of the
decomposition and the main issues addressed in each step.
10Figure 1.1. Flow diagram showing steps taken in developing a quantitative model and analytical framework
• classify investment needs by sectors and regions
• use technology and project profile to classify as needing public, private, multilateral finance
• determine projects' life-cycle, risk-return profile (technology maturity, competition, policy and supporting
Investment measures (FiT and PPA)
need • determine projects’ possible capital structure under different scenarios
• determine debt finance from capital structure identified above
• determine portion which can be refinanced by debt across project life cycle
Debt finance • determine refinancing and restructuring needs
• identify scope for bond issuance (new finance and refinance) by type (Corporate, Project, SSA, ABS, etc.)
• use past trends and potential future policy developments to derive scenarios by bond type
• use average green bond market maturity profile by type of bonds to derive recycled and new injection of funds
Bond Market into market needed each year
• analyse needs of IIs in the context of expanding low-carbon bond investment opportunities
• assess outstanding low-carbon figures relative to portfolio allocations
Implications
for II asset
allocation
Note: FiT = feed in tariff, PPA = power purchase agreement, II = institutional investors
The input data for the scenarios discussed in this report relate to investment needs and capital
structure (i.e. the shares of debt and equity needed, by sector and country). The investment data and
decomposition by sector were provided by the IEA. A matching set of global assumptions were made (e.g.
the split between utility scale and rooftop solar PV) and were referenced from a wide variety of public
sources. These assumptions are set forth in Annex 1.A. The estimates presented here are a function of the
assumptions made, and are subject to significant uncertainty around policy, current commercial and
financial practice and future changes in these practices (Box 1.1). By setting forth these assumptions in a
transparent manner, the analysis allows for close scrutiny and hopefully improved calibration of the model
as updated assumptions become available.
The scenarios in this report are based on the results of quantitative modelling. The modelling
translates existing investment projections into types of financial structure, segmenting the results into
selected regional and sectoral markets, and takes into account the suitability of financial structures for
assets of different risk profiles over the asset’s life from development and construction through to
operation (Figure 1.2). It is assumed that market actors will seek to optimise the capital structure and asset
financing methods (and thereby minimise the cost of capital for their investments) wherever possible in
line with prevailing and expected market circumstances and other economic variables that influence such
decisions.
11Figure 1.2. The phases of asset development at individual and market level
Box 1.1. Methodology
As detailed in Annex 1.A, models were constructed for the 4 geographic markets and assumption based
scenarios were run to generate the output data. Input data and assumptions for the scenarios relate to investment
need and capital structure. Data from current trends in regional financial markets are used to establish benchmark
levels of leverage (measured as debt to equity ratios) and proportions of bond finance, by type, and for each
investment class. The investment data and decomposition by sector are all provided by the IEA.
When a level of disaggregation proved insufficient, it was supplemented through a set of global assumptions,
e.g. the split between utility scale and rooftop photovoltaics (PV), drawn from a range of sources (see Annex and
References). Where data were unavailable, assumptions were constructed to simulate values and a sensitivity
analysis was performed to determine the impact of these assumptions on key model outputs, then validated through
consultation with market and industry experts. Consultation and sensitivity analysis of the variables and assumptions
is ongoing and the OECD welcomes expert interest and input.
There are three principal areas of uncertainty in these scenario estimates. First, uncertainty lies in the strength
and mix of support policy that will be adopted and the evolution of technology and performance costs.
Second, uncertainty exists in current data on financial structures and sources of finance. Some markets are
better documented than others. Securities regulations generally require that public market transactions be thoroughly
and publicly documented – and therefore easier to analyse. However, a substantial portion of financial market
transactions are private or un-listed and have limited disclosure of deal specifics. In these cases, third party market
analysis is the only option, rather than primary audited financial reports.
Third, financial practices may change. Although traditional financing structures may well continue, waves of
financial innovation are often driven by changes in regulation, market preferences, corporate balance sheets, tax
structures, financial crises and other factors. The types of financial structures deployed may be profoundly affected by
such market shifts. For instance, China’s debt markets have been characterised by banks providing significant lending
to state-owned enterprises. These markets have experienced challenges and the financial system is undergoing
significant change. As such, there are significant uncertainties regarding the future role of bond financing for low-
carbon infrastructure. At the same time, the government has prioritised the development of green bond markets
(UNEP, 2015).
12Two main scenarios were modelled and are presented in this analysis and in the Annexes, with
both assuming that the world is on a 2DS pathway: 1) A base-case scenario that uses conservative asset
securitisation assumptions (projecting levels observed in the market in 2015 forwards); and 2) a scenario
with a 10% increase in asset securitisation rate across all sectors (which represents a low-end growth
assumption that could be achieved through basic policy and market enablers targeted at securitisation).
Both main scenarios assume policy makers adopt supportive policies to overcome challenges as described
by the OECD (2016, forthcoming) and in OECD/ICMA/CBI/China GFC (2016).
Figure 1.3 illustrates a further range of possible scenarios not described in the report. The green
line illustrating the market growth potential represents the enhanced securitisation scenario 2, and
represents a theoretical upper limit for the base case of low-carbon bonds outstanding in the sectors
modelled if the world is on a 2DS, given capital structures and investment needs. The other coloured lines
illustrate, over a 10 year period, the speed at which the theoretical potential might be reached, depending
on how the bond market develops. If there is a concerted push in China, the EU, Japan and the US to
develop a low-carbon bond market, the growth rate over the first five years could be in the region of 100 to
200%. The historical growth of other bond markets suggests that there is a catalytic element embedded in
market growth, whereby successively deeper and more liquid markets serve to further accelerate growth.
On the other hand, if the policy and regulatory environment is not conducive to rapid market
growth, actual low-carbon bond issuance will fall behind its potential and may never reach it, as growth
path 1 illustrates. If governments do not set policies to drive a transition to a low-carbon economy or 2DS,
bond financing, as a function of the level of low-carbon infrastructure deployment, would be even lower
still. While policies enabling the use of bonds to finance renewable energy, energy efficiency in buildings
and LEVs are important, they do not drive demand for investment. Fundamental drivers of investment
include targets and support measures, carbon pricing, inefficient fossil fuel subsidy removal and reform,
research, development and demonstration policies and other actions to facilitate investment in low-carbon
infrastructure. Debt will necessarily play an important role in the financing of this infrastructure
investment, and bonds could potentially make up an important portion of this debt. Ultimately, however,
credible and consistent energy and climate policy and the economics of the sectors will be the drivers of
investment over the next 20 years.
13Figure 1.3. Illustration of scenarios for how the low-carbon bond market could evolve
1,600
Total amount outstanding ($bn)
1,400
1,200
1,000
800
600
400
200
0
2015 2016 2017 2018 2019 2020 2021 2022 2023 2024 2025
Growth path 1 Growth path 2 Growth path 3
Growth path 4 Growth path 5 GB market potential
Note: Chart ends at 2025 to highlight possible evolutionary pathways in earlier years. Growth paths 1-5 are illustrative.
2. High level quantitative results
2.1. Debt to equity breakdown
Figure 1.4 shows how total investment needs are financed in the baseline scenario, which takes
current financing practices for the sectors studies and projects them forward. Debt (lending) is seen as
covering 60% of total investment needs between 2015 and 2025, while this ratio decreases to 56% in 2030
and 52% in 2035. The mix of financing types ranges significantly across the types of assets, and changes
over time and is driven by increasing sectoral investment needs as technologies mature, for renewable
energy but more significantly for LEVs which represent a disproportionately large share of future
investment needs post-2025, according to the IEA (2015). 12
Current trends in financing asset and durable consumption purchases show that a significant
proportion of energy efficiency, distributed solar PV and LEV investment is done through consumer
finance (i.e. loans provided to consumers by commercial banks and leases) or equity (i.e. “self-finance”,
such as an LEV purchased in cash without any financing). Assuming that this continues to be the case, and
given the large size of LEV and energy efficiency investment needs relative to renewables, equity and self-
finance are estimated to continue to make a large contribution to financing low-carbon energy investment.
12
Due to the skew in investment needs caused by the dominance of the LEV sector in IEA figures and in these
composite results, these investment needs may appear to diverge from some recent Chinese estimates for overall
green investment (e.g. CCICED, 2015) which show that needs will peak in the next 5-15 years, and may decline after
2030. Further comparisons of LEV sector assumptions would be useful to undertake here in this respect.
14Figure 1.4. Synthetic investment breakdown for the IEA 2DS by type of finance needed to 2035 (annual basis,
USD 2012)
Source: OECD analysis based on IEA (2014, 2012)
Note: Financial sector bonds that raise proceeds for on-lending not shown but represented in loan figures
The role of bonds in financing investment depends on the maturity of the technology, the
characteristics of the projects including the scale at project level, as well as the type of investor. The
scenarios break down the IEA’s aggregate investment figures by type of asset (Figure 1.5). The use of debt
to finance LEV and EE is around 50%, with a much higher proportion (around 75%) seen in the renewable
energy sector. Bonds, as a form of debt capital, will therefore be able to play a more prominent role
proportion-wise for renewable energy than for low-emission vehicles and energy efficiency. However, due
to the sheer scale of financing needed, the USD figure for debt (and bonds) issued to finance LEV and EE
is seen as significantly higher.
A large proportion of the investment needs in EE is estimated by the IEA to be needed for
lighting and appliances. The IEA estimates that up to 60% of global investment needs in transport,
buildings and industry-related EE will be self-financed (with cash). LEVs will also be financed largely by
internal sources of finance, especially in China where car purchases by household and businesses do not
materially rely on external finance. 13 Only 30% of the investment needs in LEVs by households in China
are estimated to be financed through capital markets.
13
Without more granular precision on the future evolution in China, a conservative assumption is used.
15Figure 1.5. The mix of equity, loans and bonds vary across sector and by timeframe
Note: Financial sector bonds that raise proceeds for on-lending not shown but represented in loan figures. See Table 1.1 for the
drivers of investment levels and investment needs as defined by the IEA (2014, 2012)
2.2. High level results in context
After having examined the aggregate debt, bond and equity proportions implied by the
investment needs, the work then considers the types of debt instruments and bonds that would be suitable
for each type of asset. The results of the analysis suggest that by 2035 in a 2DS, bonds financing and re-
financing the three sectors in the four markets studied have the potential to scale to as much as USD 4.7-
5.6 trillion in outstanding securities globally and USD 620-720 billion in annual issuance with the ranges
representing a base-case “low securitisation” scenario and a “enhanced securitisation” scenario,
respectively (Figure 1.6). 14 While these figures may seem large on an absolute basis, they are small
(approximately 4%) relative to the scale of issuance in debt securities markets generally with USD 19
trillion of gross issuance in China, the EU, Japan and the US in 2014. 15
14
Note that while the model generates results down to the decimal place as a result of its calibrations, figures are
rounded up in the discursive analysis to reflect the inherent uncertainties commensurate with technological, product
and financial market evolutions over the next 20 years.
15
OECD analysis based on data from BIS, SIFMA, ECB, JSRI, ADB and Goldman Sachs.
16Figure 1.6. Scenario results to 2035 compared with low-carbon investment needs and new debt securities
issuance (USD, annual)
USD 19 tn
2014 total bond issuance
Region: China, Japan, EU, US
USD 2.26 tn
2035 annual low-carbon investment needs
Region: China, Japan, EU, US
USD 1.16 tn
2035 annual low-carbon debt financing needs
Region: China, Japan, EU, US
USD 720 bn
2035 annual low-carbon bond
issuance potential
USD 623 bn (high securitisation scenario)
2035 annual low-carbon bond issuance potential
(baseline scenario)
USD 42 bn Region: China, Japan, EU, US
2015 green bond issuance
Region: Global
Note: OECD modelling scenarios and annual “low-carbon” investment needs in figure cover the renewable energy, energy efficiency
and low-emissions vehicle sectors as estimated by the IEA (2014, 2012). The 2015 green bond issuance figure of USD 42 bn is
provided as a reference point and extends to all sectors included in Climate Bonds Initiative database. No judgement is made as to
the percentage of bonds from these “low-carbon” sectors that will be labelled as “green bonds”. Annual total bond issuance is
provided as an illustration and just as with green bond issuance, reflects “gross issuance” figures i.e. does not account for those
securities that reach maturity or are redeemed from previous years (termed “net issuance”). It includes other types of debt securities
such as notes and money market instruments.
Source: OECD analysis based on IEA (2014, 2012), Climate Bonds Initiative (2015), BIS (2015), SIFMA (2015), ECB (2015), JSRI
(2015), ADB (2015) and Goldman Sachs (2015).
The analysis suggests that the 2020s have the potential to be the start of the “golden years” for
bond issuance in the low-carbon sectors. As low-carbon technologies mature, they become more familiar
to bond markets which will be substantial contributors to the financing and re-financing of new-build
assets. The two main scenarios presented in Figure 1.6 represent the aforementioned baseline scenario and
a “enhanced securitisation” scenario with a 10% increase in ABS-type bonds issued indicated by error bars
in Figure 1.7 which shows issuance and outstanding bonds. The latter scenario is useful to consider
because it could occur if certain policies targeted at enhancing securitisation markets (as discussed in
OECD 2016, forthcoming) are adopted beyond those in the core scenario.
17Figure 1.7. Potential for low-carbon bond issuance ranges between USD 620 billion and USD 720 billion per
year by 2035
5,500
Annual bond issuance in four
bonds outstanding in four regions
1,900
4,500 1,700
1,500
regions ($bn)
3,500
1,300
2,500 1,100
($bn)
900
1,500 700
500
500
300
-500 100
2015
2016
2017
2018
2019
2020
2021
2022
2023
2024
2025
2026
2027
2028
2029
2030
2031
2032
2033
2034
2035
Amount outstanding Issuance
Note: Error bars represent the enhanced securitisation scenario, based on a 10% increase in asset securitisation rate across all
sectors over the baseline scenario, which incorporates a more conservative asset securitisation assumption. “Outstanding” refers to
cumulative amount of bonds issued that have not yet reached redemption or maturity.
As the risks of assets fall, as policy stabilises, and as the capital markets become more familiar
with the low-carbon sector, the role played by bonds could expand rapidly as demonstrated by historical
precedent throughout the traditional energy and infrastructure sectors (Dewar, 2011). 16 Figure 1.8 exhibits
the potential for different types of bond to finance a range of sectors and sub-sectors of low-carbon
investments studied. It displays a picture of the volume of outstanding securities through to 2035 and the
speed at which they could potentially scale up.
16
As described by Dewar (2011), accessing the capital markets to fund projects and infrastructure arguably dates to
the 1800s with the US railroad expansion. The first modern private sector project bond offerings date to the 1980s and
early 1990s, encouraged in part by changes in the US securities regulatory regime that facilitated bond offerings to
institutional investors. The first wave of project bonds financed or re-financed independent power projects and
quickly evolved to a broad range of electric, oil and gas, water and other power-related assets; as well as toll roads,
railways, and eventually social infrastructure such as hospitals, schools and prisons.
18Figure 1.8. Potential and speed of scale-up for bonds outstanding varies by type of bond, sector and sub-
sector (Baseline scenario, USD bn)
Note: “Outstanding” refers to cumulative amount of bonds issued that have not yet reached redemption or maturity. Shades of green
do not represent uniform values and are illustrations of magnitude of outstanding bonds as a share of the 2035 total for a particular
sector and type of bond.
193. Results by type of bond 17
3.1. Financial Sector Bonds
The results shown in Figures 1.4 and 1.5 reveal the prominent role loans can play in financing
low-carbon investment needs to 2035. Financial institutions (including banks and non-bank intermediaries)
are expected to continue to be the largest provider of loans to all three sectors given their specific expertise
in the arranging of credit for the earlier stages of infrastructure development project cycle, from planning,
to construction through to project operation, when other sources of debt capital including bond markets can
be called on to re-finance the debt. While financial institutions have a major role to play in arranging the
debt financing for low-carbon infrastructure through loans and through underwriting and investing in
bonds, they notably also can act as issuers of “financial sector” bonds as is shown in Figures 1.9-1.12.
Financial institutions rely to a large extent on bonds to raise capital for their lending activities,
with US and EU commercial banks currently maintaining a bond to loan ratio of 30% (McKinsey, 2015a;
ECB, 2015). Commercial banks are among the most active and prominent users of bonds markets to raise
capital for their lending activities. In the US and EU, 42% and 48% respectively of outstanding debt
securities had been issued by financial institutions in 2014 (McKinsey, 2015a; ECB, 2015).
Financial institutions are expected to continue to use bond markets to raise capital to finance their
low-carbon related lending, which can lead to financial sector issuance of bonds that finance this on-
balance sheet lending (referred to as “on-lending”). An example of this type of bond in the market today is
ABN AMRO’s EUR 500 green bond issued in 2015 where the proceeds are used to finance and re-finance
“Green Loans” that finance solar panels installed on residential buildings as well as commercial real estate
loans for the construction and financing of energy-efficiency buildings.
Unlike ABS and Collateralised Loan Obligations (CLOs), bonds issued by bank treasuries will
not be directly backed by green assets. However, as is seen in the case of “use of proceeds” 18 corporate
bonds, a link can be established between the capital raised by a bond and how it is put to use in financing
low-carbon investment. Figure 1.9 shows a scenario for bond issuance by the financial sector, keeping
assumptions based on the market today constant, and the corresponding amount in outstanding bonds
issued by financial institutions between 2015 and 2035. This segment of the market has the potential to add
up to USD 1 trillion to total bonds outstanding in 2025 and USD 1.7 trillion in 2035 (out of a market of
USD 4-5 trillion).
17
Note that while the model generates results down to the decimal place as a result of its calibrations, figures are
rounded up in the discursive analysis to reflect the inherent uncertainties commensurate with technological, product
and financial market evolutions over the next 20 years.
18
As defined by the Green Bond Principles: www.icmagroup.org/Regulatory-Policy-and-Market-Practice/green-
bonds/green-bond-principles/.
20Figure 1.9. Bonds issued by the financial sector exhibit significant potential to scale
250 1,800
sectorGB
outstandingGB
1,600
institutions
institutions
($bn)
200 1,400
yearly issuance ($bn)
of financial
1,200
amount outstanding
150
bn)
1,000
bonds
($ bn)
financial
financial
($
800
100
bonds
Financial sector
Annual issuance
600
400
Secondary
50
Secondary
200
0 0
Issuance Amount outstanding
Note: Financial sector issuance of bonds assumes a bond to loan ratio of 30% in all modelled markets
Figure 1.10 presents a complete view of how almost USD 2.3 trillion of annual low-carbon
investment needs in the sectors and markets studied in the period 2031-2035 could be financed. In order to
distinguish between bonds which directly finance and re-finance investment needs (i.e. projects) from
financial sector bonds which fund bank loans for projects, the figures for financial sector issuance are
presented separately from other bonds and as a derivative of loans.
Figure 1.10. Financing in 2035 by type of capital and bond (baseline scenario)
2,500
29 18 43 27
issuance from 2031 to 2035 ($bn)
Investment, financing and bonds
275
2,000 392 231 623
↑ Non-financial sector Bonds
1,500 769
2,262
1,000
500 1,101
0
Note: CLO: Collateralised Loan Obligation. Bonds coloured in green and financial sector bonds appear after loans to reflect issuance
that finances on-lending via banks.
213.2. Asset Backed Securities
Revitalising the concept of securitisation, which was tarnished during the 2008-2010 financial
crisis, is important to the scaling up of low-carbon infrastructure finance and has emerged as a key area of
focus for policy makers (IMF, 2015). A healthy market for securitisation can deliver significant financial
benefits 19, and efforts by policy makers geared at mitigating risks and ensuring that securitisation markets
contribute to economic growth and financial stability is recognised and underway under the EU’s Capital
Markets Union Action Plan 20 as well as in the US through the Solar Access to Public Capital Initiative 21
and elsewhere, including in China (EC, 2016; CBI/LSE, 2015; U.S. DOE/NREL, 2015; IMF, 2015). This
revitalisation can be achieved in large measure by standardising the assets and by making the process, and
the market activity it spurs, safer, simpler and more transparent. Any efforts to support green securitisation
must be undertaken in a prudent, judicious and transparent manner so that ABS markets emerge with
integrity and with due consideration for any financial stability issues.
There is potential for a significant expansion in the origination and subsequent issuance of ABS
as perceived risks fall. Standardisation of projects and policy support can enable pooling of individual
loans to occur, which effectively ties bonds to a group of assets, rather than individual assets. Compared to
project bonds that generally back individual projects (or collections of larger scale assets concentrated in
wind and solar “farms”), ABS are more efficient vehicles for aggregating pools of individual loans.
19
From a high level perspective, as a means of efficiently channelling financial and economic resources,
securitisation supports economic growth and financial stability by enabling issuers and investors to diversify risk. By
opening up new avenues for raising capital, securitisation can aid in diversifying the funding base of the economy.
Securitisation can also help free up bank capital, which in theory allows banks to extend new credit to the economy.
Source: IMF (2015)
20
For instance, the European Commission’s Securitisation Regulation will apply to all securitisations in the EU and
include due diligence, risk retention and transparency rules together with the criteria for Simple, Transparent and
Standardised (“STS”) Securitisations. This is accompanied by a proposal to amend the EU Capital Requirements
Regulation to make the capital treatment of securitisations for banks and investment firms more risk-sensitive and
able to reflect properly the specific features of STS securitisations.
21
The U.S. National Renewable Energy Laboratory (NREL) Solar Access to Public Capital (SAPC) working group
was designed to open capital market investment for solar assets via securitization and other financial innovations.
SAPC was a three-year initiative that ended in September 2015. SAPC membership included over 440 organizations
such as top residential and commercial solar developers, law firms, investment banks and capital managers, rating
agencies, independent engineers, and other key stakeholders in the solar finance space.
22You can also read