Analysis of hold-up and grinding pressure in a spiral jet mill using CFD-DEM
←
→
Page content transcription
If your browser does not render page correctly, please read the page content below
EPJ Web of Conferences 249, 12004 (2021) https://doi.org/10.1051/epjconf/202124912004
Powders and Grains 2021
Analysis of hold-up and grinding pressure in a spiral jet mill
using CFD-DEM
Lewis Scott, Antonia Borissova, Alan Burns and Mojtaba Ghadiri*
School of Chemical and Process Engineering, The University of Leeds, UK
Abstract. A spiral jet mill was simulated using Discrete Element Method modelling and Computational
Fluid Dynamics. The particle behaviour and fluid motion were analysed as a function of hold-up and
grinding pressure. Particle collision energy was predicted to be prevalent along the bed surface and in front
of the grinding jets, as shown through the collision data recorded. The bed itself affects the fluid flow field,
as momentum is transferred to the particles. Increasing the grinding pressure does not result in a proportional
increase in the kinetic energy of the particle system, as the high pressure jets begin to penetrate the bed with
greater ease. The particle bed moves as ‘plug-flow’, with the layers of the bed closest to chamber wall.
1 Introduction as a parameter. MacDonald et al. [12] derived a series of
analytical equations, which included hold-up, to also
The spiral jet mill is the equipment of choice in many predict the product cut-size. Luczak [13] and Luczak et
industries that require fine powders. The mill has no al. [2] analysed the particle flow patterns as a function
moving parts, which minimise both contamination and of grinding pressure using particle velocimetry. They
maintenance. Particle breakage in the mill is found that size reduction intensity is prevalent in the top
autogenous, as it is the result of inter-particle and layer of the particle bed; also shown by Scott et al [3]
particle-wall collisions. A series of jets angled around using CFD-DEM simulations. However, they also
the wall of the milling chamber form an internal vortex, showed grinding is prevalent on the frontside of the jet
which accelerates the particles around the chamber [1]. (relative to the particle), something in contrast to Kürten
The particles then escape through an opening at the and Rumpf [14], but in agreement with Scott et al [3].
centre of the mill, once they have sufficiently decreased CFD-DEM simulations of the spiral jet mill have
in size. Due to particle breakage and size classification been limited in the past due to computational power
occurring within the same chamber, subtle changes in required [11,15–17]. Rodnianski et al. [18] and Bnà et
either will alter both the fluid flow field and particle al [19] used CFD-only and one-way coupled CFD-DEM
behaviour. to simulated the mill, respectively. However, unlike
During operation of the mill, a particle bed forms two-way coupling, or higher order schemes, one-way
around the outer wall of the milling chamber due to the coupling and CFD-only simulations are unable to
centrifugal action induced by the grinding jets. High capture the dampening effect of the particle bed on the
strain rates are experienced by the particles, as the layers fluid flow field.
of the bed shear across one another [2]. Particles also Here, the spiral jet mill is studied using a four-way
experience high collisional energies, as they are ejected coupled CFD-DEM scheme [20–23] to analyse the
from the bed and impact on return [3]. Therefore, effect of grinding pressure and hold-up on particle
particle size reduction is the result of both chipping and behaviour and the fluid flow field. The basis for the mill
fragmentation in the mill [4]. is the Hosokawa Micron AS-50 (Runcorn, UK).
Grinding conditions in the spiral jet mill have been
extensively studied, with the consensus agreeing that
particle feed rate and grinding pressure are the two most 2 Method
influential parameters [1,5–9]. In general, increasing the
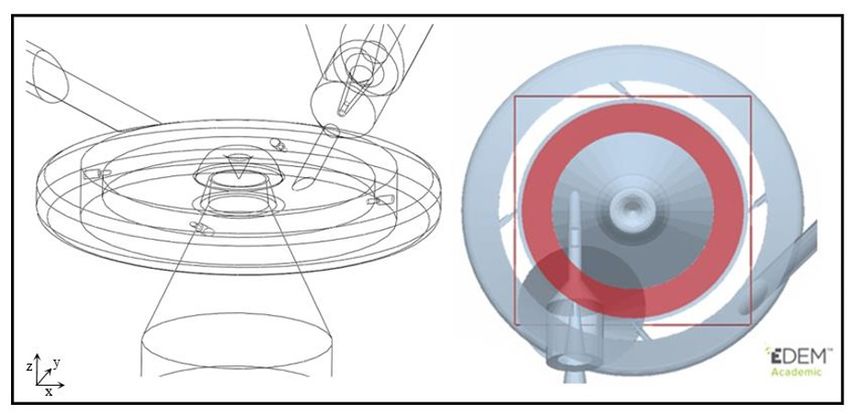
Using CAD, an in-house Hosokawa Micron AS-50 was
grinding pressure results in a finer particle size,
drawn, as shown in Figure 1. The drawing included both
however, the final product size does not scale
the annular manifold and the hopper section to improve
proportionally with pressure [10]. Small decreases in the
the fluid flow field calculation. The red box defines the
grinding pressure during operation can widen the
simulation domain in EDEMTM and encapsulates the
product size distribution, whereas significantly reducing
entire volume of the milling chamber, including the
the grinding pressure will destabilise the internal vortex
vortex finder. The milling chamber is 50 mm in diameter
[6,11]. Müller et al. [6] investigated the role of hold-up
with four equally spaced, angled jets to induce the
and residence time using a radioactive tracer. They
vortex. EDEMTM (Altair, UK) was used to calculate the
found that hold-up decreased as grinding pressure was
particle behaviour and FLUENT 18.1 (ANSYS, USA)
increased and derived a cut-size function with hold-up
was used to predict the fluid flow field.
*Corresponding author: M.Ghadiri@leeds.ac.uk
A video is available at https://doi.org/10.48448/np26-0710
© The Authors, published by EDP Sciences. This is an open access article distributed under the terms of the Creative Commons Attribution License 4.0
(http://creativecommons.org/licenses/by/4.0/).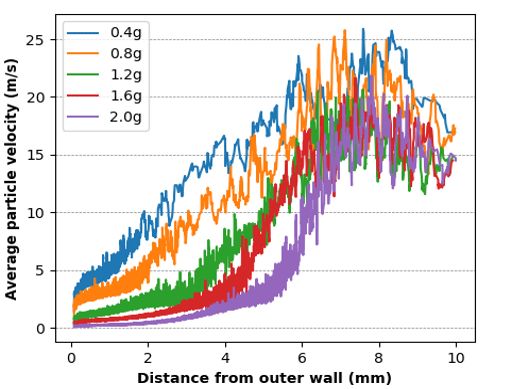
EPJ Web of Conferences 249, 12004 (2021)                                                     https://doi.org/10.1051/epjconf/202124912004
Powders and Grains 2021

      Fig 1: In-house drawing of the Hosokawa Micron AS-50 (left). Simulation domain in EDEM TM with simulation factory highlighted
      in red (right)

      The k-ε-RNG turbulence model and Morsi and                         required mass would be added within 0.01 s. A period
      Alexander drag model [24] were used in the simulation.             of time, around 0.03 s, was then allowed for the particle
      The settings for mass loadings and fluid conditions are            bed to reach a pseudo-steady-state. After this time, there
      given in Tables 1 & 2. The particle parameters are given           is no significant variation in the total kinetic energy of
      in Table 3. Hertz-Mindlin contact model was used                   the particle system. Collisional and velocity data were
      throughout. A four-way coupled scheme adopted to                   then recorded, up until 0.1 s when each simulation was
      capture all particle-fluid interactions; i.e. fluid damping        halted.
      and particle-particle collisions. In both studies, the
      particles were added directly into the chamber by way                          Table 2: Pressure study parameters
      of the particle factory highlighted in red. A mesh
      independence study was carried out prior to this study to           Fluid Feed
                                                                                             300          400         500        600
      determine the validity of the CFD mesh used. Following            Pressure (kPa)
      Norouzi et al. [25], a CFD time-step no larger than thirty           Grinding
                                                                                             200          300         400        500
      DEM time-steps was implemented. A DEM time-step                   Pressure (kPa)
      lower than 25% the Rayleigh’s time-step was also                      Mass
      maintained throughout each case.                                                                   Particle number
                                                                         Loading(g)
                                                                              0.4          61857       61869        61701      61884
                  Table 1: Hold-up study parameters
                                                                              0.8          123684      123481       123467     123404
             Mass loadings (g)           0.4, 0.8, 1.2, 1.6, 2.0              1.2          184576      184958       184796     184763
                                            300           20                  1.6          246368      246025       246248     245892
                                                                               2           310191      308539       307964     307393
        Particle diameter (μm) and          240           40
         size distribution (wt %)           200           20
                                                                              Table 3: Particle properties used in all simulations
                                            160           20
                                            0.4         54321             Particle parameters                             value
                                            0.8         111005            Density, kg/m3                                  1500
         Number loading for each                                          Shear modulus, MPa                               10
                                            1.2         168013
            mass loading (g)                                              Poisson’s ratio                                 0.25
                                            1.6         224206
                                                                          Coefficient of restitution                       0.5
                                            2.0         280366            Coefficient of static friction                   0.5
         Fluid feed pressure (kPa)                320                     Coefficient of rolling friction                 0.01
          Fluid grinding Pressure                  300                    DEM time step, µs                             0.4 – 1.0
                   (kPa)

                                                                         2.2 Pressure study
      2.1 Hold-up study                                                  A random particle size distribution in the range of 80 –
      Keeping the grinding pressure constant at 3 barg, the              200 µm was used. Each mass loading was then repeated
      mass of particles in the mill is increased for each case.          for the four absolute grinding pressures, i.e. 200, 300,
      The addition rate was set for each case, so that the               400, 500 kPa.

                                                                    2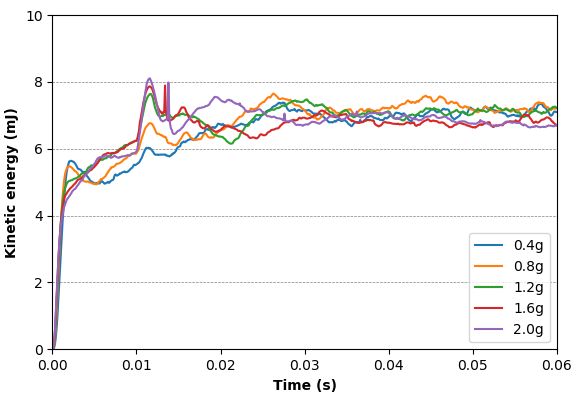
EPJ Web of Conferences 249, 12004 (2021)                                                     https://doi.org/10.1051/epjconf/202124912004
Powders and Grains 2021

      3 Results

      3.1 Hold-up Study Discussion

      3.1.1 Fluid field
      Three distinct regions developed in the milling chamber
      after the particle bed formed; a slow moving dense
      particle bed region and a lean phase fast moving region
      next to the classifier wall. As bed depth increased, the
      jet penetration depth decreased, due to dampening effect
      of the particles. It was also found that as mass loading
      increased, the velocity surrounding the classifier
      decreased. There was no direct dampening of the fluid
      flow field around the classifier, as the particles could not
      travel that far. Instead the fluid flow field was indirectly
      dampened by the presence of the bed, as more energy is                   Fig 3: Radial velocity profile from the outer wall
      transferred to accelerate the particles and stabilise the
      vortex.
                                                                         3.1.3 Particle collision intensity
      3.1.2 Particle behaviour
                                                                         As the mass loading increases within the mill, the
      The particles are added to the simulation with zero                overall power dissipated increases from 4.05 W to 4.65
      velocity. They then quickly form the particle bed, as              W. Particle collision frequency also increases. However,
      they accelerate around the chamber. It can be seen in              the average amount of energy dissipated during a
      Figure 2 that total energy of the particle systems reach a         collision decreases due to the reduced average particle
      similar asymptotic value of around 7 mJ. It remains                velocity. In agreement with the work of Luczak et al.
      unclear why this happens, however, the only source of              [2], the highest rate of energy dissipated occurs at the
      energy comes from the feed and grinding jets.                      bed surface where the rate of shearing is also at its
                                                                         highest. There is also a high rate of energy dissipation in
                                                                         front of the jets, as the particles collide due to the sudden
                                                                         change in direction.

                                                                         3.2 Pressure study
                                                                         As the pressure increases, the average particle velocity
                                                                         also increases and the particles closest to the bed surface
                                                                         shear at a higher rate. However, at the highest pressure,
                                                                         the particles closest to the wall in the 2.0 g case exhibit
                                                                         plug-flow behaviour. This is because the grinding jets
                                                                         penetrate through the bed with greater ease as pressure
                                                                         increases. The energy available to be transferred to the
                                                                         particles is therefore limited, as the air may only further
                                                                         transfer energy to the particles along the face of the bed
                                                                         before being directed out of the mill, due to the low
             Fig 2: Kinetic energy for each particle system
                                                                         downstream pressure.
          Overall, the highest particle velocity was recorded in             Due to the limited exchange of the energy with the
      the 0.4 g loading case. Compared to the other cases,               air, the kinetic energy of the system particle system does
      fewer particles are accelerated and collisions occur less          not increase proportionally with grinding pressure. This
      frequently. This allows the particles to achieve a higher          leads to the dissipated energy of the particle system to
      velocities for lower loadings. Figure 3 displays a radial          only increase from 0.17 mJ to 0.6 mJ, with an increase
      velocity profile of a single slice taken through the bed.          of grinding pressure from 3 barg to 6 barg; as shown in
      The profiles span from 0 – 10 mm from the chamber                  Figure 4. Ramanujam and Venkateswarlu [5] and
      wall and agree well with the experimental velocimetry              Kürten & Rumpf [10] report a similar relationship, as
      work of Luczak [2]. As the material in a bed increases,            they both noted that increasing pressure does not lead to
      the velocity gradient decreases first due to the presence          a proportional decrease in the final product size.
      of the bed before rapidly increasing. Interestingly, the           However, the under-utilisation of the fluid energy as the
      particles in the 1.6 g and 2.0 g cases display “plug-flow”         jets penetrates through the bed, provides a different
      behaviour close to the wall.                                       reasoning as to why both groups found this result.

                                                                     3
EPJ Web of Conferences 249, 12004 (2021) https://doi.org/10.1051/epjconf/202124912004
Powders and Grains 2021
Wilson, R. Storey, I. Crosley, EPJ Web Conf. 140,
7–10 (2017)
[5] M. Ramanujam, D. Venkateswarlu, Powder
Technol. 3, 92–101 (1969)
[6] F. Müller, R. Polke, G. Schädel, Int. J. Miner.
Process. 44–45, 315–326 (1996)
[7] S. Palaniandy, K.A.M. Azizli, H. Hussin, S.F.S.
Hashim, Miner. Eng. 21, 380–388 (2008)
[8] P. Nair, M. Ramanujam, Adv. Powder Technol. 3,
273–284 (1992)
[9] A. Katz, H. Kalman, Part. Part. Syst. Charact. 24,
332–338 (2007)
[10] H. Kürten, H. Rumpf, Chemie Ing. Tech. 38 331–
342 (1966)
[11] T. Brosh, H. Kalman, A. Levy, I. Peyron, F.
Ricard, Powder Technol. 257, 104–112 (2014)
Fig 4: Energy dissipated through particle collisions for the [12] R. MacDonald, D. Rowe, E. Martin, L. Gorringe,
1.2 g loading case
Powder Technol. 299, 26–40 (2016)
[13] B. Luczak, Flow Conditions inside Spiral Jet
4 Conclusions Mills and Impact on Grinding Performance
Dissertation Zur Erlangung Des Akademischen
Both hold-up and pressure effects were investigated in Grades Eines, Universitat Duisburg-Essen,
the spiral jet mill using a 4-way coupled CFD-DEM (2018)
simulation. The amount of material held in the mill [14] H. Kürten, H. Rumpf, Chemie Ing. Tech. 38,
indirectly influences the air velocity around the 1187–1192 (1966)
classifier, as kinetic energy is transferred to the particle [15] T. Han, H. Kalman, a. Levy, Part. Sci. Technol.
bed. High amounts of dissipated energy were recorded 20, 325–340 (2002)
along the bed surface and in front of the grinding jets, [16] S. Teng, P. Wang, Q. Zhang, C. Gogos, Powder
and therefore, a prevalent areas of the mill where Technol. 208, 684–693 (2011)
grinding is thought to take place. [17] S.C. Dogbe, Predictive Milling of Active
Increasing the particle mass leads to a reduction in Pharmaceutical Ingredients and Excipients, The
the average particle velocity. However, increasing the University of Leeds, (2017)
number of particles also leads to an increase in the [18] V. Rodnianski, N. Krakauer, K. Darwesh, A.
collision frequency, and therefore, the rate of energy Levy, H. Kalman, I. Peyron, F. Ricard, Powder
dissipation stays almost constant for a particular Technol. 243, 110–119 (2013)
grinding pressure. [19] S. Bnà, R. Ponzini, M. Cestari, C. Cavazzoni, C.
Increasing the grinding pressure leads to an increase Cottini, A. Benassi, Powder Technol. 364, 746–
in the kinetic energy and energy dissipated rate of the 773 (2020)
particle system. However, this increase does not scale [20] S. Elghobashi. Applied Scientific Research, 48,
proportional with pressure. It is concluded that the low 301-314 (1991)
increase in energy is due to the under-utilisation of the [21] Y. Tsuji, T. Kawaguchi, T. Tanaka, Powder
fluid energy available as the fluid jets penetrate through Technol. 77, 79–87 (1993)
the particle bed. [22] B.H. Xu, a. B. Yu, Chem. Eng. Sci. 52, 2785–
2809 (1997)
This project is supported by the Engineering and [23] A. Di Renzo, F.P. Di Maio, R. Girimonte, B.
Physical Sciences Research Council, UK, through the Formisani, Powder Technol. 184, 214–223
Centre of Doctoral Training for Complex Particulate (2008)
Products and Processes (CDT CP3) (EPSRC Grant [24] S.A. Morsi, A.J. Alexander, J. Fluid Mech. 55,
EP/L015285/1), which forms a part of the doctoral 193–208 (1972)
studies in collaboration with AstraZeneca Ltd. The [25] H. Norouzi, R. Zarghami, R. Sotudeh-Gharebagh,
authors gratefully acknowledge their support and would N. Mostoufi, Coupled CFD-DEM Modeling,
also like to especially thank Ian Gabbott and Catherine John Wiley & Sons, Chichester, (2016)
Hallam for their project co-ordination.
References
[1] R. Tuunila, L. Nyström, Miner. Eng. 11, 1089–
1094 (1998)
[2] B. Luczak, R. Müller, C. Kessel, M. Ulbricht, H.J.
Schultz, Powder Technol. 342, 108–117 (2019)
[3] L. Scott, A. Borissova, A. Burns, M. Ghadiri,
Powder Technol. 377, 233–243 (2021)
[4] S. Dogbe, M. Ghadiri, A. Hassanpour, C. Hare, D.
4You can also read