Annual Energy Outlook - AEO2023
←
→
Page content transcription
If your browser does not render page correctly, please read the page content below
Annual Energy
Outlook
AEO2023
The U.S. Energy Information Administration (EIA), the statistical and analytical agency within the
U.S. Department of Energy (DOE), prepared this report. By law, our data, analyses, and forecasts are
independent of approval by any other officer or employee of the U.S. Government. The views in this
report do not represent those of DOE or any other federal agencies.

U.S. Energy Information Administration | AEO2023 Narrative                                             i

March 2023

Table of Contents
Administrator’s Foreword ............................................................................................................. 1
Executive Summary ....................................................................................................................... 4
Introduction .................................................................................................................................. 7
The Electricity Mix in the United States Shifts from Fossil Fuels to Renewables ........................... 9
Technological Advancements and Electrification Decrease Demand-Side Energy Intensity ....... 14
International Demand for Petroleum and Natural Gas Drives U.S. Production, While Domestic
Consumption Either Grows Slowly or Decreases......................................................................... 22
Discussion ................................................................................................................................... 30
Appendix ..................................................................................................................................... 33

U.S. Energy Information Administration | AEO2023 Narrative                                                                                      ii
March 2023

Table of Figures
Figure 1. Total energy-related carbon dioxide emissions.............................................................. 8
Figure 2. U.S. electricity generation by select technologies for all cases ...................................... 9
Figure 3. Total installed capacity in all sectors, 2022 (history) and 2050 .................................... 10
Figure 4. Total renewable capacity in all sectors, 2022 (history) and 2050 ................................. 11
Figure 5. Hourly U.S. electricity generation and load by fuel for selected cases and
respresentative years .................................................................................................................. 12
Figure 6. U.S coal-fired electric generating capacity and U.S. coal disposition by demand sector
.................................................................................................................................................... 13
Figure 7. Total energy consumption by end-use sector .............................................................. 15
Figure 8. Residential delivered energy intensity and Commercial delivered energy intensity .... 16
Figure 9. Portion of U.S. steel produced via electric arc furnace and Iron and steel sector energy
intensity ...................................................................................................................................... 18
Figure 10. Light-duty vehicle average fuel economy and Market share of electric light-duty
vehicles ...................................................................................................................................... 19
Figure 11. Light-duty vehicle miles traveled and Light-duty vehicle energy demand.................. 21
Figure 12. Petroleum and other liquids consumption and Petroleum and other liquids
production .................................................................................................................................. 23
Figure 13. Petroleum products net exports and Gross crude oil imports ................................... 24
Figure 14. Natural gas consumption ........................................................................................... 25
Figure 15.Natual gas consumption in industrial sector and Natural gas consumption in electric
power sector ............................................................................................................................... 26
Figure 16. Dry natural gas production......................................................................................... 27
Figure 17. Liquified natural gas exports and Ratio of Brent crude oil price to natural gas price at
Henry Hub ................................................................................................................................... 28
Figure 18. Dry natural gas production, Gulf Coast and Southwest.............................................. 29
Figure 19. Dry natural gas production from shale resources ...................................................... 29
Figure 20. Total energy-related carbon dioxide emissions.......................................................... 32

U.S. Energy Information Administration | AEO2023 Narrative                                                                                           iii
March 2023

Administrator’s Foreword
After a 23-year hiatus, I am reintroducing the Administrator’s Foreword as part of the Annual Energy
Outlook (AEO). The Foreword affords me an opportunity to provide context and outline future directions
for one of our flagship products.

The U.S. energy system is rapidly changing. In recent years, technology innovation has accelerated the
deployment of renewable energy, expanded markets for electric vehicles, and established record-high
levels of petroleum and natural gas production. Heightened geopolitical risks have also influenced the
energy system. And this year, recent federal legislation authorizes historic levels of investment in clean
energy technology.

Ideally, we would model these dynamics to produce precise numerical forecasts that demonstrate how
energy prices, technology deployment, and emissions will shift over time. Unfortunately, such precise
forecasts are not possible. The 30-year decision landscape we model is too complex and uncertain. Thus,
our objective must be to identify robust insights rather than precise numbers—think ranges and trends,
not predictions and point estimates.

The AEO includes a series of projections—which we refer to as cases—each with different input
assumptions that represent alternative views of how uncertainty may be resolved in the future. The
Reference case represents our best guess under nominal conditions, which presumes no new policy or
laws over the modeled time horizon. It’s best to think of the Reference case as the experimental control:
a baseline against which we can judge the other cases. Although the Reference case serves as an
important benchmark, judgments about energy futures should never be based on a single projection.
The AEO side cases represent plausible variations in key input assumptions that tend to drive the largest
changes in projected outputs from the Reference case. This year’s AEO narrative focuses on the full set
of modeled cases in order to derive insights about our collective energy future.

Among the uncertainties we must confront, the timing, structure, and targets associated with yet-to-be-
developed policy are the most uncertain. We only consider current laws and regulations across all
modeled cases in this AEO. For some readers, this approach may be unsatisfying because policy rarely
remains static for long periods. But this AEO should be considered part of an iterative policymaking
process rather than apart from it; it gives decision-makers an opportunity to peer into a future without
new policy. If the projected outcomes are undesirable from their viewpoint, they can effect change.

Changes to This Year’s Edition
This year’s edition of the Annual Energy Outlook includes three enhancements that improve the
characterization of future uncertainty and provide more technical details on the model results.

U.S. Energy Information Administration | AEO2023 Narrative                                                   1
March 2023

Combination cases
Although the AEO core side cases address key uncertainties, each case represents a one-factor change
to the Reference case. But, real energy markets often surprise us in more ways than one, particularly
over the decades-long timeframes modeled in the AEO. In this year’s edition, we include cases that
combine assumptions from our macroeconomic and zero-carbon technology cost cases. These new
cases reflect a combination of demand-side changes (macroeconomic growth affecting energy demand)
and supply-side changes (renewables costs affecting generating capacity deployment) to expand the
range of projections in the Annual Energy Outlook.

Visualizing uncertainty
Running a set of cases is not enough: how we present and discuss them within the report affects the
insights that our readers draw from the analysis. Although the Reference case is an important
benchmark, each case represents a possible alternative. So, in each of the figures in this report, you will
see shaded areas that represent the range of results obtained across the modeled cases. Uncertainty
can be characterized in many other ways beyond the analysis of multiple cases. One way, presented in
the discussion section, uses deviations between realized and projected values drawn from previous AEO
editions to derive a cone of uncertainty for future energy-related CO2 emissions. Looking ahead, you
should expect to see more innovation in how we treat uncertainty.

Technical notes
The narrative tends to focus on model-based results. We recognize that some readers want a deeper
technical explanation around key issues. Although we describe our modeling approach elsewhere, how
the model formulation and input assumptions influence the results is not always clear. To better explain
key results, we included a series of technical notes in the narrative that focus on heat pump
deployment, cost projections for renewables, electric vehicle deployment, and crude oil trade.

Future Work
At EIA, we are also pursuing broader changes to our long-term modeling efforts. I would like to highlight
three such efforts.

Open-source code
One of our priorities at EIA is to make our data and model-based analysis as transparent and accessible
as possible. We are working to make the National Energy Modeling System (NEMS) publicly available in
GitHub under a permissive, open-source license, and we hope to complete this effort later this year.
Making our models open source allows users to examine, reuse, and redistribute our code under clear
legal guidelines. Giving you this kind of access is important to the learning and discovery process
associated with energy modeling.

Expanded scenario range
Building on the combination cases in this year’s AEO, we are expanding our capability to model a wider
range of future scenarios using NEMS. In particular, decision makers need objective and rigorous
assessments of net zero emissions pathways to inform ongoing policy discussions. We are working to
incorporate novel fuel and technology pathways into NEMS and to appropriately treat uncertainty
around technologies with limited commercial deployment.

U.S. Energy Information Administration | AEO2023 Narrative                                                2
March 2023

A next-generation, open-source modeling framework
Although regularly updated, we have been using NEMS to produce the AEO since 1994—a span of nearly
three decades that has born witness to significant changes in the real energy system, energy modeling
methods, and software development practices. Moving forward, we need a flexible, next-generation
modeling framework that can rapidly assess the cost, emissions, reliability, security, and community-
level impacts associated with a number of contemporary energy issues. Some of these issues include
pathways to a net-zero energy system, supply chain risks, rapid technology innovation, and shifting
trade patterns. This modeling system will also be open source to promote transparency and encourage
innovation within the modeling community. We’ve begun discussing this new framework, and I look
forward to sharing our progress throughout my tenure as EIA Administrator.

In Closing
I’d like to thank our long-term modelers for their willingness to take on new directions and their
tremendous effort to produce this year’s AEO. I am very excited by the future work outlined above, and I
feel privileged to help lead such a talented team of energy modelers.

U.S. Energy Information Administration | AEO2023 Narrative                                             3
March 2023

Executive Summary
Our Annual Energy Outlook 2023 (AEO2023) explores long-term energy trends in the United States.
Since last year’s AEO, much has changed, most notably the passage of the Inflation Reduction Act (IRA),
Public Law 117–169, which altered the policy landscape we use to develop our projections.

We project that U.S. energy-related CO2 emissions drop 25%
to 38% below the 2005 level by 2030. For reference, the                 Energy-related CO2
United States’ nationally determined contribution (NDC),
                                                                        emissions fall across all
submitted as part of the Paris Agreement, calls for a target
                                                                        AEO2023 cases because of
of 50% to 52% of net greenhouse gas emissions below the
                                                                        increased electrification,
2005 level by 2030. 1 We only consider energy-related CO2
emissions, which does not cover the full NDC scope. Total
                                                                        higher equipment
energy-related CO2 emissions in 2050 declined by 17% in                 efficiencies, and more
this year’s Reference case compared with last year’s. Some              zero-carbon electricity
of the primary factors that contributed to the change in our            generation.
base case include the IRA, updates to technology costs and
performance across the energy system, and changes in the
macroeconomic outlook. All AEO2023 cases assume current laws and regulations, and compared with
last year’s AEO, there is a significant shift toward lower future emissions. The IRA represents a complex
piece of legislation, and we could not model all provisions given model structure and uncertainty over
select implementation details. The appendix includes a detailed accounting of IRA provisions and how
we addressed them. To further explore possible emissions reductions, we also derive a cone of
uncertainty based on an empirical analysis of our past projections and find that the energy-related CO2
emissions reduction can be as high as 45% below 2005 levels in 2030.

Overall, our lower projected U.S. energy-related CO2 emissions is driven by increased electrification,
equipment efficiency, and renewable technologies for electricity generation. However, emissions
reductions are limited by longer-term growth in U.S. transportation and industrial activity. As a result,
these projected emissions reductions are most sensitive to our assumptions regarding economic growth
and the cost of zero-carbon generation technology.

1The nationally determined contribution (NDC) is a formal submission to the United Nations Framework Convention on Climate
Change. The United States submitted, “To achieve an economy-wide target of reducing its net greenhouse gas emissions by 50-
52 percent below 2005 levels in 2030.”

U.S. Energy Information Administration | AEO2023 Narrative                                                                4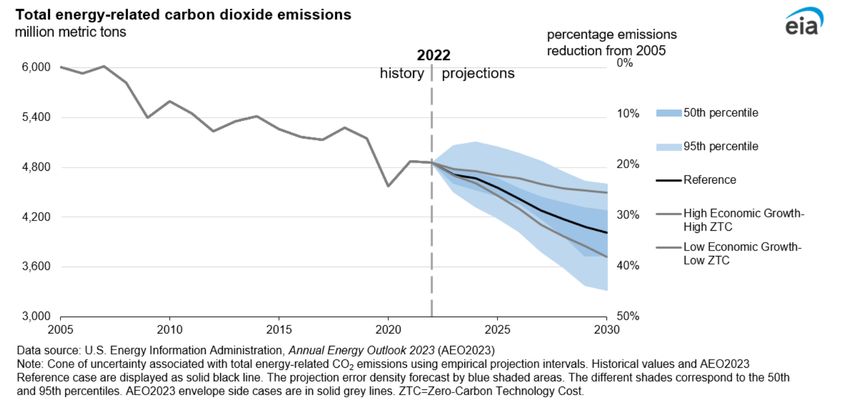
March 2023

 In AEO2023, we see stable growth in U.S. electric power demand through 2050 in all cases we
considered because of increasing electrification and ongoing economic growth. The combination of
declining capital costs and government subsidies,
including IRA initiatives, drive rising renewable                Renewable generating
technologies for electricity generation, such as solar           capacity grows in all regions
and wind. Once built and when the resource is                    of the United States in all
available, wind and solar are the least cost resources to        AEO2023 cases, supported by
operate to meet electricity demand because they have             growth in installed battery
zero fuel costs. Over time, the combined investment              capacity.
and operating cost advantage increases the share of
zero-carbon electricity generation. As a result, in
AEO2023, we see renewable generating capacity growing in all regions of the United States in all cases.
Across all cases, compared with 2022, solar generating capacity grows by about 325% to 1019% by 2050,
and wind generating capacity grows by about 138% to 235%. We see growth in installed battery capacity
in all cases to support this growth in renewables. Across the span of AEO cases, relative to 2022, natural
gas generating capacity ranges from an increase of between 20% to 87% through 2050.

                                        Not only is the U.S. electric power sector’s composition changing,
   Technological                        but we see increased electrification in the end-use sectors. We
   advancements and                     project more heat pumps and electric vehicles, as well as electric
   electrification drive                arc furnaces increasingly deployed in the iron and steel industry.
   projected decreases in               In the residential and commercial sectors, higher equipment
   demand-side energy                   efficiencies and stricter building codes extend ongoing declines in
   intensity.                           energy intensity. Despite the growth in adopting heat pumps,
                                        natural gas-fired heating equipment, including furnaces and
                                        boilers, continue to account for the largest share of energy
consumption for space heating in U.S. residential and commercial buildings across all cases through
2050. In the transportation sector, light-duty vehicle energy demand declines through 2045 as more
electric vehicles are deployed and stricter Corporate Average Fuel Economy (CAFE) standards largely
offset the continued growth in travel demand. The energy demand then increases as rising travel
overcomes increasing efficiency. Across all cases, light-duty vehicle energy demand decreases by 3% to
28% in 2050 relative to 2022.

U.S. Energy Information Administration | AEO2023 Narrative                                                5
March 2023

                                                             Despite no significant change in domestic petroleum and
                                                             other liquids consumption through 2040 across most
                                                             AEO2023 cases, we expect U.S. production to remain
     High international demand                               historically high as exports of finished products grow in
     leads to continued growth in                            response to growing international demand. Despite the
     U.S. production, and                                    shift toward renewable sources and batteries in
     combined with relatively                                electricity generation, domestic natural gas consumption
     little growth in domestic                               remains relatively stable—ending recent growth in most
     consumption, allows the                                 cases. Natural gas production, however, in some cases
     United States to remain a net                           continues to grow in response to international demand
                                                             for liquefied natural gas, supported by associated natural
     exporter of petroleum
                                                             gas produced along with crude oil. Given the combination
     products and natural gas
                                                             of relatively little growth in domestic consumption and
     through 2050 in all AEO2023
                                                             continued growth in production, we project that the
     cases.
                                                             United States will remain a net exporter of petroleum
                                                             products and natural gas through 2050 in all AEO2023
                                                             cases.

U.S. Energy Information Administration | AEO2023 Narrative                                                            6
March 2023 Introduction The Annual Energy Outlook 2023 (AEO2023) explores long-term energy trends in the United States. Since we released the last AEO in early 2022, passage of the Inflation Reduction Act (IRA), Public Law 117–169, altered the policy landscape we use to develop our projections. The Appendix in this report explains our assumptions around IRA implementation and how we implemented the IRA in our AEO2023 cases. We are also releasing a separate Issues in Focus paper that explores how these assumptions affect our model-based projections. We have seen significant national and international short-term market volatility associated with economic growth as the world reemerges from the COVID-19 pandemic and political instability associated with Russia’s full-scale invasion of Ukraine. We continuously monitor such developments and consider how they may affect our long-term projections. AEO2023 includes a Reference case and 12 side cases that explore key areas of uncertainty about how energy markets will develop. We retooled our graphs to emphasize the range of results, denoted by shaded areas, across the full suite of modeled cases. We derive our key analytical insights by assessing the results across cases and examining how overall trends may vary under different assumptions. This year, we’ve added a discussion section focused on sources of uncertainty in the AEO2023 projections. We also now derive a cone of uncertainty associated with future energy-related CO2 emissions using deviations between past projections and realized values. By 2030, energy-related CO2 emissions fall 25% to 38% below 2005 levels, depending on case assumptions Under the Paris Agreement, the United States set a goal to reduce economy-wide greenhouse gas emissions by 50% to 52% of 2005 levels by 2030. We only consider energy-related CO2 emissions, which does not cover the full NDC scope. We project lower U.S. energy-related CO2 emissions in 2030 relative to 2005 in the AEO2023 Reference case and all side cases (Figure 1). CO2 emissions are most sensitive to economic growth and assumptions related to the cost of zero-carbon generation technology. Combinations of these two sets of assumptions form the upper and lower bounds of projected CO2 emissions. Emissions decrease by 25% in 2030 relative to 2005 under the combined high economic growth and high zero-carbon technology cost assumptions and by as much as 38% under low economic growth and low zero-carbon technology cost assumptions. Both of these cases hinge on specific assumptions regarding the relationship between economic growth and zero-carbon technology development. 2 In the High Economic Growth case, emissions fall initially and then begin to increase 2 The purpose of the combination cases was to explore a wider range of outcomes. We did not explicitly consider the correlation or interaction between zero-carbon technology costs and economic growth. The High Economic Growth and High Zero-Carbon Technology Cost case assume this higher growth rate takes place without declining zero-carbon technology costs. Similarly, slower economic growth accompanies declining technology costs in the Low Economic Growth and Low Zero-Carbon Technology Cost case. U.S. Energy Information Administration | AEO2023 Narrative 7
March 2023

again in 2040 as industrial activity and travel (measured in vehicle miles traveled) increase, surpassing
emissions reductions from the electric power sector.

Figure 1.

The largest variations in projected U.S. CO2 emissions across cases occur in the electric power,
transportation, and industrial sectors. Although economic growth assumptions affect consumption and,
in turn, projected CO2 emissions in all sectors, different case-specific assumptions affect sectors
differently. For example, emissions from the electric power sector are particularly responsive to
assumptions about the cost of zero-carbon technologies, and transportation sector emissions are
sensitive to assumptions about fossil fuel supply and cost, particularly oil and petroleum products.

U.S. Energy Information Administration | AEO2023 Narrative                                                  8
March 2023
1
The Electricity Mix in the United
States Shifts from Fossil Fuels to
Renewables
In this section, we discuss renewables displacing fossil
fuels in the electric power sector.
Renewables displace fossil fuels in the
electric power sector due to declining
renewable technology costs and rising
subsidies for renewable power
Economic growth paired with increasing electrification
in end-use sectors results in stable growth in U.S.
electric power demand through 2050 in all cases.
Declining capital costs for solar panels, wind turbines,
and battery storage, as well as government subsidies
such as those included in the IRA, result in renewables
becoming increasingly cost effective compared with the
alternatives when building new power capacity.
Renewables are
Power demand increasingly meeting
power demand
is increasingly
throughout the projection period (Figure 2). Natural gas, coal, and nuclear
met by
generation shares decline. Renewable power outcompetes nuclear power,
renewables
even in the Low Zero-Carbon Technology Cost (ZTC) case, which evaluates
throughout the the impact of more aggressive cost declines for nuclear and renewables
projection than the Reference case. Most natural gas-fired generation comes from
period. combined-cycled power plants as opposed to simple-cycle combustion
turbines. Uncertainty in natural gas prices across cases leads to various
projections for combined-cycle units in the short term, but in the long
term, natural gas demand from the electric power sector stabilizes across
all cases.
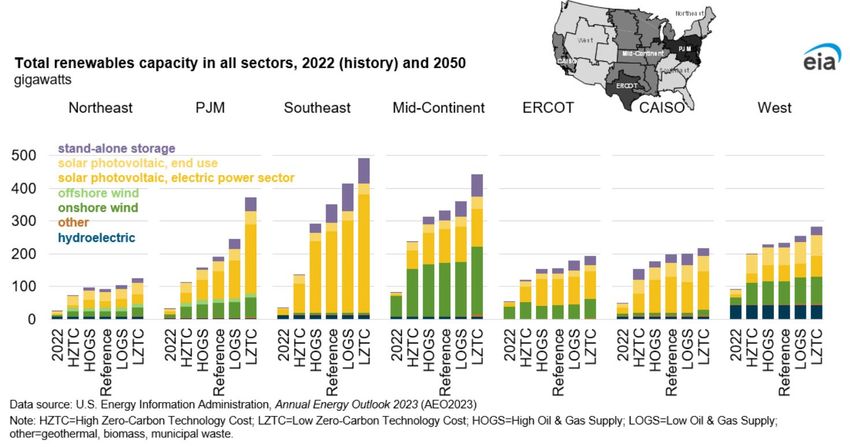
U.S. Energy Information Administration | AEO2023 Narrative 9March 2023 Figure 2. In order to meet increasing demand for electric power throughout the projection, total installed power capacity close to doubles across most cases, even in the Low Economic Growth case (Figure 3). Cases with a higher share of renewables in the generation mix have higher total grid capacity due to the inherently lower capacity factors of solar and wind compared with coal, nuclear, and combined-cycle plants. Figure 3. We project that renewable power capacity will increase in all regions of the United States in all AEO2023 cases, although regional resource availability results in varying renewable resource mixes across regions (Figure 4). Across all cases, between 40%-60% of the renewable power capacity in the Mid-Continent region in 2050 comes from wind, and the Southeast and the region managed by the California U.S. Energy Information Administration | AEO2023 Narrative 10
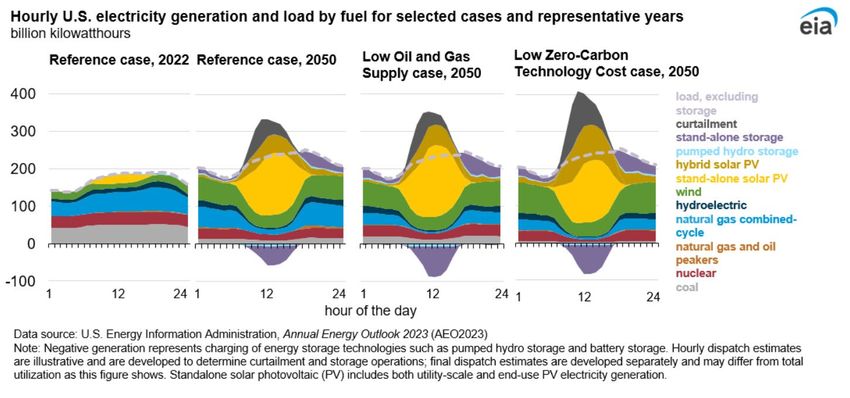
March 2023

Independent System Operator (CAISO) have large shares of solar and a small amount of wind power
capacity in all cases.

Figure 4.

Once built and when the resource is available, wind and solar generation outcompete other
technologies for system dispatch because they have zero fuel costs. Across all AEO2023 cases, some
renewable generation is left unused and curtailed, typically midday when solar generation can exceed
demand in some regions and seasons. Battery capacity is built in all cases to store and dispatch some of
this otherwise unused generation in later hours, decreasing reliance on fossil fuel capacity, such as
natural gas-fired peaking units or load-following combined-cycle units (Figure 5). Battery storage is also
used to replace natural gas-fired capacity to provide reserve capacity. In the Reference case in 2050, 160
gigawatts (GW) of standalone battery storage capacity will be deployed, and deployment varies
between 40 GW and 260 GW in the other cases.

U.S. Energy Information Administration | AEO2023 Narrative                                              11
March 2023
Figure 5.
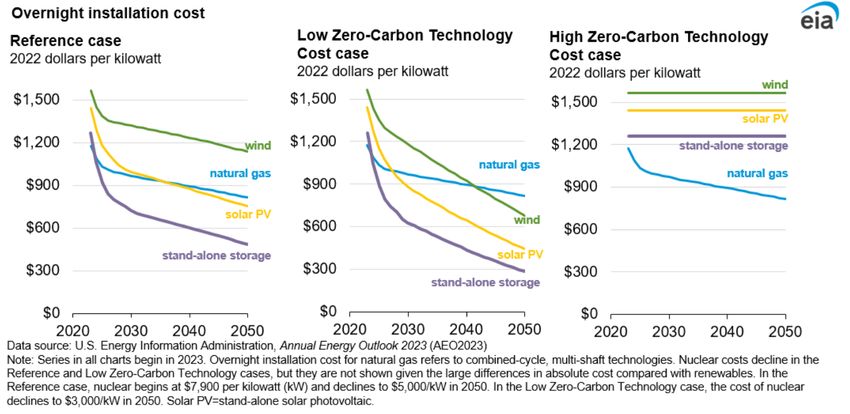
Technical Note 1: Renewable costs and deployment
Continued decline of renewable technology costs relative to natural gas-fired generating
technologies contributes to the change in generation mix in our projection period. In addition
to recent policies that also favor renewables in the generation mix, we use learning factors
to represent learning by doing, which reduces capital costs. Learning factors are calculated
independently for each of the major design components of the technology, and they increase
based on how much new capacity is deployed. For details on renewable costs in the ZTC cases,
please see the Appendix. New, untested components decrease at a more rapid initial rate
than mature components or conventional designs. More details can be found in the NEMS
Electricity Market Module documentation.
U.S. Energy Information Administration | AEO2023 Narrative 12March 2023 As a result of renewables growth, we project that U.S. coal-fired generation capacity will decline sharply by 2030 to about 50% of current levels (about 200 GW) with a more gradual decline thereafter. We project between 23 GW and 103 GW of coal-fired capacity operating in 2050 (Figure 6). The IRA provides additional incentives to wind and solar power generation, which accelerates the near-term decline of electric power sector coal-fired generating capacity and hastens the timeline for retirement in the U.S. coal fleet. Figure 6. Coal consumption in the U.S. electric power sector in the Reference case drops to 189 million short tons (MMst) in 2030 and to 131 MMst in 2050 from 458 MMst in 2022. Coal disposition, which includes exports and consumption by the electric power sector and other end-use sectors, declines to a low of 170 MMst in 2050 in the Low ZTC case. In a high natural gas price environment, such as in the Low Oil and Gas Supply case, coal disposition could remain as high as 350 MMst in 2050. In all cases, annual coal exports average about 110 MMst in 2050, and end-use coal demand averages about 36 MMst. The ratio of coal exports to domestic coal consumption generally increases through the projection period in all cases. The majority of domestically produced coal is exported by 2050 in the Low ZTC case, 45% is exported in the High Oil and Gas supply case, which are the two cases that have the least coal demand from the electric power sector. Even in cases with more aggressive retirement of coal-fired power plants, such as the Low ZTC case, some of the relatively newer and more efficient coal power plants remain online across the United States because they can provide cheap dispatchable power to the grid. The electric power sector is also decreasing its reliance on natural gas in favor of renewables, which we will discuss in Section 3. U.S. Energy Information Administration | AEO2023 Narrative 13
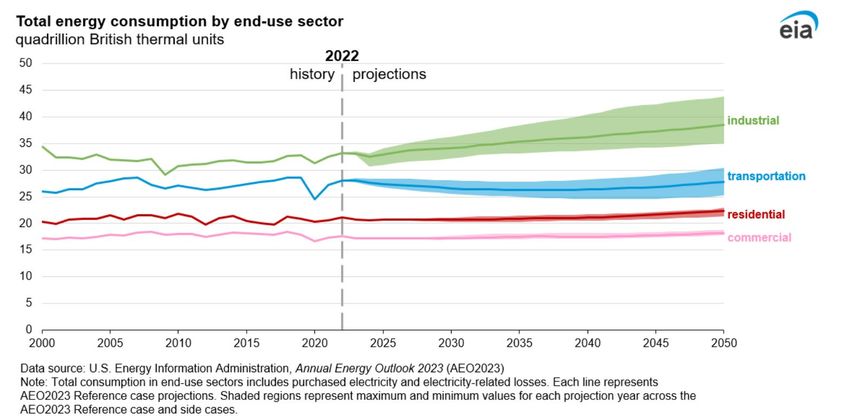
March 2023

2
Technological Advancements and
Electrification Decrease Demand-
Side Energy Intensity

Moderate growth in U.S. energy consumption is the result
of economic growth, population growth, and increased
travel offsetting continued energy efficiency
improvements. Demand-side energy intensity—the
measure of energy consumed per household or per square
foot of commercial floorspace—decreases as a result of
changes in technology, policy, consumer behavior,
demographics, and fuel mix. In this section, we quantify
the decreases in CO2 emissions intensity and demand-side
energy intensity, and we discuss equipment changes in the
buildings sector, electrification in iron and steel
production, and technological advancements and
government standards in the transportation sector.

U.S. energy consumption increases through
2050, and electricity plays an increasingly
large role
 U.S. energy consumption increases in many end-use
sectors across all AEO2023 cases. Total energy
consumption, including electricity use and electricity-
related losses, increases by as much as 15% from 2022 to         Total energy consumption,
2050 across the AEO2023 Reference case and side cases            including electricity use and
(Figure 7). The largest increases, in percentage terms, are in   electricity-related losses,
the industrial sector where energy consumption increases         increases by as much as
as much as 32% and in the transportation sector where            15% from 2022 to 2050
energy consumption increases as much as 8%. Energy               across the AEO2023
consumption in the residential and commercial sectors are        Reference case and side
the least sensitive to changes in assumptions across cases.      cases.

U.S. Energy Information Administration | AEO2023 Narrative                                       14
March 2023

Figure 7.

In addition to macroeconomic growth assumptions, which affect energy consumption in all sectors,
many sectors are also highly responsive to zero-carbon technology cost assumptions. Increasing energy
consumption, improving end-use and electric power sector technology and efficiency, and declining
costs for zero-carbon generation technologies, which, in turn, leads to cheaper electricity, all lead to
increased electrification in the end-use sectors. The share of electricity in the residential and
transportation sectors increase the most as demand for space cooling increases and electric vehicles
gain a larger market share. The residential sector purchased 5.1 quadrillion British thermal units (quads)
of electricity in 2022, and residential consumption of purchased electricity increases between about 14%
and 22% from 2022 to 2050 across all cases, reaching between 5.9 and 6.3 quads. Electricity purchased
for transportation reaches between about 0.6 quads and 1.3 quads in 2050, from 0.1 quads of
purchased electricity in 2022, an increase of between 892% and 2,038% across all cases. Electricity
purchased in the industrial sector is most influenced by economic growth assumptions, increasing by
about 3%, from 3.5 quads in 2022 to about 3.6 quads in 2050 in low economic growth cases and by
about 36% to 38%, to about 4.7 quads, in high economic growth cases.

Greater heating equipment efficiency reduces fossil fuel use in buildings
Despite modest growth in total energy consumption in the residential and commercial sectors, due to a
growing number of households and expanding commercial floorspace, average energy intensity declines
through 2050 across all cases (Figure 7 and Figure 8). Building envelope efficiency improves as states
and localities adopt newer building energy codes and some existing households and commercial spaces
receive additional insulation, air sealing, and other weatherization upgrades.

U.S. Energy Information Administration | AEO2023 Narrative                                              15
March 2023

Figure 8.

An established trend toward warmer winters and population shifts toward warmer and drier areas of
the United States reduce energy consumption for space heating in all cases. At the same time, the
established trend toward warmer summers leads to increasing electricity consumption for space
cooling.

             Technical Note 2: Modeling growth in residential heat pump installations
             Our projections of residential heat pumps, like all major end-use equipment, begin with the
             census division-level stocks from our 2015 Residential Energy Consumption Survey (RECS).
             We use data from the most recent U.S. Census Bureau’s Survey of Construction to further
             align recent space heating equipment shares in newly built housing units. Equipment
             purchase decisions account for federal and non-federal subsidies that further reduce installed
             costs of high-efficiency equipment such as air- and ground-source heat pumps or high-
             efficiency natural gas furnaces. These subsidies include national tax credits extended by the
             Inflation Reduction Act (IRA) and utility rebates to end users at the census-division level.
             Technology performance and energy prices are considered as well. Some provisions of the
             IRA—such as those targeting low-income households—are not explicitly included in our
             modeling. Refer to the Appendix for additional details.

Natural gas-fired heating equipment, including furnaces and boilers, continue to account for the largest
share of energy consumption for space heating in U.S. residential and commercial buildings across all
cases throughout the projection period. Over time, older heating equipment is replaced by newer, more
efficient equipment that meets updated federal minimum energy efficiency standards.

U.S. Energy Information Administration | AEO2023 Narrative                                                    16
March 2023
Federal and non-federal subsidies both encourage homes and businesses to adopt high-efficiency
natural gas and electric equipment, including heat pumps. Electric heat pumps, including ground-source
heat pumps, gain market share over the projection period, increasing from 11% of households in 2022
to between 14% and 15% of households in 2050 across all cases; however, their growth is limited by:
• A large existing market share for non-heat pump equipment that lasts a long time
• The high cost of purchasing and switching technologies, including electrical upgrades to
accommodate electric heating and cooling and new ductwork when replacing boilers
• The higher price of electricity versus natural gas per million British thermal units, despite heat
pump efficiency that may be multiple times higher than fossil fuel-fired equipment
• Reduced overall demand for space heating as building efficiency improves and heating degree
days decrease
Electricity increasingly powers production in the iron and steel industry,
decreasing energy intensity and CO2 emissions
Steel production is an energy-intensive industry, but the choice of production technology significantly
affects its energy and emission intensity. U.S. manufacturers continue to transition away from the
combustion-powered, integrated steel mill process to steel produced by electric-arc furnaces, which
have a lower energy intensity and make up about 68% of U.S. steel produced in 2022. Over the
projection period, the share of U.S. steel produced by the electric-arc furnace process increases by 4% to
7% across the range of cases (Figure 9). The energy intensity of U.S. steel production continues to fall
across all cases, declining between 12% and 21% across all cases (Figure 9). In 2018, steel production
accounted for 1.3% of U.S. energy demand, and we project total energy demand for iron and steel
production to fall relative to total U.S. energy demand, after peaking in 2027.
U.S. Energy Information Administration | AEO2023 Narrative 17March 2023 Figure 9. Technological advancements, including electrification, for light-duty vehicles reduce energy intensity and fossil fuel use In the transportation sector, light-duty vehicle (LDV) fuel economy increases due to rising Corporate Average Fuel Economy (CAFE) standards and electric vehicle (EV) sales. In addition to required fuel economy increases, consumer purchase decisions are also influenced by fuel prices. Consumer interest in EVs, which are significantly more efficient than internal combustion engine vehicles, and the impact EV adoption has on average light-duty vehicle fuel economy are sensitive to the price of gasoline (Figure 10). U.S. Energy Information Administration | AEO2023 Narrative 18
March 2023

Figure 10.

The updated CAFE standard, which applies to model years 2024 through 2026, significantly increases
average new vehicle fuel economy requirements. By 2026, the updated CAFE standard is 28% higher
than the Safer Affordable Fuel-Efficient (SAFE) standard for new vehicles it replaced, resulting in an
increase from 37 miles per gallon (mpg) to 47 mpg by 2026. In addition to improved conventional
vehicle fuel efficiency, EV sales increase through 2050, increasing EVs on the road. The CAFE standard,
which offers credits to EV manufacturers, and decreasing battery prices help drive this increase in EV
sales.

U.S. Energy Information Administration | AEO2023 Narrative                                                19
March 2023

 U.S. passenger vehicle-miles traveled increases
steadily with population and income throughout the           We project LDV energy
projection period, growing between 12% and 33%               consumption to fall through
across all cases. In the Reference case, 23% more            the early 2040s as a result of
vehicle miles are traveled in 2050 than in 2022              fuel economy improvements
(Figure 11). We project LDV energy consumption to            but then to rise due to
fall through the early 2040s as a result of fuel             increasing vehicle miles
economy improvements but then to rise due to                 traveled for the remainder of
increasing vehicle miles traveled for the remainder of       the projection period.
the projection period (Figure 11).

U.S. Energy Information Administration | AEO2023 Narrative                                     20
March 2023

Figure 11.

             Technical Note 3: Electric vehicle (EV) deployments
             Projected declines in EV vehicle component costs, along with federal and state policies that
             provide incentives for EV purchases or require minimum sales, drive EV sales growth in our
             model projection. We derive cost declines for EV powertrain components and batteries by
             using learning rates based on cumulative production, resulting in increased projected driving
             range and a continual decline in EV prices over the projection period. We derive EV sales
             shares at the census-division level using a consumer choice model based on preference data
             and calibrated to align with historical sales data. In addition to other vehicle attributes, our
             consumer choice model captures the impact of vehicle price, cost to drive, access to refueling,
             and the effect that availability of vehicle propulsion options has on consumer purchase
             decisions. All of these factors contribute to the attractiveness of EVs to consumers and
             increases EV deployment relative to internal combustion engine vehicles. We assume
             Corporate Average Fuel Economy standards result in technological improvements and
             increased EV adoption because of declining cost and favorable fuel economy credits. The
             clean vehicle credit in the 2022 Inflation Reduction Act, which varies from $3,750 to $7,500
             per vehicle, drives additional EV sales. Our Transportation Demand Model also ensures legally
             enforceable state minimum EV sales requirements are met in each census division and EV
             prices adjust to account for tax credits at purchase. In addition, other factors, such as a rising
             number of charging stations, affect our EV sales projections. We base our model projections
             on these data, assumptions, and current enforceable laws and regulations and do not assume
             that state and federal stated goals for EV sales are met. These details are available in our
             model documentation.

U.S. Energy Information Administration | AEO2023 Narrative                                                        21
March 2023 3 International Demand for Petroleum and Natural Gas Drives U.S. Production, While Domestic Consumption Either Grows Slowly or Decreases Although U.S. consumption of petroleum products remains relatively flat, international demand supports U.S. exports of petroleum and other liquids (Figure 12). The dynamics of international trade affect domestic production of natural gas and of petroleum and other liquids. U.S. Energy Information Administration | AEO2023 Narrative 22
March 2023

International demand drives petroleum and other liquids production
Figure 12.

                                                 Although domestic consumption of petroleum and other liquids
                                                 does not increase through 2040 across most cases, U.S.
    In all cases, we project                     petroleum and other liquids production remains high because of
    that the United States                       increased exports of finished products in response to growing
    will remain a net                            international demand (Figure 13). In all cases, we project that
    exporter of petroleum                        the United States will remain a net exporter of petroleum
    products through 2050.                       products through 2050. In the High Oil Price case, increased
                                                 production leads to the most exports among all cases over the
                                                 projection period. The Low Oil Price case shows the opposite:
                                                 decreased production along with the lowest export volumes.

Crude oil imports remain relatively flat in the Reference case but vary widely in the side cases (Figure
13); the Low Oil and Gas Supply case leads to the greatest level of imports throughout the forecast
period while the High Oil and Gas Supply case leads to the lowest imports (Figure 13). This wide range in
imports is mainly due to the tradeoff between domestic production and imports. In the Low Oil and Gas
Supply case, crude oil imports increase significantly, partially to account for falling domestic crude oil
production. The opposite occurs in the High Oil and Gas Supply case, in which increased domestic
production balances lower crude oil imports.

U.S. Energy Information Administration | AEO2023 Narrative                                                     23
March 2023
Figure 13.
In the High Oil Price case, U.S. crude oil imports initially decline but begin to increase starting in 2030
because of changing trends in domestic crude oil production. In the early years, domestic crude oil
production increases rapidly due to high prices. However, crude oil production begins to fall after 2030
because wells are drilled increasingly close to one another, resulting in well productivity declines. As
wells are drilled closer together, they produce less crude oil and eventually become unprofitable, at
which point new drilling stops. Crude oil imports decline early in the High Oil Price case as crude oil
production increases; imports increase after 2030 as well productivity and crude oil production declines.
Because international demand for finished petroleum products keeps exports high, U.S. refinery runs
remain strong as the U.S. refinery sector remains competitive in the global market through 2050.
Refinery capacity remains relatively constant through 2050, and refinery capacity utilization remains
high, at around 90% or higher, under favorable economic conditions.
Technical Note 4: Crude oil trade dynamics
Crude oil is a global commodity, and the United States participates in the global market as
both an importer and exporter of crude oil and its associated products. Because of logistical,
regulatory, and quality considerations, both exporting and importing petroleum often makes
economic sense. For example, a refiner in the Gulf Coast may find it more profitable to export
motor gasoline to Mexico rather than shipping it to the East Coast because cheaper gasoline
imports from Europe may be available to the East Coast.
The chemical makeup of the imported or exported product also affects crude oil trade. The
type of crude oil—light or heavy, low-sulfur (sweet) or high-sulfur (sour)—helps determine
the processes that refine it into a petroleum product such as distillate fuel oil or propane. In
short, the United States imports different types of crude oil to optimize production across its
various refineries.
U.S. Energy Information Administration | AEO2023 Narrative 24March 2023
The World Oil Price path is an exogenous assumption to the model and affects domestic crude
oil production and international trade. For each year of the projection period, NEMS
computes the Brent crude oil price, provides a supply curve of world crude oil-like liquids, and
provides supply curves for each foreign crude oil type considered. NEMS also provides, for
each year of the projection period, exogenous supply and demand curves for U.S. import and
export of petroleum products.
In response to Russia’s full-scale invasion of Ukraine in early 2022, the United States banned petroleum
imports from Russia. AEO2023 projections reflect this policy change. However, we assume that
equivalent imports from other countries substitute for U.S. crude oil imports (especially unfinished oil
imports) from Russia, minimizing effects on domestic markets.
Natural gas consumption in end-use sectors is variable
In the United States, electrification is displacing combustion fuels in the demand sectors. As electricity
generation shifts to using more renewable and battery sources, domestic natural gas consumption for
electricity generation is likely to decrease by 2050 relative to 2022, which contrasts with relatively stable
growth over the past decade (Figure 14).
Figure 14.
U.S. Energy Information Administration | AEO2023 Narrative 25March 2023 More natural gas is consumed in the industrial or electric power sectors than in any other sectors of the U.S. economy. Projected consumption in both sectors is very sensitive to changes in our side case assumptions, particularly in the Oil and Gas Supply cases (Figure 15). These cases, which result in the most and the least natural gas consumption in the industrial sector, vary widely due to differences in resource extraction assumptions. By 2050, natural gas consumption in the industrial In the electric power sector diverges from the Reference case by 14% in the Low Oil and sector, our Gas Supply case and 18% in the High Oil and Gas Supply case. projections for In the electric power sector, our projections for natural gas natural gas consumption generally fall but range widely, with consumption in consumption 2050 diverging from the Reference case by over 50% in the generally fall but bounding cases (Figure 15). Natural gas consumption remains range widely, with below the peak in 2022, at nearly 12 trillion cubic feet, through consumption in 2050 2050 across all side cases except the High Economic Growth and diverging from the High ZTC case. In the Low ZTC case, lower costs for renewables Reference case by makes natural gas less competitive, resulting in a larger decrease over 50% in the in natural gas consumption compared with the Reference case. In bounding cases. the High Economic Growth and High ZTC case, increased economic activity drives increased end-use demand, which results in more natural gas consumption. Higher costs for renewables make natural gas a more competitive option in that case, further increasing natural gas consumption in the electric power sector. Figure 15. U.S. Energy Information Administration | AEO2023 Narrative 26
March 2023

Under favorable economic, supply, and oil price assumptions, U.S. natural gas
production continues to grow
In the Reference case, U.S. natural gas production increases by 15% from 2022 to 2050, and
consumption decreases by 6% from its peak in 2022 (Figure 16). Across all cases, domestic production
outpaces domestic consumption; production increases across all side cases except in the Low Oil and
Gas Supply case and the Low Oil Price case.

Figure 16.

In some cases, exports to satisfy growing international demand for natural gas encourage growth in
domestic natural gas production. A significant portion of production growth is due to liquefied natural
gas (LNG) export demand, which drives the overall increase in natural gas exports (Figure 17).

U.S. Energy Information Administration | AEO2023 Narrative                                                27
March 2023

Figure 17.

Historically, most LNG was traded under long-term, oil price-linked contracts because a global LNG price
benchmark did not exist and because oil could substitute for natural gas in industry and for power
generation, which was especially common in Asia. These factors supported highly correlated
international natural gas and oil prices. With growth in more market based-LNG, the strength of the
relationship between international natural gas prices and oil prices has eroded. However, we expect
that future oil prices will still affect additional LNG export capacity and overall export levels. When the
Brent price is high relative to the U.S. Henry Hub price, like in the High Oil Price case, building more LNG
export capacity and exporting LNG are more economical than when the Brent price is lower relative to
Henry Hub. In the Low Oil Price case, the Brent price is lower, and the Henry Hub price is higher, which
curtails LNG exports to below current volumes in the near term and causes LNG capacity to be
underutilized near the end of the projection period.

International demand for LNG exports results in rising natural gas production, favoring areas that have
better access to terminals. In AEO2023, dry natural gas production grows in the Southwest, which has
easy pipeline transport to the Gulf Coast, where LNG is exported. Production in the Gulf Coast also
generally increases across the projection period, due to its proximity to LNG export terminals, in all
cases except the Low Oil and Gas Supply case (Figure 18).

U.S. Energy Information Administration | AEO2023 Narrative                                                28
March 2023

Figure 18.

Associated natural gas is a major source of natural gas production
In AEO2023, shale gas and associated dissolved natural gas from oil formations are the primary sources
of long-term growth of domestic natural gas production through 2050. Increased production wells in the
Permian Basin (Southwest region) is the primary driver behind associated dissolved natural gas growth.
Increases in shale gas production mainly comes from the Texas-Louisiana Salt Basin (Gulf Coast Region)
and the Appalachian Basin (East Region).

In the High Oil Price case and High Oil and Gas Supply case, oil production growth leads to increased
associated dissolved natural gas and shale production (Figure 19). The opposite occurs in the Low Oil
Price case and Low Oil and Gas Supply case.
Figure 19.

U.S. Energy Information Administration | AEO2023 Narrative                                              29
March 2023

Discussion
Sources of uncertainty
Energy market projections are inherently uncertain because many of the events that will shape future
energy markets—including developments in policy, technology, demographics, and resources—are not
known. To illustrate the role of uncertainty, AEO2023 includes a baseline Reference case and several
side cases that systematically vary important underlying assumptions. Many sources of uncertainty exist
beyond the ones we test explicitly, including new policy, unforeseen geopolitical events, and rapid
technology innovation, particularly around technologies that are in the earliest stages of development.

Policy
Our key assumptions in the Reference case provide a baseline for exploring long-term trends, based on
current laws and regulations as of November 2022. These assumptions include provisions of the IRA;
however, we were unable to model all provisions, as indicated in the appendix. Any future legislation
would further affect technology trajectories and emissions pathways. We publish the current laws and
regulations considered in the AEO2023 on the AEO website.

Geopolitical events
We account for current events that affect the energy markets with the information available at the time
we prepare this publication. However, we cannot foresee future events such as wars, supply disruptions,
pandemics, or other such issues that could having lasting impacts on the U.S. energy system.

Rapid technology innovation
The technologies considered in the AEO2023 include only well-documented trends in energy innovation.
Additional breakthroughs not considered here might occur. Examples of the kind of breakthrough we
don’t consider include early-developmental-stage technologies such as hydrogen, enhanced geothermal,
and fusion, as well as other technologies currently unknown or not well characterized.

Quantifying uncertainty using statistical errors from past projections
The sources of uncertainty described above, among others, result in observed values that are different
than our projected values. To explore some key uncertainties, we include a number of side cases that
incorporate plausible alternatives to assumptions in the Reference case. We can also develop a sense of
future uncertainty by calculating the differences (or statistical errors 3) between realized values and our
Reference case projections from previous AEO editions. Given constantly evolving modeling techniques
and a dynamic energy landscape replete with non-linear relationships, statistical errors from past
projections will not necessarily provide an accurate basis for estimating uncertainty in current
projections. Nevertheless, using statistical errors from past projections implicitly captures real world
factors that were difficult to anticipate in past AEO editions.

3Here we use “error” in a statistical sense to denote the difference between projected and real-world values. Because our
Reference case is not intended to serve as a forecast, deviations from reality should not be interpreted as errors.

U.S. Energy Information Administration | AEO2023 Narrative                                                                  30
March 2023

In the 2022 edition of our Annual Energy Outlook Retrospective Review (AEO Retrospective), we
quantified the statistical errors associated with past Reference cases over several key output metrics
and projection timeframes, ranging from 1 to 15 years. Building on the work from the AEO Retrospective
and following the NP2 method (a methodology detailed in a 2017 paper by researchers Lynn H. Kaack,
Jay Apt, M. Granger Morgan, and Patrick McSharry), we can use statistical errors from past projections
to develop a cone of uncertainty—similar to those used by the National Oceanic and Atmospheric
Administration (NOAA) to produce hurricane path cones—which we can apply to the AEO2023
projections. Employing statistical errors from past projections along with side case projections can help
us better assess the possible range of uncertainty in the AEO results.

For example, we can use the statistical errors from past AEO Reference case projections to project
future uncertainty in U.S. energy-related CO2 emissions produced by the AEO2023 Reference case until
2030 (Figure 20). Figure 20 includes two uncertainty cones for total energy-related CO2 emissions,
representing statistical error estimations where the narrower and wider cones capture 50% and 95% of
the historical projection errors around the Reference case, respectively. Our Reference case projection
has a wide range of future uncertainty in total energy-related CO2 emissions, which in some instances
goes beyond the bounds explored in our most extreme side cases.

Because the AEO Reference case includes only laws and regulations current at the time it is developed,
past Reference case projections of total energy-related CO2 emissions tend to be higher than actual
because they don't include subsequent public policies that further reduce emissions. The uncertainty
cones capture these over-projected statistical errors in total energy-related CO2 emissions and show the
possibility for lower emissions compared with our most extreme side case with the lowest total energy-
related CO2 emissions. We see the possibility of total energy-related CO2 emissions increasing in the
short term before falling in the long term, both in our High Economic Growth and High Zero-Carbon
Technology Cost case and the upper 95th percentile of statistical errors from past projections.

We will continue to explore our use of this technique, as well as other ways to quantify uncertainty, in
future analyses.

U.S. Energy Information Administration | AEO2023 Narrative                                                 31
You can also read