Decarbonisation pathways - For the European building sector
←
→
Page content transcription
If your browser does not render page correctly, please read the page content below
Decarbonisation pathways
For the European building sector

By order of:

Submitted by:

Guidehouse Germany GmbH
Albrechtstr. 10c
10117 Berlin

Marco Reiser
Kiki Klerks
Dr. Andreas Hermelink

Reference No.: 219439
15th July 2022

guidehouse.com

Guidehouse Germany GmbH | Hauptsitz: Albrechtstr. 10 c | 10117 Berlin | Tel. +49 30 7262 1410
Handelsregister Amtsgericht Charlottenburg | Handelsregisternr. HRB 191924 | USt-ID-Nr. DE 316292507
Geschäftsführer: Scott McIntyre, Edward Eich, Deborah Ricci, Shamir Patel
Disclaimer
This deliverable was prepared by Guidehouse Germany GmbH for the sole use and benefit of, and pursuant to a
client relationship exclusively with EHI (“Client”). The work presented in this deliverable represents Guidehouse’s
professional judgement based on the information available at the time this report was prepared. Guidehouse is not
responsible for a third party’s use of, or reliance upon, the deliverable, nor any decisions based on the report.
Readers of the report are advised that they assume all liabilities incurred by them, or third parties, as a result of
their reliance on the report, or the data, information, findings and opinions contained in the report.
Table of Contents
Executive Summary ................................................................................................. 1
1. Introduction .......................................................................................................... 4
2. Methodology ......................................................................................................... 5
2.1 Decarbonisation pathways ..................................................................................... 5
2.1.1 Underlying climate and fossil fuel reduction targets..................................... 5
2.1.2 Pathway development................................................................................. 6
2.2 Key indicators......................................................................................................... 7
2.3 Modelling of the European building sector: BEAM² model ...................................... 8
2.3.1 Inputs to the building sector model.............................................................. 8
2.3.2 Determination of electricity peak load ....................................................... 15
2.3.3 Infrastructure cost assumptions and calculation ........................................ 16
2.4 Additional assessments ........................................................................................ 16
2.4.1 Social considerations ................................................................................ 16
2.4.2 Country assessments ............................................................................... 17
3. Results ................................................................................................................ 18
3.1 GHG emissions (2030/2050) ................................................................................ 18
3.2 Technology mix development ............................................................................... 18
3.2.1 Pathway A ................................................................................................ 18
3.2.2 Pathway B ................................................................................................ 19
3.3 Infrastructure impact ............................................................................................. 20
3.4 Consumption of gaseous fuels over time .............................................................. 22
3.5 Cost derivation from the pathways ....................................................................... 22
3.6 Work force needed ............................................................................................... 23
4. Additional considerations ................................................................................. 24
4.1 Social aspects ...................................................................................................... 24
4.2 Regional aspects .................................................................................................. 25
4.2.1 Germany ................................................................................................... 25
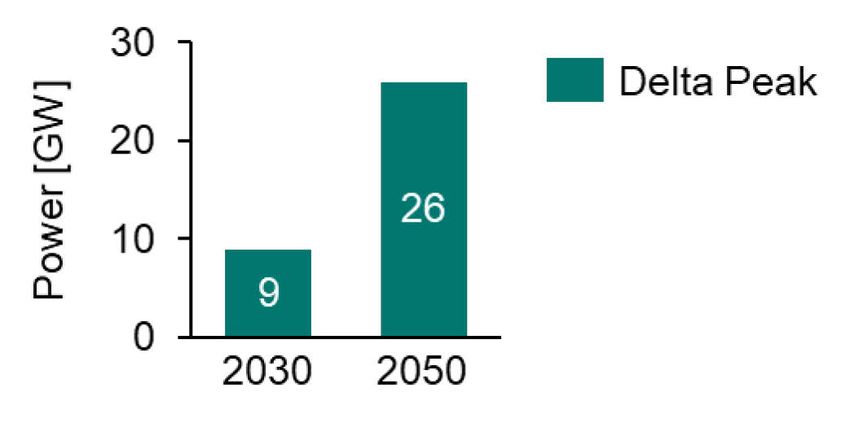
4.2.2 France ...................................................................................................... 27
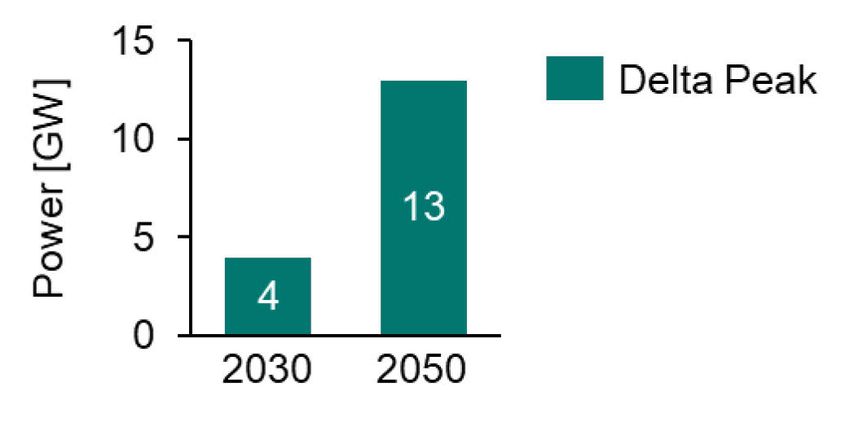
4.2.3 Italy ........................................................................................................... 28
4.2.4 Spain ........................................................................................................ 29
4.2.5 Poland ...................................................................................................... 31
5. Conclusion .......................................................................................................... 33
6. Policy recommendations ................................................................................... 36
Appendix A. Inputs BEAM model.......................................................................A-38
A.1 Reference buildings .......................................................................................... A-38
A.1.1 Definition of refence buildings ............................................................. A-38
A.1.2 Building shell efficiency levels ............................................................. A-40
A.1.3 Building shell efficiency (exemplary for zone West) ............................. A-45
A.2 Economic assumptions ..................................................................................... A-46
A.2.1 Investment cost ................................................................................... A-46
©2022 Guidehouse Inc. All rights reserved. Page i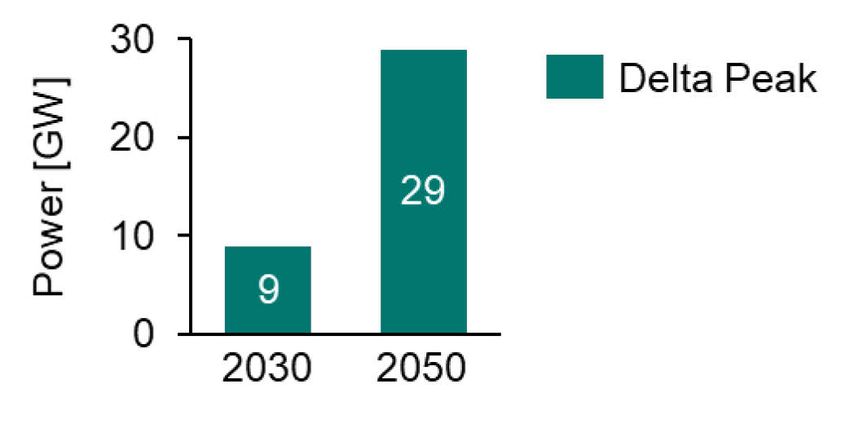
A.2.2 Energy prices ...................................................................................... A-47
        A.3 Other inputs ...................................................................................................... A-49
             A.3.1 Emission factors .................................................................................. A-49
        A.4 Additional output ............................................................................................... A-49
             A.4.1 Indication for the development of the number of heating systems per
                     Pathway .............................................................................................. A-49
             A.4.2 Social considerations .......................................................................... A-50
 Appendix B. Regional aspects .............................................................................B-1

©2022 Guidehouse Inc. All rights reserved.                                                                                   Page ii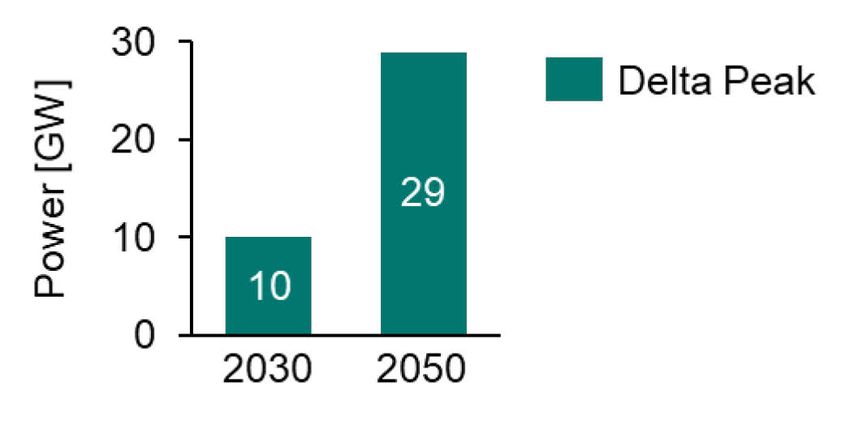
List of Tables
 Table 1 Four pathways of staged renovation ....................................................................... 24
 Table 2: Single Family House (SFH), existing buildings per Reference Zone ................... A-38
 Table 3: Small Multi Family House (SMFH), existing buildings per Reference Zone ........ A-38
 Table 4: Large Multi Family House (LMFH), existing buildings per Reference Zone ......... A-39
 Table 5: Single Family House (SFH), new buildings per Reference Zone ........................ A-39
 Table 6: Small Multi Family House (SMFH), new buildings per Reference Zone .............. A-39
 Table 7: Large Multi Family House (LMFH), new buildings per Reference Zone .............. A-39
 Table 8: Non-residential reference buildings .................................................................... A-40
 Table 9: Building shell efficiency per Reference Zone and Age Group – Residential
 Buildings, not renovated, .................................................................................................. A-41
 Table 10: Building shell efficiency per Reference Zone and Age Group – Non-Residential
 Buildings, not renovated, ................................................................................................. A-42
 Table 11: Building shell efficiency per Reference Zone and Age Group – Residential
 Buildings, already renovated, ........................................................................................... A-42
 Table 12: Building shell efficiency per Reference Zone and Age Group – Non-Residential
 Buildings, retrofit ambitious, ............................................................................................. A-43
 Table 13: Building shell efficiency per Reference Zone – Residential and Non-Residential
 Buildings, retrofit levels,.................................................................................................... A-44
 Table 14: Building shell efficiency per Reference Zone – Residential and Non-Residential
 Buildings, new construction levels .................................................................................... A-45
 Table 15 Investment cost extrapolation factors ................................................................ A-47
 Table 16 Energy price per zone ....................................................................................... A-47
 Table 17 Emission factors in start year per zone .............................................................. A-49
 Table 18: Indication on number of heating systems in the building stock (Pathway A) ..... A-49
 Table 19: Indication on number of heating systems in the building stock (Pathway B) ..... A-50

©2022 Guidehouse Inc. All rights reserved.                                                                                     Page i
List of Figures
 Figure 1 Reference Zones for the EU-27............................................................................. 10
 Figure 2 Average monthly temperatures of the reference climates in the Reference Zones 11
 Figure 3 Exemplary renovation level, expressed vie energy need, of SFH in zone West..... 12
 Figure 4 Difference in average energy need between the standards of pathway A and
 pathway B ........................................................................................................................... 13
 Figure 5 The shares of each renovation standard per pathway ........................................... 13
 Figure 6 Direct CO2 emissions in the EU building sector ..................................................... 18
 Figure 7 Development of heating systems (based on m²) for pathway A ............................. 19
 Figure 8 Development of heating systems (based on m²) for pathway B ............................. 20
 Figure 9 Comparison of resulting peak load demand from heat pumps ............................... 21
 Figure 10 Cost savings of power infrastructure of pathway B .............................................. 21
 Figure 11 Total future gas demand for pathway A and B (EU) ............................................ 22
 Figure 12 Cost savings of pathway B compared to A .......................................................... 23
 Figure 13 Case 1 (heat pump + 1-step renovation) vs. case 3 (hybrid heat pump + staged
 renovation) .......................................................................................................................... 25
 Figure 14 German electricity peak reduction in pathway B compared to A .......................... 26
 Figure 15 Accumulated German cost savings* of pathway B until 2050 .............................. 26
 Figure 16 France electricity peak reduction in pathway B compared to A ............................ 28
 Figure 17 Accumulated French cost savings* of pathway B until 2050 ................................ 28
 Figure 18 Italy electricity peak reduction in pathway B compared to A ................................ 29
 Figure 19 Accumulated Italian cost savings* of pathway B till 2050..................................... 29
 Figure 20 Spain electricity peak reduction in pathway B compared to A .............................. 30
 Figure 21 Accumulated Spanish cost savings* of pathway B until 2050 .............................. 31
 Figure 22 Poland electricity peak reduction in pathway B compared to A ............................ 32
 Figure 23 Accumulated Polish cost savings* of pathway B until 2050 ................................. 32
 Figure 24 Single family house (SFH)................................................................................ A-45
 Figure 25 Large multifamily house (LMFH) ...................................................................... A-46
 Figure 26 Office building .................................................................................................. A-46
 Figure 27 Applied energy price index 2020-2050 (example for Western zone) ................. A-48
 Figure 28 Applied energy price index 2020-2050 for ‘new fuels’....................................... A-48
 Figure 29 Case 1 (heat pump + 1-step renovation) vs. case 2 (heat pump + staged
 renovation) ....................................................................................................................... A-50
 Figure 30 Case 1 (heat pump + 1-step renovation) vs. case 4 (condensing boiler + staged
 renovation) ....................................................................................................................... A-51

©2022 Guidehouse Inc. All rights reserved.                                                                                         Page ii
Executive Summary
 The climate crisis and recent geopolitical tensions require unprecedented efforts to quickly
 cut emissions and fossil energy consumption – with buildings as a key sector. Major
 elements to achieve this are increasing efficiency in buildings and heating systems in
 combination with an accelerated fuel switch and the phase-in of more renewable energy.
 With the Fit-for-55 and REPowerEU packages, the EU is working on setting a policy
 framework committed to a net zero economy by 2050 as laid out in the European Climate
 Law (Regulation (EU) 2021/1119), and to become independent of energy imports from
 Russia, in a fast-paced and cost-effective way.

 This study elaborates on pathways to decarbonise heating in the building sector, which meet
 these policy objectives. The approach combines a model reflecting the European building
 sector, with an analysis of the impact on electricity and gas infrastructures. In addition,
 options for decarbonising heating with staged deep renovation for individual buildings and
 the affordability for households are assessed to take into account social acceptance. Main
 indicators include investments in efficiency measures and heating systems, heating cost for
 households, aggregated consumption, and the impact that heating systems have on peak
 load, along with resulting investments into the electricity and gas infrastructure.

 The evaluation compares two pathways. Common to both is that electric heat pumps play a
 key role in short and long term. Additionally, both pathways focus on energy efficiency
 measures in the building, including the installation of efficient heat emitters (underfloor
 heating, low temperature radiators) where needed, a sharp reduction of consumption of
 gaseous fuels compared to today as well as the phase-in of renewable alternatives and
 strengthening of district energy. They differ in that pathway A assumes a very high level of
 electrification with heat pumps and little space for other technologies or energy carriers. In
 pathway B, electrification via heat pumps plays a fundamental role, but also a higher heating
 system replacement rate that focuses on old, inefficient boilers. Additionally, hybrid heating
 solutions support the fuel switch – especially in buildings that are not yet ready for heat
 pumps – and a significant contribution of green gases is considered. Green gases are also
 used in renewable-ready boilers (modelled technology) as well as in thermally driven heat
 pumps, micro-cogeneration and fuel cells (qualitatively considered).

 The study concludes that pathway B achieves the objectives of Fit-for-55 and REPowerEU in
 an easier, cheaper, and more socially acceptable as well as flexible way than pathway A,
 with an aggregated cost benefit of over 520 bn EUR until 2050. In addition, relying on the
 variety of technologies featured in pathway B reduces the peak load from heating by more
 than 50% - assessed during a windless and dark winter week. It also cuts natural gas use
 the fastest, achieving 45% reduction in gas consumption in 2030.

 More in detail:

     •    Both Pathways cut natural gas use by over 40% in 2030, as well as CO2
          emissions by 60%, compared to 2020, mainly through the accelerated deployment
          of hydronic heat pumps and the accelerated replacement of old, inefficient boilers.
          Pathway B is more feasible because the deployment of heat pumps is facilitated by a
          higher share of hybrid heat pumps and hybridisation, and by a broader mix of
          efficient and renewable-based heating technologies, which helps to overcome
          relevant limitations of the electricity system and the condition of the building stock.
          Additionally, it cuts natural gas use the fastest (-45% by 2030).

©2022 Guidehouse Inc. All rights reserved.                                                  Page 1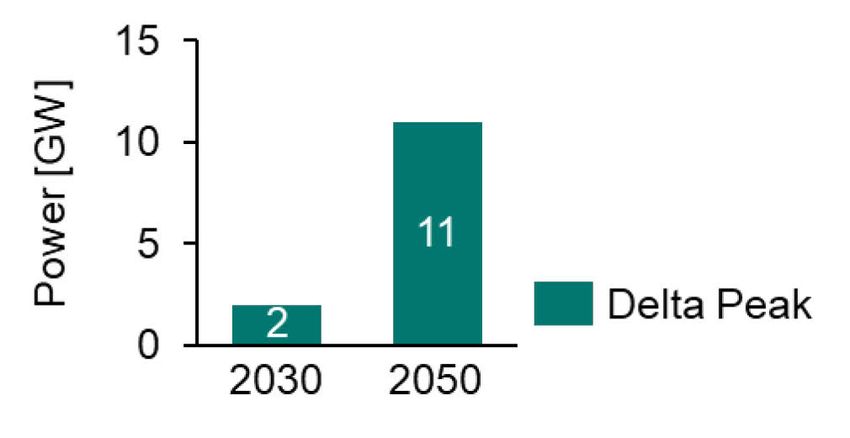
•    Pathway B is more practical and cheaper; hence, it can increase social
          acceptance of decarbonisation measures. Increased efficiency measures are
          relevant and important to prepare the building stock for the ongoing transformation.
          But a significant share of hybrids enable the electrification of those parts of the
          building stock that are not yet suitable for standalone electric heat pump installation.
          The upgrade of the envelope can follow at a later stage, but significant
          decarbonisation potential can be leveraged earlier through this approach. The
          broader technology mix allows for tailored building decarbonisation pathways,
          addressing the complexity of the heterogeneous building stock and household
          income distribution. In the case of hybrids, with lower initial upfront investment than
          for a deep renovation case, the consumption of gas (or oil) can be reduced by 70-
          90%. Subsequent investments can increase renovation depth as part of staged deep
          renovations leading towards zero emission buildings.

     •    Pathway B achieves full decarbonisation by 2050, while lowering overall system
          cost. A diversification of technologies – especially with hybrid systems – reduces
          constraints for electricity generation adequacy. With 133 GW, in pathway B, the
          additional peak load from electrification of heating is about 54% lower than in
          pathway A. This entails reduced investments into firm additional peak load
          generation and electricity transmission and distribution capacities.

     •    By 2050 Pathway B requires less than a third of today’s consumption of gaseous
          fuels in the heating sector, with no use of natural gas. The total demand of
          renewable gases (biomethane and hydrogen) will amount to 395 TWh/year by 2050.
          These fuels will stem from renewable sources such as wind and photovoltaic
          electricity as well as waste-based feedstock, with diversified supply as foreseen by
          the Fit-for-55 and REPowerEU packages.

 To bring the EU on the optimal pathway towards the objectives of REPowerEU and
 Fit-for-55, a revised regulatory framework should:

     1. Accelerate the decarbonisation of buildings, through the most cost-effective mix of
        measures to make it also work for ‘hard to abate’ buildings and to stay within the
        remaining carbon budget.

     2. Enable the use of a broad system mix of highly efficient, renewable ready and future-
        proof heating technologies, and safeguard the efficient transformation towards a
        decarbonised energy system

     3. Foster fast replacement (around 6% per year) of inefficient heat generators and
        optimisation of hydronic heating systems with heat pumps, hybrid heat pump
        systems, solutions ready for renewable gases and other key heating decarbonisation
        technologies

     4. Support the necessary upfront investments for higher efficiency in buildings, efficient
        and renewable-ready heating systems, and the energy system to achieve an
        affordable transition for the end users

     5. Ensure that the necessary qualified work force is available, thanks to private and
        public sector training as well as reskilling initiatives

     6. With regards to the building envelope, it is important to aim for the most cost-effective
        energy efficiency measures, with a view to achieving the desired standards of the
        energy performance of buildings directive

©2022 Guidehouse Inc. All rights reserved.                                                   Page 2
7. Stimulate the ramp up of renewable electricity and mainstream the assessment of the
        impacts of electrification of heating and its potential for demand side flexibility into
        network planning

     8. Stimulate the ramp up of green gases and ensure the availability of well dosed
        volumes for the heating sector to reach 2030 and 2050 goals. Drive the adaptation of
        power and gas distribution infrastructure, in a logic of system efficiency and sector
        integration. Where relevant, support further involvement of local grid operators in
        regional planning

     9. Through product and climate policies (eco-design and energy labelling) support
        innovation and deployment of highly efficient heating technologies, ready for zero
        carbon energy carriers, including “readiness” to run on hydrogen

     10. Ensure that high efficiency of heating systems is guaranteed in operation

©2022 Guidehouse Inc. All rights reserved.                                                 Page 3
1. Introduction The decarbonisation of the building sector – and therefore heating 1 – is necessary. And yet, it has so far proven to be one of the most challenging aspects of the European energy transition. The complexity of decarbonising this sector is increased by the large upfront costs, long investment cycles and the situational differences of each building. There is no one size fits all solution. This complexity has slowed down the uptake of decarbonisation measures for the sector over the past years. To achieve the EU ambitions formulated in the Fit-for-55 programme and climate target plan (CTP) 2 of -60% GHG direct emission in the power and building sector in 2030 compared to 2015, we need to act now. In addition, the war in Ukraine has brought the discussion about the dependency on fossil fuels back into focus and the EC is setting up their strategy with REPowerEU on how to rapidly become more independent from Russian energy imports. To achieve this, it is indisputable that electrification by means of heat pumps will play a key role. However, it is still unclear which decarbonisation pathway is the most suitable in terms of cost effectiveness and practical feasibility. The European Heating Industry (EHI) would like to support this discussion by providing its industry knowledge. EHI commissioned Guidehouse to conduct this study to identify the most cost-effective and efficient decarbonisation pathway for the European heating sector. This assessment took into consideration not only the key role of heat pumps and building insulation, but also decarbonisation options such as district heating, renewable and decarbonised gases, solar thermal systems, the efficient use of bioenergy (e.g.: biomass and bioliquids), as well as innovative heating technologies (e.g., thermally driven heat pumps and fuel cells). To this end, Guidehouse models and compares two pathways for the decarbonisation of the building sector. Pathway A focusses on very high electrification with little space for other technologies or energy carriers. Pathway B considers a high electrification which relies on an optimisation through more available solutions. This includes a significant share of hybrid heating systems, but also other heating technologies and energy carriers. Furthermore, core elements in both pathways are increasing energy efficiency measures in the building’s envelope. On top of that, more efficient heat emitters, i.e.: underfloor heating and radiators play an important role, by helping buildings’ readiness for low temperature heating. Additionally, the installation of solar thermal systems can reduce the need for further electric or fuel-based energy use. The following section provides details on the methodology and tools used, while the results are presented in section 3. Additional considerations, namely social and regional aspects, are elaborated on in section 4. Subsequently, final conclusions of the analysis are given, and the report closes with policy recommendations on necessary actions to enable the heating sector’s decarbonisation on the proposed pathway. 1Space heating and domestic hot water represent around 80% of the energy consumption in buildings. 2CTP formulates the goal of -55% emissions until 2030 (compared to 1990) and ‘Fit-for-55’ package aims to bring EU legislation in line with the 2030 goal. Building and power sector are assumed to deliver -60% direct emissions in 2030 (compared to 2015). ©2022 Guidehouse Inc. All rights reserved. Page 4
2. Methodology
 This study compares two pathways for the decarbonisation of the European building sector
 until 2050. The goal is to identify the most beneficial pathway. The focus is on the impact on
 societal costs and resource adequacy of the power grid, that the choice of heating systems
 has. In addition, societal considerations are taken into account.

 The two decarbonisation pathways are defined in section 2.1 and 2.1.2. To compare which
 of the pathways is most beneficial for Europe – from a societal, energy system and end
 consumer perspective. There are key indicators listed in section 2.2, like overall cost or
 resulting electricity peak to the power grid. These indicators are analysed with a model,
 representing the European heating sector (see section 2.3). Finally, there are additional
 assessments to complement the quantitative assessment: Societal and regional
 considerations, as further described in section 2.4.

 2.1 Decarbonisation pathways
 The assessed pathways need to achieve the same climate and fossil fuel reduction targets,
 as well as other goals formulated by the European Commission. To get there, however, each
 pathway applies different measures, e.g., different focus on heating systems used. First, the
 common targets are outlined and subsequently, the individual pathways are formulated.

 2.1.1 Underlying climate and fossil fuel reduction targets

 This study aligns with the following GHG emission targets for the future of the building
 sector:

        •   2030 - The CTP defines the target of power & building sector together with -60%
            GHG direct emission reduction compared to 2015. Direct emissions are fossil fuels
            burned on site, which excludes electricity and district heat (indirect emissions).
        •   2050 - The EPBD 3 set the target that all buildings should be zero emission buildings
            by 2050 and should use carbon neutral energy carriers for all buildings.
 To achieve these targets, we created two pathways for the decarbonisation of the building
 sector. Chapter 2.1.2 explains how these two pathways differ from each other. However,
 there are also similarities within the pathways. Both pathways assume the same renovation
 rate for the modelling.

 The two pathways also share some assumptions on the future of newly installed heating
 systems. Electrification will be one of the important elements to decarbonise the building
 sector. Other important heating sources are wood boilers and stoves as well as district heat.
 Newly installed oil boilers will be limited as it is expected that regulators will start to ban new
 installations of oil boilers, if they cannot run on renewable fuels. New buildings will be mainly
 equipped with heat pumps. From 2030 onwards, heat pumps will be the heating system with
 the highest single share in the building stock. There is a transition from consumers to
 prosumers. Heating systems will increasingly be an integrated solution, combined with
             4
 rooftop PV and energy management systems.

 Furthermore, the goals formulated in REPowerEU, relevant or impacted by the heating
 sector, are fulfilled, too. This implies having an additional 30 million heat pumps in the
 building stock by 2030 and reducing the use of natural gas for heating in buildings

 3   Energy performance of buildings directive
 4   rooftop PV is considered to be fed to grid and not considered in cost calculation

©2022 Guidehouse Inc. All rights reserved.                                                     Page 5
significantly. The updated goals for biomethane and hydrogen available by 2030 are considered as well. 2.1.2 Pathway development This study focusses on two pathways, called A and B. Both pathways have similar assumptions regarding new constructed buildings. They assume the same construction rate and energy performance of new buildings. In addition, the heating system efficiencies and the renovation rate are independent of the pathway. Pathway A and B differ in their heating mix, green gas shares, heating replacement rate and renovation standard. Chapter 2.1.2.1 and 2.1.2.2 elaborate on the differences between the two pathways. 2.1.2.1 Pathway A The first pathway – pathway A – focusses on the use of electric heat pumps for the heating sector and therefore represents the solution currently dominating in many debates on the decarbonisation of buildings. Other technologies, like district heat and biomass boilers are still relevant, but electric heat pumps are the by far dominating technology. If the heating system of a building needs to be replaced, pathway A assumes that there is always a preference for the replacement with an electric heat pump instead of other technologies. Only in exceptional cases another heating installation would be chosen over the electric heat pump, for example when district heating is in place or biomass boilers are used since the buildings condition leaves no electrification choice. The role of natural and green gas is limited in pathway A. Some countries practically ban gas boilers, causing a significant decrease in installed gas boilers. In pathway A, we assume that policy makers prioritise other use cases for green gas, e.g., transport and some heavy industrial sectors, which are deemed to be more difficult to directly electrify. This translates into a share of green gas in 2030 of only 3%. In 2050, it is assumed that gas will be phased out. Until then, the gas share in the heating system is only used for a minor share of hybrid systems and remaining combustion boilers. This will result in the dismantling of the gas infrastructure on distribution grid level, with only locally remaining parts for industry. A heating system replacement rate of 4.4% in 2030 is assumed, hence an increase of around 30% compared to today’s system replacement rate of 3.5%. This is needed, despite the fact that the major share of newly installed systems is heat pumps, to reach the reduction in direct emissions defined in the CTP. To enable the electric heat pump technology, deep renovation of buildings will be necessary. The standard for deep renovated buildings aligns with the Zero Emission buildings (ZEB) standard defined in the EPBD. Electric heat pumps will also be installed in less efficient buildings if district heat or solid biomass aren’t available. The resulting mix and ambition level for renovation is shown in subsection 2.3.1.3. Because of the focus on electric heat pumps, there is a need for an extension of the electric power network, beyond the extension anyway needed for build out of renewable energies on the supply side and the electrification of other sectors, like mobility. The extension is necessary to ensure security of supply also during cold winter days, by enabling the power delivery during demand peak times. The extension of the electricity grid is complemented by additional generation capacity to ensure that there is also sufficient electricity available in peak times. Especially during windless winter weeks, where there is limited renewable electricity production, and a high heating demand, the grid and generation capacity will be challenged. The size of the grid extension and additional generation capacity assumed is calculated on the electric heat pump demand during the windless winter weeks (methodology on peak load calculation follows in section 2.3.2). ©2022 Guidehouse Inc. All rights reserved. Page 6
2.1.2.2 Pathway B

 Pathway B doesn’t focus on one single technology but instead takes a balanced technology
 mix into account for the heating of buildings. Besides electric heat pumps, pathway B also
 considers other technologies like hybrids and highly efficient boilers. Especially hybrid heat
 pumps will have a significant role. Additionally, thermally-driven heat pumps and micro-
 cogeneration (including fuel cells) have a higher share than in pathway A. To decarbonise
 the building sector with this mix of technologies, pathway B needs a significant amount of
 green gas, namely biomethane and hydrogen. In 2030, the green gas share should already
 be 19% of the total gas demand for the building sector. There are less objections against the
 installation of new condensing gas boilers from the regulator if electrification is no efficient
 solution and they are renewable-ready.

 A heating system replacement rate of 6% in 2030 is assumed in pathway B. This is
 combined with a focus on replacing old, inefficient heating systems. Thereby, a significant
 emission reduction is achieved within a couple of years – without a massive fuel switch
 necessary. Hybridisation (installation of a heat pump, in combination with an already existing
 efficient condensing boiler) allows for accelerated impacts on the stock of heating systems,
 even if the lifetime of heating systems is not yet at the end.

 The use of green gases and hybrid systems enables a lower average renovation depth
 which means taking pressure from ‘hard to abate’ buildings. Pathway B has therefore a
 lower renovation level than pathway A, but still considers an ambitious ZEB level until 2050.
 The resulting mix and ambition level for renovation is shown in subsection 2.3.1.3.

 The impact on the grid will be less drastic than in pathway A. Because of the use of multiple
 technologies, the electricity peak will be lower and thus the investment in grids and
 generation capacity limited. However, the gas grid and heating systems need to be
 retrofitted to enable green hydrogen blending. Besides retrofitting of some gas pipelines to
 dedicated hydrogen grids, this pathway doesn’t account for new dedicated infrastructure to
 be built.

 2.2 Key indicators
 Pathway A and B show different decarbonisation pathways to reach the climate targets in
 2030 and 2050. To compare which one of the two pathways would be more beneficial from a
 societal and individual household’s perspective, the indicators ‘end consumer costs’ and
 ‘system costs’ are used.

 End consumer costs reflect the costs that have to be paid by the consumer. These costs
 consist of building shell investments, replacement of heating systems and use of energy.
 With system costs, the additional infrastructure cost in the energy system, namely
 generation capacity, distribution and transmission network, is considered.

 The building shell costs are dependent on the renovation depth of the pathway and needed
 insulation levels. The heating system costs are based on the combination of a pathway’s
 heating mix and the replacement rate, hence the type and number of systems installed.
 Energy and infrastructure costs are both dependent on the chosen heat demand and energy
 mix. Energy costs are driven by the expected price developments for the different energy
 carriers. The modelling of the heating sector allowed to analyse future cost for heating in
 buildings.

 We assume that the future comfort level in the houses should be comparable to today's,
 meaning that the inside temperature in buildings is kept at a similar level. Providing this
 comfort level is challenging for a decarbonised building sector during a windless winter

©2022 Guidehouse Inc. All rights reserved.                                                     Page 7
week, where the heating demand is high and the production of renewable energy limited.
 During this period, there will be the need for additional generation capacity to cover the new
 electricity demand from heating. This capacity will likely have to come from low carbon
 gases, as these can buffer renewable energy systems. Short term storages, like electric
 battery storage, are not capable of balancing one week. They are only able to shift load for a
 couple of hours, maximum one day, but not more. The costs for additional generation,
 needed in the windless winter weeks, is captured in the infrastructure costs, as described in
 2.3.3.

 In both pathways, additional cost for gas infrastructure retrofitting for hydrogen readiness is
 considered. If the share of hydrogen is rather low and biomethane is used, not all gas
 infrastructure needs to be retrofitted (also considering significant less gas demand in total);
 also considering that hydrogen can be blended up to 20 vol.% to the existing natural gas grid
 and the EU is proposing to have already 3 vol.% by 2030 5. Additionally, the cost for so called
 ‘hydrogen valleys’ are not accounted for in the buildings sector, as they will be driven by
 other sectors like industry and transport.

 2.3 Modelling of the European buildings sector: BEAM² model
 In order to have a quantitative assessment as the basis for our argumentation, the European
 buildings sector is modelled. The used model has already been applied in various studies for
 the European Commission, like the impact assessment of the EPBD and is called BEAM².

 The following section describes which inputs are taken on by the model and defines the
 initial values used.

 2.3.1 Inputs to the building sector model

 The BEAM2 model is used to quantify the pathways and input on the key indicators, as listed
 in 2.3. A set of model inputs/outputs have been used as a baseline for the European building
 sector. The set of parameters is as follows:

     •    Building Stock Data as square meter distribution per reference building, age group
          and heating technology for the start year 2020
     •    EU Reference Zones dividing Europe’s Members States in five Reference Zones
          (Northern, North-Eastern, Western, South-Eastern and Southern Zone)
     •    Climate Data showing average monthly temperatures of the five Reference Zones
     •    Reference Buildings for three residential (SFH, SMFH, LMFH) and five Non-
          Residential Buildings (Office, Trade and Retail, Education, Touristic and Health, Other)
     •    Building shell efficiency levels for the Reference Buildings and their original level
          (not renovated and already renovated) per Reference Zone and Age Group
     •    Efficiencies of heating systems as system efficiencies per heating and hot water
          system
     •    Energy prices per Reference Zone
     •    GHG- and PE-factor developments from today until 2050

 5REPowerEU, 2022: https://energy.ec.europa.eu/system/files/2022-
 05/SWD_2022_230_1_EN_autre_document_travail_service_part1_v3.pdf

©2022 Guidehouse Inc. All rights reserved.                                                   Page 8
• Building Stock Development, meaning how shares of buildings’ different energy
performance levels within the total floor area will develop within the total building stock
as a result of the chosen pathway
• Investment costs for the measures in building stock and infrastructure (differ between
the climate zones)
Apart from the above “no-change” model inputs/boundary conditions the following
parameters change between pathways:
• Building shell efficiency levels for the Reference Buildings and their retrofit and new-
built levels per Reference Zone and Age Group will develop within the total building
stock
• Specific pathway Inputs, e.g., renovation rates or target levels for renovation
• GHG factor for gas because of different green gas shares
2.3.1.1 Definition of EU zones
The assessment with the BEAM² model is clustered in five zones, covering all member
states of the EU-27, see Figure 1. Impacts of different pathways are calculated for each of
these zones individually, since some key parameters (like climate, building stock etc.) differ
significantly and therefore will be treated separately. The analysis with BEAM² is done in
yearly timesteps until 2050.
©2022 Guidehouse Inc. All rights reserved. Page 9Figure 1 Reference Zones for the EU-27 2.3.1.2 Climate data For the five BEAM² Reference Zones Northern, North-Eastern, Western, South-Eastern and Southern shown in the previous section representative city climates 6 have been chosen. To reflect the future-oriented approach of the BEAM² model future climate data from 2030 (IPCC pathway B1) is used. 6 Northern: Stockholm; North-Eastern: Warsaw, Western: Brussels; South-Eastern: Bucharest; Southern: Basrcelona ©2022 Guidehouse Inc. All rights reserved. Page 10
Figure 2 shows the average monthly temperatures of the reference climates in the
 respective Reference Zones.

    Figure 2 Average monthly temperatures of the reference climates in the Reference
                                       Zones

                                                 Reference climates, average monthly temperatures
                                                               - per Reference Zone -
                                              30.0
    Average ambient temperature [°C]

                                              25.0

                                              20.0

                                              15.0

                                              10.0

                                               5.0

                                               0.0

                                              -5.0
                                                     Janua Febru Marc                                Augu Septe Octob Nove Dece
                                                                        April   May    June   July
                                                       ry   ary    h                                  st  mber   er   mber mber
                                       Northern       -0.1 -0.4   2.2   6.0     12.0   17.0   18.9   17.9 13.4 9.2     4.7  1.4
                                       Western        5.2   6.1   8.2   10.9    15.2   17.8   20.0   20.1 17.0 13.0 8.4     6.3
                                       North-Eastern 0.1    1.4   4.9   10.0    15.9   18.5   20.7   20.2 15.7 11.0 5.9     2.5
                                       South-Eastern -0.4   1.9   7.2   13.5    19.4   23.1   25.4   24.7 19.4 13.3 7.6     2.1
                                       Southern       10.2 11.4 13.6    15.7    19.5   23.4   27.0   27.0 23.4 19.2 14.2 11.3

 The climate data forms the foundation for determining the energy needs of the respective
 combinations of reference buildings (RB), age groups (AG) and retrofit levels (RL) on an
 hourly basis.

 2.3.1.3 Reference buildings

 The reference buildings are equal for both pathways, but the share per building type is
 different. Two different ambition levels are chosen for retrofitting and ZEB levels. The
 distribution of these building types differs per Pathway. A detailed description of the
 reference buildings used can be find in the appendix A.1. Here only representative case is
 shown to explain the methodology used (Figure 3).

 Figure 3 shows the different building categories that are considered. It depends on the year
 of construction (pre-1945, 1945 – 1990, 1991 – 2020 and post 2020) and the renovation
 standard. Beyond that, there are the different types of buildings, i.e., three residential (SFH,
 SMFH, LMFH) and five Non-Residential Buildings (Office, Trade and Retail, Education,
 Touristic and Health, Other). For each of them the categories in Figure 5 are calculated,
 respectively.

 The existing building stock is described with the six buildings on the very left. For the
 development of the building stock overtime the 30 building categories under ‘renovated
 buildings’ are chosen by the model plus the two ‘new building’ types for new construction.

©2022 Guidehouse Inc. All rights reserved.                                                                                 Page 11
Figure 3 Exemplary renovation level, expressed vie energy need, of SFH in zone West
Existing buildings Renovated buildings New buildings
SFH (West)
300
Useful energy demand [kWh/(m²a)]
250
200
150
100
50
0
not already retrofit retrofit retrofit ZEB ZEB new new zeb
renovated renovated ambitious restricted standard standard ambitious standard
pre 1945 1945-1990 1991-2020 post 2020
The renovation rates define how many square metres have transformed from the existing
buildings into renovated buildings each year and the new building rate defines how many
square metres of additional new buildings are added per year. While the renovation rate and
the new buildings rate are equal across the pathways, the share of each building category is
chosen differently.
Figure 4 shows what the different standards have as impact on the energy need.
Subsequently in Figure 5 the graph shows the share of each of these building standards that
is used in the two pathways. Buildings of similar type, but different depth of renovation are
labelled with A and B – in accordance with the scenario where they are mostly, not
exclusively, used.
©2022 Guidehouse Inc. All rights reserved. Page 12Figure 4 Difference in average energy need between the standards of pathway A and
pathway B
Demand per year [kWh/m²/a]
120 110 110
100
80
62
60
45 43
40 32
20
0
A B A B A B
Retrofit ZEB
before Restricted after
2035 2035
Figure 5 The shares of each renovation standard per pathway
10.000
9.000
Renovated area [Mio. m²]
8.000
7.000
6.000
5.000
4.000
3.000
2.000
1.000
0
A B A B A B
2030 2040 2050
Before 2035 (B) Restricted ZEB (A)
Before 2035 (A) ZEB (B)
©2022 Guidehouse Inc. All rights reserved. Page 132.3.1.4 Heating systems
The considered heating systems are listed in the following. It is to mention that the newly
installed gas condensing systems are assumed to be “hydrogen ready”. Solar is mainly
considered to provide hot water and has only minor reduction on space heat generation.
With the label heat pumps the study includes all systems, i.e., air-water, air-air and ground
source systems. Since the European building stock is dominantly based on hydronic heating
systems, the installation of hydronic heat pumps (air-water, ground source) is mainly
considered in this model. They have the advantage of being easier to implement in existing
hydronic distribution systems in buildings, being also more efficient in most building
configurations and allow for hybridisation of existing condensing boiler. Thereby, the CO2
saving potential is increased, more resilience for energy system and the implementation can
be realised faster.
Micro cogeneration, like fuel cells and thermally driven heat pumps are not considered
explicitly in the modelling. They can play a significant role for the decarbonisation of the
building stock in the future. However, due to their minor role today and the technology still
being in its infancy, they are not considered in the main model, but qualitatively.
The following heat generators were considered in the model:
• Gaseous fuel7, condensing (H2 ready)
• Gaseous fuel, non-condensing
• Liquid fuel, condensing (green liquid fuel ready)
• Liquid fuel, non-condensing
• Heat pump
• Hybrid heat pump
• District heating
• Solar (mainly for domestic hot water)
• Wood (boiler and stove)
• Electric-direct
Additional heat generators were considered qualitatively:
• Micro cogeneration (incl. fuel cells)
• Thermally driven heat pumps
The use of low temperature heat emitters (underfloor, low temperature radiators) has been
considered with relevant adaptation of heating systems.
2.3.1.5 Economic inputs
Inputs on investment costs and energy prices are described in the appendix A.2.1.
7 All boilers working with gaseous fuels are assumed to be able to use also biomethane
©2022 Guidehouse Inc. All rights reserved. Page 142.3.2 Determination of electricity peak load
One of the key indicators to determine which of the pathways is most beneficial is the
resulting electricity peak load from heating. Therefore, the assessment focuses on the worst-
case pathway which is a cold and windless winter week. This might be all the more
important, taking into account the parallel efforts needed to tackle the mobility challenge and
the expected increase in electricity demand from electric vehicles. However, this is not
modelled or considered in the cost communicated in this study.
Definition and implications of a windless winter week
The assumption is that during a windless winter week there will be limited renewable
electricity generation, since no wind is blowing, and it is mostly dark and cloudy. On the
other hand, the very cold temperatures lead to the situation that heating systems in
buildings are running at their maximum capacity. This situation lasts for at least one week.
While these circumstances have limited impact today, since most of the generation is still
flexible (conventional) and there is a limited amount of electric heating systems in the
building stock, this will change drastically in the future: With an electricity system having a
major share of renewable energies and a building stock with mostly electric heating
systems, i.e., heat pumps. Since it lasts one week, short term flexibility, like electric
batteries or most demand side flexibility, cannot be used to overcome the lack of firm
power generation. This must be provided by flexible conventional generation plants, i.e.,
gas power plants. Additionally, the huge amount of electricity needed for electric heating
systems will put constraints on the electricity transmission and distribution grids, hence,
grid extensions are necessary to prepare the energy system.
The peak will be mostly caused by all electric heat pumps, when looking at the future heating
system mix. To determine it two major steps are performed: (1) Determination of heat load
and (2) the resulting electricity peak.
First, to estimate the resulting heating load, the design power of all electric heating systems
in the reference buildings is determined (this excludes hybrid setups, where conventional,
condensing boilers can provide the heat in peak times). The design temperature of the
heating system depends on the geographical location and is assumed to be the average
temperature of the assessed winter week. Then, the design power of each reference building
is accumulated, according to the distribution of building types and retrofitting level in the
stock, as calculated by the model. The result is a heating peak load.
This is transformed into the resulting electricity peak load, by applying the efficiencies of the
heating system, plus some other considerations. With the latter, the limited options to
provide still flexibility to the power grid are considered. The efficiency of heat pumps is
reduced during the assessed winter week (compared to the average COP over the year)
since they operate around and below their design temperatures. It is important to note that
significantly higher efficiencies are applied as an average over the year. A summary of our
considerations is given in the following.
The calculated heating load is reduced (in both pathways) by 57%, to reflect the resulting
electricity peak load to the power grid. Single considerations and assumed measures that
lead to this reduction are:
• Even in peak times 50% of heat is still provided via heat pump, although with a very
low efficiency (around 2.0), while the other 50% are generated with a direct electric
heat element. In conclusion, we assume an overall coefficient of performance (COP)
of 1.5
©2022 Guidehouse Inc. All rights reserved. Page 15• 15% is covered with ground source heat pumps, that operate with a COP of 2.8
(under these conditions)
• Although the level of comfort is assumed to remain very similar to today, some minor
reductions are expected to be acceptable. Load shifting option of 2h/day is possible,
whereby the overall peak can be reduced by 15%
• Heat pumps are usually oversized. Although oversizing is expected to decrease in
time, we have assumed a factor of 10-20%. The additional power capacity available,
can be used to reduce the very peak by 15%, by using the mass of the building and
water contained in heat emitters as short-term thermal storage
2.3.3 Infrastructure cost assumptions and calculation
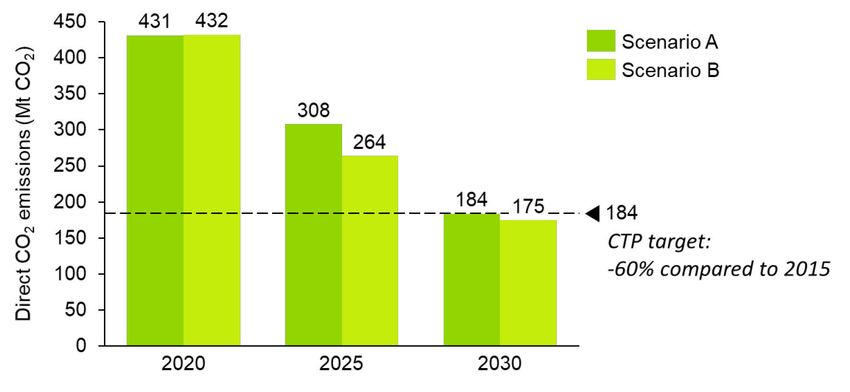
The additional grid infrastructure costs of the two pathways are calculated based on the
peak demand during the windless winter weeks. This period has the highest delta between
electricity peak caused by heating systems and power generation, and therefore represents
the peak that the distribution grid should be able to provide.
To calculate the infrastructure costs needed to cover the peak demand, we considered the
grid expansion costs and additional generation costs. The grid expansion costs are split
between TSO, high voltage, and DSO costs, low- and medium voltage. The average grid
expansion cost in Euro/kW for medium- and high voltage are derived from Ecofys 2016 8. For
low voltage investment costs, the study provided an average Euro/household/year, as the
low voltage grid extension is also dependent on the number of households with heat pumps.
The average electricity grid expansion costs from the Ecofys 2016 study 9 include OPEX,
assumed to be1.5% of annual CAPEX. The OPEX include the maintenance, net losses and
office costs. The investment costs take into account an interest rate of 5% but exclude
inflation predictions. There are two important technical assumptions. First, it is assumed that
the difference in infrastructure costs between rural areas and cities averages out over
regions, as rural areas need extra cable length while cities have higher digging costs.
Second, the economic lifetime of an asset is assumed to be 40 years. For the generation
costs, the peak is multiplied by the total costs of a power plant 10.
2.4 Additional assessments
The former chapters elaborate on the technical and economic aspects of the study. There
are two additional assessments executed to provide a broader perspective on the difference
between the two decarbonisation pathways presented. The first is the social considerations,
assessing the impact on a household level. The second is the country assessment,
analysing differences within the European Union.
2.4.1 Social considerations
For the comparison of the two pathways, we take into account additional social
considerations. As the overall end consumer cost analysis does not consider the social
reality of all building owners. In reality, the installation of a heat pump is most efficient in a
building with high efficiency standard, which most buildings do not have today. If the heater
breaks and the owner is obliged to install a heat pump, it is recommended to perform a
substantial renovation, including high capital investments. If the building owner does not
have the capital available there are two options: Installing a larger heat pump, that is more
8 https://www.netbeheernederland.nl/_upload/Files/Rapport_Ecofys_Waarde_van_Congestiemanagment_86.pdf
9 Costs are assumed to not change significantly from 2016 to 2021, since technology for transformers and
powerlines has been well developed over decades; only inflation adaption considered.
10 https://elib.dlr.de/135971/1/MuSeKo-Endbericht-2020-08-31.pdf
©2022 Guidehouse Inc. All rights reserved. Page 16expensive and will be oversized after future renovations or get a credit for the renovation. The first option would be probably more expensive over time and the second one implies capital cost or could lead to lower willingness to act in the first place. All these aspects should be considered when decarbonisation pathways are developed and compared. For the social considerations we compare renovation pathways and test their flexibility to the individual situation of the building and financial situation of the owners. The analysis helps to understand if these alternative pathways are significantly more expensive and which technologies are fit to do so. Since they usually take the retrofitting measures ‘step-by-step’ they are called staged renovations. To calculate the additional costs of the staged renovation approach, the methodology is to compare the cost of staged renovation with a 1-step renovation (deep renovation + heat pump). The comparison period is 30 years for both options. The costs that are considered for the analysis are CAPEX, OPEX and residual value of an installation. These are accumulated to compare the two approaches. 2.4.2 Country assessments The European Union has with its 27 countries a wide variety of building sector specifics. Differences can be caused by the heating mix, available energy carriers and complementing infrastructure of a specific country. Or by the buildings- and related energy system policies, and future climate plans of national governments. To illustrate these differences, we analyse the impact of the two pathways for five specific countries, spread over the EU climate zones. These five countries are: Germany, France, Italy, Spain and Poland. We create a factsheet for each individual country to showcase the country specific conclusions. ©2022 Guidehouse Inc. All rights reserved. Page 17
3. Results
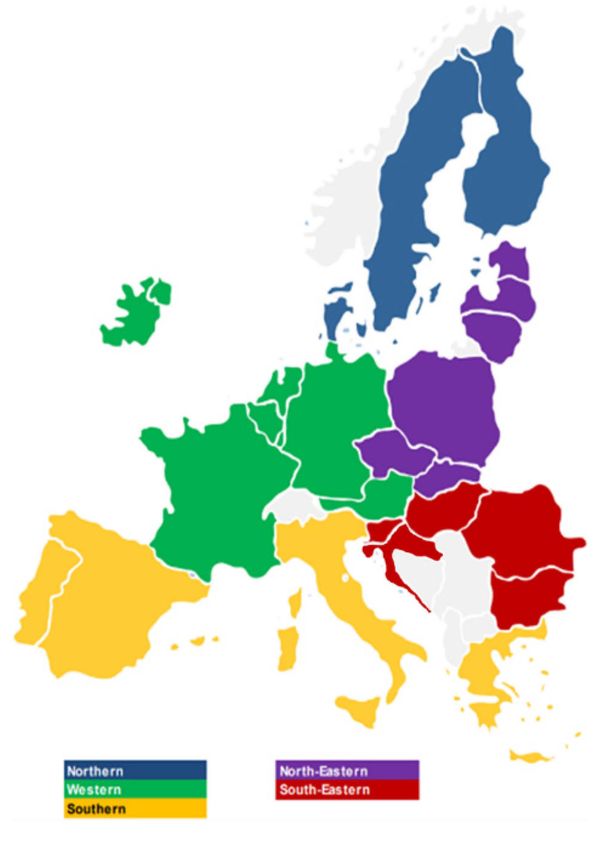
3.1 GHG emissions (2030/2050)
The EPBD set the target: All buildings should be zero emission buildings by 2050.
Additionally, buildings should only use carbon neutral energy carriers by 2050. Both
pathways reach the 2050 target of zero emission buildings, using only carbon neutral energy
carriers. For 2030 there is no specific target for the building sector defined by the FF55
package. However, the CTP defines the target of power & building sector together with -60%
GHG direct emission reduction compared to 2015. Direct emissions are fuels burned on site,
which excludes electricity and district heat. Both pathways reach the goal of direct emissions
savings in 2030. Pathway B will achieve the targets using an efficient fuel switch, also
considering individual situations, while pathway A has a massive fuel switch, without any
options.
Figure 6 Direct CO2 emissions in the EU buildings sector
3.2 Technology mix development
3.2.1 Pathway A
Pathway A has an emphasis on the use of electric heat pumps as the main decarbonisation
technology. This translated in the modelling results. From 2030 onwards, all electric heat
pumps have the highest share of heating system in the building stock. Hybrid heat pumps
have only a minor share and are mainly used as bridging technology. In 2050, the hybrid
heat pumps are phased out in Europe. Moreover, in 2050 there will be no gas used in the
building sector. Other technologies do play a role in the future technology mix of pathway A.
For example, biomass and district heat keep increase their current shares slightly towards
2050.
©2022 Guidehouse Inc. All rights reserved. Page 18You can also read