User's Manual Landfill Methane Outreach Program (LMOP) U.S. Environmental Protection Agency Washington, DC
←
→
Page content transcription
If your browser does not render page correctly, please read the page content below

User’s Manual

Landfill Methane Outreach Program (LMOP)
   U.S. Environmental Protection Agency
             Washington, DC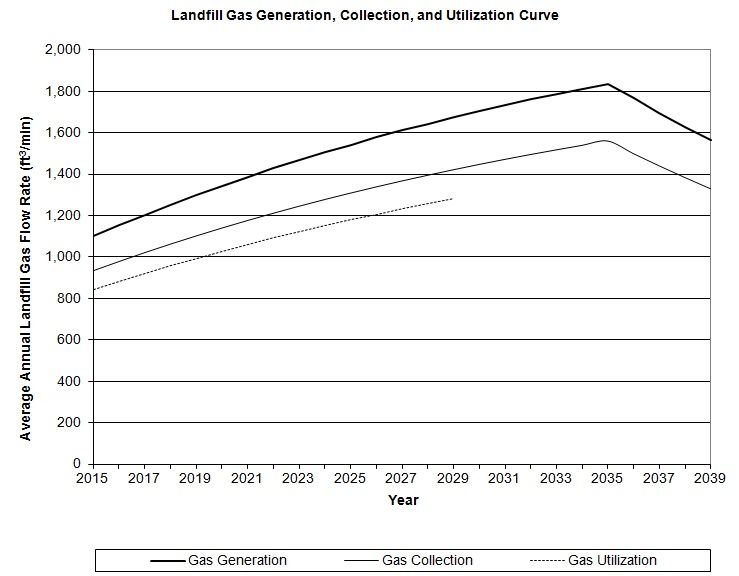
LFGcost-Web User’s Manual                                                                                                              Version 3.2

                                                      Table of Contents
Section                                                                                                                                      Page

Introduction ..................................................................................................................................... 1
Using LFGcost-Web ....................................................................................................................... 2
   Summary of Revisions ................................................................................................................ 2
   General Instructions and Guidelines ........................................................................................... 2
   Inputs........................................................................................................................................... 2
   Outputs ........................................................................................................................................ 3
   Calculators .................................................................................................................................. 3
   Summary Reports........................................................................................................................ 3
   Software Requirements ............................................................................................................... 4
   Cost Basis.................................................................................................................................... 4
   Cost Scope .................................................................................................................................. 5
   Cost Uncertainty ......................................................................................................................... 5
   Evaluating Economic Benefits and Job Creation........................................................................ 7
   Further Assistance ....................................................................................................................... 7
Technical Basis of LFGcost-Web ................................................................................................... 8
   INST: General Instructions and Guidelines ............................................................................... 9
   INP-OUT: Inputs / Outputs...................................................................................................... 10
   WASTE: Waste Calculator / Disposal History ........................................................................ 17
   REGIONAL PRICING: Regional Electricity Pricing ............................................................. 18
   CURVE: Landfill Gas Curve ................................................................................................... 19
   AVOIDED CO2 - ELEC: Regional Grid Carbon Dioxide Avoided Emission Factors ........... 20
   ENV: Environmental Benefits ................................................................................................. 21
   FLOW: Landfill Gas Flow Rate Calculations ......................................................................... 24
   C&F: Collection and Flaring System ....................................................................................... 26
   DIR: Direct-Use System .......................................................................................................... 27
   BLR: Boiler Retrofit ................................................................................................................ 28
   HBTU: High Btu Processing Plant .......................................................................................... 29
   CNG: Onsite CNG Production and Fueling Station ................................................................ 30
   LCH: Leachate Evaporator ...................................................................................................... 31
   TUR: Standard Turbine-Generator Set .................................................................................... 32
   ENG: Standard Reciprocating Engine-Generator Set .............................................................. 33
   MTUR: Microturbine–Generator Set ....................................................................................... 34
   SENG: Small Reciprocating Engine–Generator Set ................................................................ 35
   CHPE: CHP Reciprocating Engine-Generator Set .................................................................. 36
   CHPT: CHP Turbine-Generator Set ........................................................................................ 37
   CHPM: CHP Microturbine-Generator Set ............................................................................... 38
   ECN: Economic Analysis ........................................................................................................ 39
   BUDGET-ENG: Allocation of Recip. Engine Costs for Economic Benefitsa ........................ 42
   BUDGET-DIR: Allocation of Direct-Use Project Costs for Economic Benefitsa................... 44
   ECON-BEN SUMMARY: Economic Benefits and Job Creation Summarya ......................... 46
Appendix A: Default Value Documentation.............................................................................. A-1
Appendix B: Common Abbreviations ....................................................................................... B-1
Appendix C: Evaluating Projects with Multiple Equipment and/or Start Dates ....................... C-1

                                                                         ii
LFGcost-Web User’s Manual Version 3.2
Appendix D: Evaluating Local Government-Owned Projects................................................... D-1
Appendix E: Evaluating Boiler Retrofit Projects........................................................................E-1
Appendix F: Economic Multipliers for Economic Benefits and Job Creation Analysis ............ F-1
Appendix G: Ranking Analysis for Economic Multipliers ....................................................... G-1
iiiLFGcost-Web User’s Manual Version 3.2
List of Tables
Table 1. Worksheet Names and Functions in LFGcost-Web ......................................................... 8
Table 2. LFG Energy Project Types and Recommended Sizes ...................................................... 9
Table D-1. Recommended Default Assumptions for Local Government-Owned Projects ........ D-1
List of Figures
Figure 1. Example of LFG generation, collection, and utilization curve in LFGcost-Web ..... 19
Figure C-1. Example of a project with multiple equipment and start dates ............................... C-2
Figure C-1A. Example of an LFG generation, collection, and utilization curve for project
component A ............................................................................................................................... C-3
Figure C-1B. Example of an LFG generation, collection, and utilization curve for project
component B ............................................................................................................................... C-4
Figure C-1C. Example of an LFG generation, collection, and utilization curve for project
component C ............................................................................................................................... C-5
Background on the Model
LFGcost was initially developed in 2002 to help stakeholders estimate the costs of an LFG
energy project. Since then, LMOP has routinely updated the tool to reflect changes in the LFG
energy industry. In 2015, LMOP undertook a peer review of LFGcost-Web, Version 3.0. For
more information on the peer review, see the Emission Guidelines and Compliance Times for
Municipal Solid Waste Landfills rule docket (Docket ID# EPA-HQ-OAR-2014-0451-0210).
Based on the results of the peer review as well as other updates, LMOP revised certain elements
of the model, replacing it with LFGcost-Web, Version 3.1 in 2016. In May 2017, LMOP released
Version 3.2.
The LFGcost-Web, Version 3.2, model and user’s manual were prepared for EPA’s Landfill
Methane Outreach Program (LMOP) by Eastern Research Group, Inc. (ERG) with assistance and
data contributions from Cornerstone Environmental Group, LLC and Smith Gardner, Inc. and
data contributions from CPL Systems, Inc.
ivLFGcost-Web User’s Manual Version 3.2
Introduction
The Landfill Gas Energy Cost Model, LFGcost-Web, is a software tool developed for EPA’s
Landfill Methane Outreach Program (LMOP) to conduct initial economic analyses of prospective
landfill gas (LFG) energy recovery projects in the United States. Analyses performed using
LFGcost-Web are considered estimates and should be used for guidance only. A detailed
final feasibility assessment should be conducted by qualified LFG professionals prior to
preparing a system design, initiating construction, purchasing materials, or entering into
agreements to provide or purchase energy from an LFG energy project.
The software was created in Microsoft® Excel to make the computations transparent and to allow
for the model to be efficiently updated as the economics of LFG energy projects mature. This
document describes how to use the LFGcost-Web spreadsheet tool and presents the technical basis
underlying the software methodology.
The various LFG energy project types that can be analyzed in LFGcost-Web include:
New LFG collection and flaring systems (not expansion of existing systems);
Direct-use (boiler, greenhouse, etc.);
Boiler retrofit;
High Btu processing plant;
Onsite compressed natural gas (CNG) production and fueling station;
Leachate evaporators;
Seven different electricity generation project types:
o Standard turbine-generator sets
o Standard reciprocating engine-generator sets;
o Microturbine-generator sets;
o Small reciprocating engine-generator sets;
o Combined heat and power (CHP) reciprocating engine-generator sets;
o CHP turbine-generator sets; and
o CHP microturbine-generator sets.
LFGcost-Web is an LFG energy project cost estimating tool developed for EPA’s LMOP.
LFGcost-Web estimates LFG generation rates using a first-order decay equation. This
equation is used to estimate generation potential but cannot be considered an absolute
predictor of the rate of LFG generation. Variations in the rate and types of incoming waste,
site operating conditions, and moisture and temperature conditions may provide
substantial variations in the actual rates of generation.
The default inputs and costs estimated by LFGcost-Web are based on typical project designs
and for typical landfill situations. While the model allows a user to adjust certain inputs to
site- and project-specific conditions, the equations within the model are locked to maintain
the integrity of the model. The model attempts to include all equipment, site work, permits,
operating activities, and maintenance that would normally be required for constructing
and operating a typical project. However, individual landfills may require unique design
modifications which would add to the cost estimated by LFGcost-Web.
1LFGcost-Web User’s Manual Version 3.2
Using LFGcost-Web
Summary of Revisions
LFGcost-Web, Version 3.2, replaces Version 3.1. Significant revisions between Version 3.2 and
Version 3.1 of LFGcost-Web include:
Added ability to estimate job creation and regional economic ripple effects for the
following two project types: electricity generation with standard reciprocating engine-
generator sets and direct-use. Economic and job creation benefits are estimates only
and are not guaranteed.
Updated reference sources for calculating electricity prices and avoided CO2 grid factors
based on 2017 Annual Energy Outlook (AEO) regional electricity grids.
Updated default user inputs in Appendix A.
General Instructions and Guidelines
The first worksheet within LFGcost-Web (see INST worksheet) provides important instructions
on the proper use of LFGcost-Web. These instructions include the size ranges over which
LFGcost-Web is expected to be most accurate for a given project type. Within these size ranges
LFGcost-Web is estimated to have an accuracy of ± 30 to 50 percent. Using LFGcost-Web to
evaluate projects outside of these recommended ranges will likely provide cost estimates with a
greater uncertainty. The INST worksheet also provides definitions of input and output parameters,
outlines the organization of LFGcost-Web, and summarizes important notes described below
regarding the model and its functionality.
Detailed information about running the model for unique project scenarios is contained in
Appendices C, D, and E. Appendix C provides guidance for evaluating projects with multiple
equipment and/or start dates, Appendix D outlines the suggested inputs for local government-
owned projects, and Appendix E explains how to set up and interpret results for boiler retrofit
projects.
Inputs
The second worksheet of LFGcost-Web (see INP-OUT worksheet) is where users enter the
required input data for evaluating an LFG energy project. In this worksheet, the Required User
Inputs table allows users to enter the minimum input parameters required for conducting an
economic analysis. The Optional User Inputs table gives users the option to adjust the default
input parameters used by LFGcost-Web. If these optional input parameters are not known for the
project being evaluated, the default parameters should provide a reasonable economic evaluation
of the project.
2LFGcost-Web User’s Manual Version 3.2
Outputs
The INP-OUT worksheet summarizes the results of the economic and environmental analysis
performed by LFGcost-Web in the Outputs table. This table has been arranged so users of
LFGcost-Web are able to change the project design and immediately see the resulting change in
economic analysis, without having to switch to another worksheet in LFGcost-Web. Most users of
LFGcost-Web will not need to look at other worksheets in LFGcost-Web when conducting a
routine economic analysis.
Calculators
LFGcost-Web provides two calculators to assist model users. The Waste Acceptance Rate
Calculator in the WASTE worksheet calculates the average annual waste acceptance rate based
on the amount of waste-in-place and the year representing the time required to accumulate this
waste. Model users who do not know the average annual waste acceptance rate for a particular
landfill can use this calculator to estimate this rate.
The Financial Goals Calculator, located below the Outputs table in the INP-OUT worksheet,
calculates the initial product price that would be required for the project to achieve its financial
goals. It is assumed that financial goals are achieved when the internal rate of return (IRR) equals
the discount rate and the net present value is equal to $0. If a given economic analysis does not
achieve its financial goals or greatly exceeds the goals, model users can use this calculator to
determine the initial product price that is required to pay back the investment within the lifetime
of the project.
Model users must select “Enable Macros” when prompted (immediately after opening the file) to
allow the LFGcost-Web software to use the embedded macros that control the operation of the
Financial Goals Calculator. Enabling macros is discussed further in the “Software Requirements”
section below. The Financial Goals Calculator can be used ONLY when macros are enabled and
the Solver Add-in has been installed and loaded within Microsoft® Excel. Please see the
instructions below the Calculate Initial Product Price button in the INP-OUT worksheet to load
the Solver Add-in. This functionality is not compatible with Mac computers.
Summary Reports
The first summary report (see REPORT worksheet) presents input, output, and curve information
similar to data found in the INP-OUT and CURVE worksheets. The printout will be labeled with
the landfill name or identifier that has been entered at the top of the INP-OUT worksheet as well
as the file name and current date. The appropriate initial product price needed to achieve financial
goals must be determined for each LFG energy project scenario using the Financial Goals
Calculator in order for the correct financial goal prices to appear in the report.
The second summary report (see RPT-CASHFLOW worksheet) presents a detailed summary of
the project cash flow analysis using data similar to data found in the ECN worksheet. Given the
detailed nature of this spreadsheet, it may be appropriate to include only for certain scenarios.
The third summary report (see ECON-BEN SUMMARY worksheet) presents the regional
economic benefits and job creation estimates for the following two project types: electricity
generation with standard reciprocating engines and direct-use.
An Adobe Portable Document Format (PDF) of the summary reports can be created from the
REPORT, RPT-CASHFLOW, and/or ECON-BEN SUMMARY worksheets in order to save or
distribute read-only electronic copies. In order to create a PDF of the reports users must have a
3LFGcost-Web User’s Manual Version 3.2
printer driver installed on their computer that has the capability to convert files to this format (for
example, PDF995 or Adobe Acrobat). With this PDF printer driver installed, users can follow the
steps listed below to create a PDF of the summary reports.
1. Select the worksheet tab(s) you are interested in printing.
2. Select Print from the menu.
3. Select the PDF printer driver (e.g., PDF995) from the Printer drop-down menu and click
OK.
4. Once the PDF dialog box appears in a new window, users can preview the report and save
it to a file location of their choice. If using Adobe Acrobat, users can also specify which
worksheets to include in the .pdf file.
More information about downloading and purchasing PDF printer drivers can be obtained at
http://www.pdf995.com/ or http://www.adobe.com.
Software Requirements
LFGcost-Web has been specified as a “Read-Only” file. The “Read-Only” restriction is intended
to protect the original file from being accidentally over-written by users. You need to save a copy
of the LFGcost-Web file under a new file name when running each economic analysis.
The LFGcost-Web model was created in Microsoft® Excel and must be operated in a Microsoft®
Excel 2007, 2010, 2013, or 2016 environment. Earlier versions of Microsoft® Excel are not able
to properly run the model due to embedded macros. Several functions operate slowly when running
LFGcost-Web on computers that have a processor speed of 333 MHz or less. This model was
tested on a PC. The Solver functionality does not work on a Mac.
Model users must “Enable Macros” when prompted (immediately after opening the file) to
allow the LFGcost-Web software to use the embedded macros.
Microsoft® Excel 2007, 2010, 2013, and 2016 users must set their Macro Security Level to
“Disable all macros with notification” (menu select Developer…Macro Security). [If the
Developer menu is not displayed in Excel 2007, click the Microsoft Office Button, select Excel
Options, and then in the Popular category, under Top options for working with Excel, select Show
Developer tab in the Ribbon. If the Developer menu is not displayed in Excel 2010, 2013, 2016,
on the File menu, select Options, and then in the Customize Ribbon category, under Customize the
Ribbon, check the Developer box.] Then, upon opening LFGcost-Web, users must select “Enable
this content” from the Security Warning – Options… box that appears beneath the menu.
Cost Basis
The costs and economic parameters, such as net present value (NPV), are based on actual or
“nominal” rates and include the effects of inflation. For example, if a project was constructed in
2013 and began operation in 2014, then installed capital costs in the year of construction are in
2013 dollars, operating costs for the initial year of operation are in 2014 dollars, and NPV at year
of construction is in 2013 dollars. Within the structure of the various cost estimating worksheets
in LFGcost-Web, the costs for any given year in the life of the project are presented in that specific
year’s dollars.
4LFGcost-Web User’s Manual Version 3.2
Cost Scope
The cost estimates produced by LFGcost-Web include all direct and indirect costs associated with
the project. In addition to the direct costs for equipment and installation, LFGcost-Web includes
indirect costs associated with:
Engineering, design, and administration;
Site surveys and preparation;
Permits, right-of-ways, and fees; and
Mobilization/demobilization of construction equipment.
Since these costs are estimated for an average project site in the United States, individual sites will
experience variations to these costs due to unique site conditions.
Cost Uncertainty
The uncertainty in the cost estimates produced by LFGcost-Web is estimated to be + 30 to
50 percent. As detailed in the list below, this uncertainty is a composite of uncertainties related to
LFG generation rates, future economic conditions, and unique site characteristics.
The uncertainty of + 30 to 50 percent is estimated based on the following:
Equipment used in the actual LFG energy project may need to be purchased at a larger size
than what is estimated by LFGcost-Web, because the standard equipment sizes vary from
one manufacturer to another. This may result in an underestimate of the actual costs.
Unusual site conditions may limit the type of LFG energy project that could be selected or
require additional site preparation and equipment. This may result in an underestimate of
the actual costs.
Environmental or permitting constraints may lead to higher costs. This can vary from
additional air pollution controls to increased equipment maintenance. This may result in an
underestimate of the actual costs.
Regional construction cost differences within the United States may result in either an
overestimate or an underestimate of the actual costs, depending on the region where the
landfill is located.
More specifically, the uncertainty of various project components can vary based on site-specific
or project-specific needs. Below is a summary of factors affecting the gas collection and control
system components, electricity-generating project components, and direct-use project
components:
5LFGcost-Web User’s Manual Version 3.2
Gas Collection and Control Systems (GCCS) Components and Cost Factors
Component / Attribute Key Site-Specific Factors
Gas collection wells or connectors • Area and depth of waste
• Spacing of wells or connectors
Gas piping • LFG flow rate
• Length of piping required
Condensation knockout drum • Volume of drum required
Blower • Size of blower required (a function of LFG flow
rate)
Flare • Type of flare (open, ground, or elevated)
• Size of flare (a function of LFG flow rate)
Instrumentation and control system • Types of controls required
Electricity-Generating Project Components and Cost Factors
Component / Attribute Key Site-Specific Factors
Engine size • Flow rate (gas curve)
• Electricity rate structures
• Minimum electricity generation requirements
(contract obligations)
Capacity to expand • Maximum flow rate
• LFG flow rate over time (gas curve)
Gas compression and treatment • Quality of the LFG (methane content)
equipment • Contaminants (e.g., siloxane, hydrogen sulfide)
Interconnection equipment • Project size
• Local utility requirements and policies
Direct-Use Project Components and Cost Factors
Component / Attribute Key Site-Specific Factors
End use of the LFG • Type of equipment (e.g., boiler, process heater, kiln
furnace)
• LFG flow rate over time
• Requirements to modify existing equipment to use
LFG
Gas compression and treatment • Quality of the LFG (methane content)
equipment • Contaminants and moisture removal requirements
• Filtration requirements
Gas pipeline • Length (distance to the end use)
• Obstacles along the pipeline route
• LFG flow rate
Condensate management system • Length of the gas pipeline
6LFGcost-Web User’s Manual Version 3.2
Evaluating Economic Benefits and Job Creation
LFG energy projects generate benefits for the communities and states in which they are located,
as well as for the United States as a whole. These benefits include new jobs and expenditures
directly impacting the local and state-wide economies as a result of the construction and operation
of an LFG energy project. In addition, there are indirect economic benefits when the direct
expenditures for an LFG energy project flow through the economy resulting in increased overall
economic production and economic activity within the local, state, and national economies.
While in the construction phase, an LFG energy project provides a one-time boost to the local and
state economies whereas the operation and maintenance (O&M) of the project generates ongoing
economic activity throughout the lifetime of the project. The annual impacts use the estimated
expenditures during the first year of the project’s operation to estimate the annual economic
benefits during the O&M phase.
The LFGcost-Web model allocates the estimated capital and O&M costs for reciprocating engine
and direct-use projects to various wholesale trade and industrial manufacturing sectors in order to
estimate the regional economic benefits of the project. Here, the “region” is defined to be the state
where the project is constructed and so its output will include any benefit to the local and state
economies resulting from LFG energy project expenditures. The cost of large or specialized
components, or specialized engineering and design labor likely to be manufactured or hired outside
of the state, is not included in the state-wide impacts estimates. A specific description of how
project costs are allocated to each industry multiplier is presented in the BUDGET-DIR and
BUDGET-ENG sections of this user’s manual.
The model allows the user to select a specific state in the BUDGET-DIR and BUDGET-ENG
worksheets to represent where the project is constructed. Alternatively, if you leave the state blank
and want to know the general economic benefits resulting from an LFG energy project, regardless
of the state, you can review the outputs provided for states representing the median (Oregon) and
upper (Indiana) and lower (Iowa) quartiles for both employment and economic output in the
ECON-BEN SUMMARY sheet. A summary of the multipliers and how the multipliers were
ranked according to their employment and economic output is shown in Appendices F and G.
The Bureau of Economic Analysis (BEA) does not endorse any resulting estimates and/or
conclusions about the economic impact of a proposed change on an area.
Further Assistance
If you would like assistance using LFGcost-Web, please contact LMOP through the website at
https://www.epa.gov/lmop/forms/contact-us-about-landfill-methane-outreach-program.
Analyses performed using LFGcost-Web are considered estimates and should be used for
guidance only. A detailed final feasibility assessment should be conducted by qualified LFG
professionals prior to preparing a system design, initiating construction, purchasing
materials, or entering into agreements to provide or purchase energy from an LFG energy
project.
7LFGcost-Web User’s Manual Version 3.2
Technical Basis of LFGcost-Web
Table 1 lists the worksheets that comprise the LFGcost-Web spreadsheet model. The following
sections document the design and technical basis of the contents of these worksheets.
Table 1. Worksheet Names and Functions in LFGcost-Web
Worksheet Name Function
INST General instructions and guidelines
INP-OUT Required and optional user inputs and model output results
WASTE Optional user inputs for annual waste acceptance data
REGIONAL PRICING Regional power grid price reference
REPORT Summary report of user inputs, model outputs, and curve
RPT-CASHFLOW Detailed summary of 15-year cash flow analysis
CURVE Landfill gas generation, collection, and utilization curve
AVOIDED CO2-
ELEC Regional power grid emission factors reference
ENV Environmental benefits calculations
FLOW Landfill gas generation, collection, and utilization calculations
C&F Design and costing of new collection and flaring system
DIR Design and costing of direct-use of landfill gas
BLR Design and costing of boiler retrofit
HBTU Design and costing of high Btu processing plant
CNG Design and costing of onsite CNG production and fueling station
LCH Design and costing of leachate evaporator
TUR Design and costing of standard turbine-generator set
ENG Design and costing of standard reciprocating engine-generator set
MTUR Design and costing of microturbine-generator set
SENG Design and costing of small reciprocating engine-generator set
CHPE Design and costing of CHP reciprocating engine-generator set
CHPT Design and costing of CHP turbine-generator set
CHPM Design and costing of CHP microturbine-generator set
ECN Economic analysis (cash flow) calculations
BUDGET-ENG Allocates recip. engine project costs to calculate economic benefits
BUDGET-DIR Allocates direct-use project costs to calculate economic benefits
ECON-BEN
SUMMARY Summary of economic benefits and job creation analysis
8LFGcost-Web User’s Manual Version 3.2
INST: General Instructions and Guidelines
Glossary of Input and Output Parameters – The definitions contained within these two tables
in the model are provided in the “INP-OUT: Inputs/Outputs” section below.
LFG Energy Project Types and Recommended Sizes – This table outlines the 12 LFG energy
project types included in LFGcost-Web, as shown in Table 2 below. In addition, project sizes
are recommended for each type of LFG energy project, with units varying by project type as
follows:
− Direct-use, boiler retrofit, high Btu, and CNG projects - cubic feet per minute (ft3/min) of LFG.
− Leachate evaporator projects - gallons of leachate evaporated per day.
− Projects generating electricity (engines, turbines, and microturbines) - amount of electricity
generated in kilowatts (kW) or megawatts (MW).
LFGcost-Web is designed to accommodate the recommended size ranges given for each type of LFG
energy project. Model output results may not be valid for project sizes outside of the recommended
project size ranges.
Workbook Design – This table summarizes the name and function for each of the
27 worksheets contained in LFGcost-Web, as shown in Table 1 above.
Important Notes – The items listed under Important Notes in the model are described in more
detail in the “Using LFGcost-Web” section above.
Table 2. LFG Energy Project Types and Recommended Sizes
LFG Energy Project Type Recommended Project Size
Direct-use (Boiler, Greenhouse, etc.) 400 to 3,000 ft3/min LFG
Boiler Retrofit Less than or equal to 3,000 ft3/min LFG
High Btu Processing Plant 1,000 to 10,000 ft3/min LFG
Onsite CNG Production and Fueling Station 50 to 600 ft3/min LFG
Leachate Evaporators 5,000 gallons leachate per day and greater
Standard Turbine-Generator Sets Greater than 3 MW
Standard Reciprocating Engine-Generator Sets 800 kW and greater
Microturbine-Generator Sets 30 to 750 kW
Small Reciprocating Engine-Generator Sets 100 kW to 1 MW
CHP Reciprocating Engine-Generator Sets 800 kW and greater
CHP Turbine-Generator Sets Greater than 3 MW
CHP Microturbine-Generator Sets 30 to 300 kW
9LFGcost-Web User’s Manual Version 3.2
INP-OUT: Inputs / Outputs
Required User Inputs – These inputs MUST be entered in order to properly characterize the
landfill and project parameters. Defaults are not provided for the required inputs because they are
unique for each landfill and project.
− Year landfill opened – Four-digit year that the landfill opened or is planning to open.
− Year of landfill closure – Four-digit year that the landfill closed or is expected to close.
− Area of LFG wellfield to supply project – Acreage of the landfill that contains waste and generates
LFG to be collected and utilized by the LFG energy project. The model assumes one well per acre to
determine vertical gas well, wellhead, pipe gathering system, and other costs for the collection and
flaring system. Acreage should represent area of landfill for gas collection to feed project, not total
landfill area. Gas collection and flaring cost estimates represent a complete new system (costs for
expansion of an existing system will be higher); inaccurate cost estimates may result for smaller landfill
areas (LFGcost-Web User’s Manual Version 3.2
INP-OUT: Inputs / Outputs
Required User Inputs (continued)
− For Direct-use, High Btu, and CHP projects: Distance between landfill and end use, pipeline, or
CHP unit
- For direct-use projects, the number of miles between the landfill and the end user of the LFG. When
costs are combined for direct-use and boiler retrofit projects, this input is the distance from the landfill
to the end user’s property boundary.
- For high Btu projects, the number of miles between the landfill and the natural gas pipeline or the end
user of the high Btu gas.
- For CHP projects, the number of miles between the landfill and the CHP engine, turbine, or
microturbine.
To maintain integrity of the cost estimates, this distance should be limited to 10 miles or less.
− For CHP projects: Distance between CHP unit and hot water/steam user – Number of miles between
the CHP engine, turbine, or microturbine and the end user of the hot water/steam. To maintain integrity
of the cost estimates, this distance should be limited to 1 mile or less. The CHP unit and the hot
water/steam user are typically co-located, which would be a distance of zero (0) miles.
− Year LFG energy project begins operation – Four-digit year that the LFG energy project installation
will be complete and begin operating. The model requires the year to be between 2010 and 2025.
− Will model calculate avoided CO2 from energy generation at electricity projects? – Determines if
avoided CO2 emissions will be calculated by the model for electricity projects.
- Select Y (for yes) if you prefer the model to calculate these emissions. Then go to the AVOIDED
CO2- ELEC worksheet to select the appropriate grid factor, using AEO 2017 data, or follow the
instructions in the AVOIDED CO2- ELEC worksheet to select the grid factor for another year of AEO
data.
- Select N (for no) if you do not want to calculate the avoided emissions for electricity projects.
Note: avoided emissions for non-electricity generating projects will be calculated, regardless of selection.
Optional User Inputs – These inputs are initially set to the suggested defaults provided. To edit the
optional inputs, enter the requested input in the Optional User Input Data column. (Note: Data in
the Suggested Default Data column are protected and cannot be edited.)
− LFG energy project size – Pick list to choose LFG flow rate over the project life used to design the LFG
energy project – Minimum, Average, Maximum, or Defined by user. When ‘Defined by user’ is selected,
an LFG design flow rate MUST be entered in the input box below the LFG energy project size selection.
The default is for minimum LFG generation. However, the optimum project size will vary for different
project types. You are encouraged to try multiple size options to determine the optimum size for your
project conditions.
- For direct-use projects, the optimum size is often based on the maximum gas flow.
- The optimum size for electricity generation projects (including CHP) is often based on the average
flow.
− For user-defined project size only: Design flow rate – The design LFG flow rate, in cubic feet per
minute, entered for projects sized manually by users. ‘Defined by user’ MUST be selected for LFG energy
project size to indicate the project size is user-defined. A user-defined project size can be entered without
waste data. Since waste data are used to calculate flowrate, you will receive a warning message indicating
that the user-defined project size exceeds the maximum calculated LFG flowrate in cell AG28 of the
FLOW worksheet. Further, if you are using waste data to estimate flowrate, this warning message is
indicating that the landfill may not have enough gas available for this project.
11LFGcost-Web User’s Manual Version 3.2
INP-OUT: Inputs / Outputs
Optional User Inputs (continued)
− Methane generation rate constant, k – The methane generation constant (k) used to determine the
amount of LFG generated generally varies depending on the climate of the area surrounding the landfill.
There are three k values to choose from: 0.04 per year for areas that receive 25 inches or more of rain
annually; 0.02 per year for drier (arid) areas that receive less than 25 inches of rain annually; or 0.1 per
year for bioreactors. The suggested default is 0.04 per year for typical climates. The k value entered should
equal one of these suggested values unless site-specific data are available. k values are discussed further
in the “FLOW: Landfill Gas Flow Rate Calculations” section below.
− Potential methane generation capacity of waste, LO – The potential methane generation capacity of the
waste (LO) in cubic feet per ton. This parameter primarily depends on the type of waste in the landfill. The
default of 3,204 cubic feet per ton should be used to represent MSW unless site-specific data are available.
LO values are discussed further in the “FLOW: Landfill Gas Flow Rate Calculations” section below.
− Methane content of landfill gas – The methane content of LFG generally ranges between 45 and
60 percent. This parameter is used to calculate environmental benefits and normalize LFG production.
The default of 50 percent should be used unless site-specific data are available.
− Average depth of landfill waste – The average depth of the landfill waste (in feet) is used to estimate
costs of the vertical gas wells for the new collection and flaring system (not expansion of existing system).
The suggested default is 65 feet, but this should be changed if site-specific average waste depth is known
for the landfill.
− Landfill gas collection efficiency – The equipment used to collect LFG normally operates at efficiencies
between 70 and 95 percent. The suggested default is 85 percent.
− Utilization of CHP hot water/steam potential – For CHP projects, the percent of hot water/steam used
by the end user, out of the potential hot water/steam generated by the CHP unit. The range for the
utilization is between 0 and 100 percent. The suggested default is 100 percent.
− Expected LFG energy project lifetime – Estimated number of years that the LFG energy project will be
operating. The default project lifetime is 15 years, but the model sets the lifetime to 10 years for
microturbines (non-CHP applications). The project lifetime for all other project types should be greater
than or equal to 10 years, but cannot exceed 15 years.
Generally, 15 years is considered the average lifetime for the equipment installed in LFG energy projects
and thus, the longest period over which to evaluate project economics. In addition, LFGcost-Web uses the
project lifetime for determining the tax-based capital depreciation rate. In Section 179 of the 2001 Federal
Tax Code, the IRS recommends using 15 years for the depreciation of electricity and fuel pipeline projects
that are analogous to LFG energy projects. For these reasons, the default project lifetime is 15 years and
it is recommended not to use a value of less than 10 years or more than 15 years. However, microturbine
projects (non-CHP applications) should be set to a project lifetime of 10 years to match their expected life
of 10 years, as observed by manufacturers of LFG microturbines.
− Operating schedule – For all projects except leachate evaporators, the LFG may be used seasonally (e.g.,
for space heating six months out of the year). This parameter allows users to specify how many hours of
the day, days of the week, and weeks of the year the project will be requiring LFG. The suggested defaults
are 24 hours per day, 7 days per week, and 52.14 weeks per year to result in the maximum operating
schedule of 8,760 hours per year.
12LFGcost-Web User’s Manual Version 3.2
INP-OUT: Inputs / Outputs
Optional User Inputs (continued)
− Global warming potential (GWP) of methane – The suggested default GWP of methane is 25 to reflect
the Fourth Assessment Report (AR4) of the Intergovernmental Panel on Climate Change (IPCC). This
parameter is used to calculate environmental benefits and direct methane reductions for greenhouse gas
reduction credits. This default is consistent with the use of IPCC AR4 GWP values by the annual national
U.S. GHG inventory submitted to the UNFCCC and emissions reported by large facilities and industrial
suppliers to EPA's Greenhouse Gas Reporting Program. Users may enter an alternate GWP value, if
desired.
− Will cost of metering station that serves as custody transfer point be borne by end user? – For boiler
retrofit projects, determines if the cost to install a metering station will be incurred by the end user
because it will serve as a custody transfer point.
− Select Y (for yes) if metering station costs will be included.
− Select N (for no) if metering station costs will not be included.
The suggested default is Y, to include metering station costs.
− Loan lifetime – The period over which the project loan will be repaid. The loan lifetime is assumed to
begin during the year of project design and construction. It is common for project loan periods to be
limited to half or two-thirds of the equipment lifetime to assure that the loan is repaid before the project
ends. Since much of the equipment used in LFG energy projects has a projected lifetime of 15 years, the
default loan lifetime is set to 10 years. However, loan lifetime should not exceed the project lifetime,
because it is not practical to assume that project financing would exceed the expected life of the project
equipment and revenues. See Appendix A for additional information.
− Interest rate – The actual or “nominal” interest rate of the project loan. The suggested default is 6 percent
based on recent Moody Corporate AAA and BAA bond rates published by the Federal Reserve. See
Appendix A for additional information.
− General inflation rate – The inflation rate applied to operation and maintenance (O&M) costs. The
suggested default is 2.5 percent based on recent Consumer Price Indexes. See Appendix A for additional
information.
− Equipment inflation rate – The inflation rate applied to project equipment (capital) costs. The suggested
default is 2 percent based on recent plant construction cost indices. See Appendix A for additional
information.
− Marginal tax rate – The tax rate used to estimate tax payments; this item is not applicable to projects
funded and developed by local governments. For publicly owned projects, see Appendix D (Evaluating
Local Government-Owned Projects). The suggested default tax rate is 35 percent for projects funded and
developed by private entities, which is based on recent LFG energy project experience with commercial
projects. See Appendix A for additional information.
− Discount rate – The discount rate, or hurdle rate, is used to determine the present value of future cash
flows. This rate represents the internal time-value of money (on an actual or “nominal” basis) used by
companies to evaluate projects. The suggested default is 8 percent based on recent LFG energy project
experience with commercial projects. See Appendix A for additional information.
− Down payment – The down payment on the project loan. The suggested default is 20 percent based on
recent LFG energy project experience with commercial projects. See Appendix A for additional
information.
13LFGcost-Web User’s Manual Version 3.2
INP-OUT: Inputs / Outputs
Optional User Inputs (continued)
− Energy tax credits – Energy tax credits may be available for LFG utilization projects in select areas.
These energy tax credits include LFG or high Btu utilization ($/million Btu) and electricity generation
($/kWh). Municipalities installing LFG energy projects are generally tax exempt and are not directly
eligible for tax credits. In these instances, the values for the tax credits should be entered as zero.
However, a municipality may arrange to sell the tax credits to a third party. In this situation, only the
third-party payment to the municipality, provided in return for the tax credit, should be entered as energy
tax credits in LFGcost-Web. All of the default values are initialized to zero.
− Direct credits – Other credits can be evaluated for special situations. All of the default values are
initialized to zero.
- Greenhouse gas reduction credit ($/MTCO2E) – for direct methane reductions from the landfill and
avoided carbon dioxide generated from displacing fossil fuels (in units of $ per metric ton of carbon
dioxide equivalents). Direct methane reductions (i.e., methane collected and either flared or utilized
in an LFG energy project) may contribute to this credit if the landfill is not required to collect and
combust LFG (e.g., complying with the NSPS/EG). You have the option of including (Y for yes) or
excluding (N for No) direct methane reductions. The suggested default is Y, to include direct methane
reductions.
- Renewable electricity credit ($/kWh) – represents tradable renewable certificates (TRCs) or “green
tags” that are created when a renewable energy facility generates electricity (in units of $ per
kilowatt-hour). Each unique certificate represents all of the environmental benefits of a specific
quantity of renewable electricity generation, namely the benefits received when fossil fuels are
displaced.
- Renewable fuel credit ($/gallon) – for alternative vehicle fuel (CNG) projects, including projects
with Renewable Identification Numbers (RINs) where a gallon of renewable fuel produced in or
imported into the United States receives a credit.
- Avoided leachate disposal ($/gallon) – for leachate disposal costs previously incurred for leachate
evaporator projects.
- Construction grant ($) – a government cash grant for project capital costs.
− Royalty payment for landfill gas utilization – Project developers that do not own the LFG may be
required to pay the landfill owner a royalty for the amount of gas utilized (in units of $ per million Btu).
The default is initialized to zero.
− Initial year product price – Initial year product prices are suggested for the sale of energy from the
project. These prices represent the initial year of project operation. See Appendix A for additional
information and documentation of the review of current product prices used to determine the following
suggested default prices:
- Landfill gas production – $1.75/million Btu
- Electricity generation – $0.065/kWh
- CHP hot water/steam production – $4.50/million Btu
- High Btu gas production – $2.75/million Btu
- CNG production – $2.00/gasoline gallon equivalent (GGE) [to determine $/diesel gallon equivalent
(DGE), divide $/GGE by 0.866]
14LFGcost-Web User’s Manual Version 3.2
INP-OUT: Inputs / Outputs
Optional User Inputs (continued)
− Annual product price escalation rate – The initial year product price will be escalated by this annual
value in the future years of the project. The suggested default is 1 percent, and represents an escalation
in real prices as discussed in Appendix A.
− Electricity purchase price for projects NOT generating electricity – The price for electricity
purchased by projects that do not generate their own electricity, such as direct-use projects. The suggested
default is $0.087 per kWh, as discussed in Appendix A.
− Annual electricity purchase price escalation rate – The annual escalation rate applied to purchased
electricity. The suggested default is 1 percent, as discussed in Appendix A.
Outputs – Results of the economic analysis and environmental benefits. Economic outputs are
discussed further in the “ECN: Economic Analysis” section below.
Economic Analysis (Individual project costs can vary by +30-50% due to situational factors):
− Design project size – For all projects except leachate evaporators, the amount of LFG (in cubic feet per
minute) used to determine the design flow rate of the project.
− Generating capacity for projects generating electricity – For electricity generation projects, the
generation capacity (in kilowatts) of the power producing equipment.
− Average project size for projects NOT generating electricity – For direct-use, boiler retrofit, high Btu,
CNG, and leachate evaporator projects, average project size represents the average amount of actual LFG
utilized over the lifetime of the LFG energy project. This output is presented in units of million cubic
feet per year and cubic feet per minute.
− Average project size for projects generating electricity – For engine, turbine, microturbine, and CHP
projects, average project size represents average annual kilowatt-hours of electricity generated (net).
− Average project size for CHP projects producing hot water/steam – For CHP projects, average
project size represents the average annual amount of hot water/steam produced in units of million Btu
per year.
− Total installed capital cost for year of construction – Total capital cost of the installed LFG energy
project.
− Annual costs for initial year of operation – Equipment operating and maintenance (O&M) cost for the
initial year of the LFG energy project.
− Internal rate of return – Return on investment based on the total revenue from the project and
construction grants, minus down payment (i.e., cash flow). More simply, the rate that balances the overall
costs of the project with the revenue earned over the lifetime of the project such that the net present value
of the investment is equal to zero.
− Net present value at year of construction – First year monetary value that is equivalent to the various
cash flows, based on the discount rate (which is defaulted to 8 percent, as discussed in Appendix A). In
other words, the NPV is calculated as the present value of a stream of current and future benefits minus
the present value of a stream of current and future costs.
− Years to breakeven – Years required for the total present value to exceed zero. An output of “None”
means there is no return on investment or no payback in the LFG energy project lifetime.
15LFGcost-Web User’s Manual Version 3.2
INP-OUT: Inputs / Outputs
Outputs: Economic Analysis (continued)
Environmental Benefits:
− Total lifetime amount of methane collected and destroyed – Total million cubic feet of methane that
is collected and either destroyed by the flare (assuming 100 percent destruction efficiency) or utilized by
the LFG energy project.
− Average annual amount of methane collected and destroyed – Average annual million cubic feet of
methane that is collected and either destroyed by the flare (assuming 100 percent destruction efficiency)
or utilized by the LFG energy project on a yearly basis.
− GHG value of total lifetime amount of methane utilized in energy project* – Total million metric
tons of methane (represented by carbon dioxide equivalents, or MMTCO2E) that is utilized by the LFG
energy project. This output takes into account the operating schedule and gross capacity factor of the
project. Flared gas is not included in this value.
− GHG value of average annual amount of methane utilized in energy project* – Average annual
million metric tons of methane (represented by carbon dioxide equivalents per year, or MMTCO2E per
year) that is utilized by the LFG energy project on a yearly basis. This output takes into account the
operating schedule and gross capacity factor of the project. Flared gas is not included in this value.
− Total lifetime carbon dioxide from avoided energy generation* – Total emissions that are avoided
because LFG is utilized instead of combusting fossil fuels. This output is presented in units of million
metric tons of carbon dioxide equivalents. For direct-use, boiler retrofit, and high Btu projects, LFG is
assumed to offset the combustion of natural gas. For CNG projects, LFG is assumed to offset the
combustion of diesel fuel. For projects that generate electricity (turbines, engines, and microturbines),
electricity produced is assumed to offset the emissions from the local electricity market module region
where the project is located. See the Avoided CO2- ELEC page for additional discussion on how to
estimate these values.
Average annual carbon dioxide from avoided energy generation* – Average annual emissions that are
avoided because LFG is utilized instead of combusting fossil fuels. This output is presented in units of million
metric tons of carbon dioxide equivalents per year. For direct-use, boiler retrofit, and high Btu projects, LFG
is assumed to offset the combustion of natural gas. For CNG projects, LFG is assumed to offset the
combustion of diesel fuel. For projects that generate electricity (turbines, engines, and microturbines),
electricity produced is assumed to offset the emissions from the local electricity market module region where
the project is located. See the Avoided CO2- ELEC page for additional discussion on how to estimate these
values.
*Note: These output values are presented in scientific notation. This format is used because these outputs are
smaller values, typically less than 0.1. An output value of 1.23E-02 is equivalent to 1.23 x 10⁻² or 0.0123.
16LFGcost-Web User’s Manual Version 3.2
WASTE: Waste Calculator / Disposal History
Waste Acceptance Rate Calculator – calculates the average annual waste acceptance rate in tons
per year based upon the amount of waste-in-place and the year representing the time required to
accumulate this amount of MSW. This calculator is meant to be used when average or year-to-
year annual acceptance rates are unknown.
− Waste-in-place – total tons of MSW accepted and placed in the landfill.
− Year representing waste-in-place – four-digit year that corresponds to the waste-in-place tonnage.
- OR -
Annual Waste Disposal History – this table allows users to enter yearly waste acceptance rate
data in tons per year for up to 75 years. The waste disposal history should be used only when
year-to-year waste acceptance is known for each year that the landfill operates. In other words,
the annual waste acceptance column must be completed for all years beginning with the landfill
open year and ending with the landfill closure year. The Year and Waste-In-Place columns
within the table are protected and cannot be edited.
− Year – four-digit year with Year 0 being the open year of the landfill.
− Annual waste acceptance – tons of MSW accepted per year for the corresponding year.
− Waste-in-place – a cumulative total of the tonnage of MSW accepted for previous years.
17LFGcost-Web User’s Manual Version 3.2
REGIONAL PRICING: Regional Electricity Pricing
A lookup table for 2016 electricity prices for each electricity market module is available for
users that want to reference a more regional price basis for selling LFG electricity or purchasing
electricity to run a gas collection and control system. These reference prices can be used to
replace the national average default values in cell D59 or cell D65 of the INP-OUT worksheet.
The basis of the prices in the lookup table is the Annual Energy Outlook 2017 published by the
U.S. Energy Information Administration (EIA).
18LFGcost-Web User’s Manual Version 3.2
CURVE: Landfill Gas Curve
The graph presented on the CURVE worksheet displays the LFG generation, collection, and
utilization in average standard cubic feet per minute from the year the project begins
operations to 25 years beyond start-up.
− The LFG generation curve is represented by a thick solid line and shows the estimated amount
of gas that the landfill is capable of producing. The gas generation does not take into account the
fact that not all of the gas is recoverable.
− The LFG collection curve is represented by a thin solid line and provides an estimate for the
amount of gas collected. The gas collection rate is estimated by multiplying the gas generation
rate by the collection efficiency. For more information about collection efficiency, please see
the “INP-OUT: Inputs/Outputs” section above.
− The LFG utilization curve is shown as a dashed line and represents the amount of gas utilized
by the project for the years the project is operating. Collection efficiency, project size, operating
schedule, gross capacity factor, and parasitic loss efficiency are taken into account when
calculating the LFG utilization. An example of the LFG generation, collection, and utilization
curve is shown in Figure 2 for a 15-year project beginning operation in 2015.
Figure 1. Example of LFG generation, collection, and utilization curve in LFGcost-
Web
19You can also read