Quarterly Energy Dynamics Q4 2021 - January 2022

Page created by Melissa Leonard
 
CONTINUE READING
Quarterly Energy Dynamics Q4 2021 - January 2022
Quarterly Energy
Dynamics Q4 2021
January 2022
Quarterly Energy Dynamics Q4 2021 - January 2022
Important notice
Purpose
AEMO has prepared this report to provide energy market participants and governments with information on the market
dynamics, trends and outcomes during Q4 2021 (1 October to 31 December 2021). This quarterly report compares results
for the quarter against other recent quarters, focusing on Q3 2021 and Q4 2020. Geographically, the report covers:

• The National Electricity Market (Queensland, New South Wales, the Australian Capital Territory, Victoria, South Australia
  and Tasmania).

• The Wholesale Electricity Market and domestic gas supply arrangements operating in Western Australia.

• The gas markets operating in Queensland, New South Wales, Victoria and South Australia.

Disclaimer
This document or the information in it may be subsequently updated or amended. This document does not constitute legal,
market or business advice, and should not be relied on as a substitute for obtaining detailed advice about:

• past, current or future market conditions, prices and outcomes; and

• the National Electricity Law, the National Electricity Rules, the Wholesale Electricity Market Rules, the National Gas Law,
  the National Gas Rules, the Gas Services Information Regulations or any other applicable laws, procedures or policies.

While AEMO has made reasonable efforts to ensure the quality of the information in this document, it cannot guarantee its
accuracy or completeness.

Accordingly, to the maximum extent permitted by law, AEMO and its officers, employees and consultants involved in the
preparation of this document:

• make no representation or warranty, express or implied, as to the currency, accuracy, reliability or completeness of the
  information in this document; and

• are not liable (whether by reason of negligence or otherwise) for any statements or representations in this document, or
  any omissions from it, or for any use or reliance on the information in it.

Version control
 Version          Release date           Changes
 1                28/01/2022

© 2022 Australian Energy Market Operator Limited
The material in this publication may be used in accordance with the copyright permissions on AEMO’s website.
Quarterly Energy Dynamics Q4 2021 - January 2022
Executive summary

Executive summary
East coast electricity and gas highlights
A return to rising prices

• In Q4 2021, the first quarter in which the National Electricity Market (NEM) operated with five-minute
  settlement (5MS), movements in NEM and east coast gas market prices reversed the falling trends observed
      through the previous quarter.

• NEM mainland electricity prices averaged $39 per megawatt-hour (MWh) in October but reached $75/MWh1 by
  December, lifted by strongly rising prices in Queensland with growing volatility in that state and in South
      Australia. For the quarter as a whole, mainland prices averaged $57/MWh, still below Q3’s average of
      $66/MWh but 31% higher than Q4 2020’s $44/MWh.

• While less volatile in Q4 than in Q3, east coast gas market prices returned to high average levels in November
  and December, yielding a quarterly average of $10.60 per gigajoule (GJ) across AEMO’s spot markets,
  comparable with Q3’s $10.74/GJ but well above their $5.95/GJ average in Q4 2020.

• The gap between higher average electricity prices in the mainland NEM’s northern regions (Queensland and
  New South Wales) and those in the southern regions remained pronounced at $45/MWh for the quarter,
  having first opened up in Q2 this year. This divergence was reflected in electricity futures for Calendar 2022,
      which by the end of the quarter ranged in price from $91/MWh for Queensland to $56/MWh for Victoria.

• Energy transfers from the southern to northern regions also grew:

      – Victorian gas exports to other regions were 34.5 petajoules (PJ), their highest quarterly level since
        Q4 2018, while net transfers north from Moomba via the South West Queensland Pipeline (SWQP) reached
          14.9 PJ, the highest level since Q4 2017, to cover a net reduction in domestic supply from Queensland
          producers. Quarterly supply for liquefied natural gas (LNG) exports from Curtis Island reached its second
          highest level on record at 369 PJ, with Asian traded LNG prices at record highs.

      – Interconnector transfers from Victoria to New South Wales increased in response to higher prices in the
        northern NEM, record low black coal generation (down by 693 megawatts [MW] or 6.5% on
        Q4 2020), and reduced gas generation (down by 12% in the north), although these transfers were
          constrained during daylight hours.

Renewables and cool weather influencing daytime prices and demand

• Daytime electricity prices continued to fall, particularly in the southern regions which saw record negative price
      incidence in South Australia and Victoria, especially in October. Drivers included continued growth in grid-solar
      output, which at 269 MW exceeded wind output growth of 156 MW, coupled with lower operational demand
      (down 465 MW) due to strong growth of distributed photovoltaic (PV) output and cool wet La Niña conditions
      which reduced cooling loads and maximum demand levels. However evening and overnight prices were not
      affected by these trends, remaining substantially higher than a year ago.

1
    Uses the time-weighted average which is the simple average of spot prices in the quarter excluding Tasmania. The Australian Energy
    Regulator (AER) reports the volume-weighted average price which is weighted against native demand.

© AEMO 2022 | Quarterly Energy Dynamics Q4 2021                                                                                          3
Executive summary

• New minimum operational demand records were seen in New South Wales (down 211 MW on the previous
  minimum set in 1999), Victoria (down 196 MW), and South Australia (down 132 MW), while minimum
   operational demand for the NEM as a whole fell to a record low of 12,936 MW, down 1,257 MW on the prior
   low set in Q3 2021.

• Instantaneous renewable penetration achieved a new high of 61.8%, up marginally from 61.4% in Q3 2021.
  Average renewable penetration levels for the quarter increased more substantially from 31.6% in Q3 to 34.9%.

Other highlights

• Frequency control ancillary services (FCAS) costs remained elevated at $132 million, again driven by extreme
  FCAS price volatility in Queensland on days where outages related to upgrades of the Queensland to New
  South Wales interconnector (QNI) required significantly increased local supply of Contingency FCAS products.

• Full commissioning of the four new synchronous condensers in South Australia late in November 2021 allowed
  substantial reductions in gas generation directed to run for system security purposes. Prior to this, high gas
  prices and very low daytime electricity prices led to frequent direction of multiple gas units. While provisional
   quarterly direction costs of $34 million were up substantially on previous quarters, a large majority of these
   costs fell prior to full commissioning of the synchronous condensers.

• Readily observable impacts of the transition to 5MS on 1 October included the cessation of prices falling
  regularly to the market price floor of -$1,000/MWh shortly after high price events. A separate rule change also
  implemented in Q4 2021 saw registration of the NEM’s first three Wholesale Demand Response (WDR) units.

Western Australia electricity and gas highlights
A late heatwave drives high demand and price events in the WEM

• Four consecutive days exceeding 40°C in the Perth metropolitan region, between Christmas Day and
  28 December 2021, saw the Wholesale Electricity Market (WEM) reach its highest Q4 maximum operational
   demand on record at 3,869 MW on 27 December, 7% above Q4 2020’s maximum and just 137 MW lower than
   the all-time WEM record maximum demand set in February 2016.

• With high demands during the heatwave and relatively low non-scheduled generation, there were 12 maximum
  price events in the WEM’s Balancing Market, 10 more than in Q3 2021 and nine more than in Q4 2020.

Increasing renewable contribution leads to record low WEM minimum demand

• Increasing levels of distributed PV and large-scale renewable generation resulted in nearly 40% of total
  underlying demand being met by renewable energy in Q4 2021. Distributed PV and large loads not consuming
  also resulted in a record minimum operational demand for the WEM of 761 MW on 14 November 2021 over
   the 1130 hrs interval. Approximately 78% of underlying demand in this interval was supplied by renewables,
   with supply from distributed PV estimated at 67%. This minimum demand was a 12% decrease on the
   previous quarterly record set in September 2021.

• Increased renewable supply also led to reductions in gas and distillate powered generation in the WEM of
  16%. Overall, there was a decrease of around 3% in Western Australian domestic gas consumption, as
   reductions in electricity generation, minerals processing and industrial use were partially offset by increased
   mining consumption.

© AEMO 2022 | Quarterly Energy Dynamics Q4 2021                                                                      4
Contents
Executive summary                                           3
East coast electricity and gas highlights                   3
Western Australia electricity and gas highlights            4
1        NEM market dynamics                                6
1.1      Electricity demand                                 6
1.2      Wholesale electricity prices                      11
1.3      Electricity generation                            20
1.4      Inter-regional transfers                          31
1.5      Power system management                           34
2        Gas market dynamics                               40
2.1      Gas demand                                        40
2.2      Wholesale gas prices                              41
2.3      Gas supply                                        43
2.4      Pipeline flows                                    45
2.5      Gas Supply Hub                                    46
2.6      Pipeline capacity trading and day ahead auction   47
2.7      Gas – Western Australia                           47
3        WEM market dynamics                               50
3.1      Electricity demand                                50
3.2      WEM prices                                        52
3.3      Electricity generation                            55
3.4      Power system management                           58
List of tables and figures                                 60

Abbreviations                                              64

© AEMO 2022 | Quarterly Energy Dynamics Q4 2021                 5
NEM market dynamics

1 NEM market dynamics
1.1 Electricity demand

1.1.1 Weather
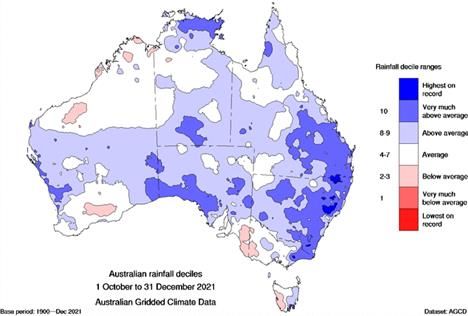
During the quarter, temperatures were cooler than 10-year averages (Figure 1), with rainfall also well above the
average (Figure 2). Across the east coast, temperatures were 1.3°C below the 10-year average, with Adelaide,
Melbourne and Sydney experiencing their coolest November in at least 20 years, including Melbourne’s coldest
November day on record.

Rainfall was well above average for the quarter, with the Bureau of Meteorology (BoM) declaring a La Niña under
way2. Nationally, November was the wettest in 122 years on record3 with heavy October rainfalls in Tasmania and
in November on the mainland.

     Figure 1               Cooler across the East coast                      Figure 2    La Niña conditions in Q4 2021
     Average maximum temperature variance by capital city                     Australian rainfall deciles – 1 October to 31 December 2021
             0.0

           -0.5

            -1.0
     °C

            -1.5

           -2.0

           -2.5
                             BRI     SYD     MEL      ADL     HOB
                           Q4 21 vs Q4 20    Q4 21 vs 10yr average
Source: Bureau of Meteorology

The cooler average temperatures and absence of extreme heat days for the quarter saw reduced air-conditioning
requirements in some regions, as measured by aggregate cooling degree day totals for the quarter (Figure 3).

Figure 3                   Decreased cooling requirements in Adelaide and Sydney
Cooling degree days4 (Q4s) – 2010 to 2021
                     150
                                                                                                      Adelaide          Sydney
    Cooling Degree

                     100
         Days

                     50

                      0
                              2010    2011     2012    2013     2014   2015   2016    2017     2018     2019     2020     2021

2
    BoM 2021, Bureau of Meteorology declares La Niña underway: https://media.bom.gov.au/releases/914/bureau-of-meteorology-declares-la-
    nina-underway/.
3
    BoM 2021, Bureau of Meteorology wettest November in 122 years: http://www.bom.gov.au/clim_data/IDCKGC1AR0/202111.summary.shtml.
4
    A “cooling degree day” (CDD) is a measurement used as an indicator of outside temperature levels above what is considered a comfortable
    temperature. CDD value is calculated as max (0, average [maximum temperature, minimum temperature] – 24).

© AEMO 2022 | Quarterly Energy Dynamics Q4 2021                                                                                               6
NEM market dynamics

1.1.2 Demand outcomes
NEM quarterly average operational demand fell to 19,876 MW, its lowest Q4 average since Tasmania joined the
NEM in 2005 and 465 MW lower than Q4 2020 (-2.3%, Figure 4). Reductions occurred across all NEM regions,
apart from Tasmania (+28 MW), with the largest decrease occurring in New South Wales (-224 MW), followed by
Victoria (-93 MW), South Australia (-93 MW) and Queensland (-82 MW). Notably, operational demand in three out
of the five NEM regions (New South Wales, South Australia and Victoria) declined to record low Q4 levels.

Figure 4                                  New South Wales leads underlying demand decrease
Change in average operational demand – Q4 2021 vs Q4 2020

                                    50
    Average change (MW)

                                     0
                                    -50
                             -100
                             -150
                           -200
                           -250
                                                     NSW                QLD                  SA               TAS                 VIC
                                               Underlying Demand              Distributed PV Impact            Operational Demand

This was largely due to the marked increase in distributed PV output (+492 MW) 5 compared to Q4 2020, as
changes in underlying demand6 were small (+26 MW). Despite significantly less distributed PV output in
November with high levels of rainfall and increased cloud cover influenced by La Niña, very high levels of output
in October and December driven by record uptake of distributed PV capacity (estimated to be approximately
3.2 gigawatts [GW] in 20217) drove quarterly output to new highs in Q4, contributing to substantial daytime
demand reductions (Figure 5).

Figure 5                                  Distributed PV output substantially reduces daytime demand
Change in average NEM operational demand – Q4 2021 vs Q4 2020

                                      400
              Average change (MW)

                                          0

                                     -400

                                     -800

                                    -1,200

                                    -1,600
                                              0:30     2:30    4:30    6:30   8:30   10:30    12:30   14:30   16:30   18:30   20:30   22:30

                                                     Distributed PV impact           Underlying Demand                Operational Demand

5
    Increased distributed PV generation results in reduced operational demand because its production lowers supply required from the grid.
     Distributed PV production is based on AEMO estimates using ASEFS2.
6
    Underlying demand is calculated by adding estimated production from distributed PV to operational demand, to yield an estimate of total
    electricity demand.
7
    Clean Energy Regulator 2021, Quarterly Carbon Market Report: http://www.cleanenergyregulator.gov.au/DocumentAssets/Documents/
    Quarterly%20Carbon%20Market%20Report%20-%20September%20Quarter%202021.pdf.

© AEMO 2022 | Quarterly Energy Dynamics Q4 2021                                                                                               7
NEM market dynamics

While average underlying demand was similar to Q4 2020, changes by region within the quarter varied.

• Average underlying demand in New South Wales and South Australia reduced by 61 MW and 26 MW,
  respectively, partly driven by large reductions in November due to cold and wet conditions.

                   – Of note was New South Wales’ average underlying demand in November, which declined to its lowest
                     levels in recent years and was 365 MW lower than November 2020 (Figure 6), as cooler temperatures saw
                           lower requirements for air-conditioning load.

• In Victoria, underlying demand was up by 44 MW on average compared to Q4 2020, with increases occurring
  during the morning peak due to cooler conditions.

Figure 6                         Lowest November underlying demand in recent years for New South Wales
Average New South Wales underlying demand - Novembers

                         8,100
Underlying Demand (MW)

                         8,000

                         7,900

                         7,800

                         7,700

                         7,600

                         7,500
                                       2016          2017          2018         2019          2020           2021

Maximum and minimum demands
The continued rapid uptake in distributed PV, coupled with Q4 being typically the sunniest quarter of the year, saw
minimum operational demand continue to trend downwards across the NEM. Most notably, the NEM-wide
minimum demand record was lowered on three separate days in Q4 with a new low of 12,936 MW set on Sunday
17 October 2021 at 1300 hrs, 1,257 MW lower than the prior quarterly record of 14,193 MW set in Q3 2021.
During this interval, distributed PV output accounted for 40% of NEM underlying demand.

In addition to the NEM record, new all-time minimum demand records were also set in three NEM regions – South
Australia, New South Wales and Victoria:

• South Australia’s minimum demand trended down rapidly this quarter, with its record half-hourly low being
  broken on two separate days – 31 October and 21 November. On Sunday 21 November, South Australia set a
  new minimum demand record of 104 MW at 1300 hrs 8, 132 MW lower than the previous quarterly record set in
                   Q3 2021 and 84 MW under the October low (Figure 7). Mild sunny conditions, coupled with low underlying
                   weekend demand and reduced industrial load due to planned maintenance, were key drivers of the result.
                   During this interval, distributed PV provided 1,220 MW of output, accounting for 92% of underlying demand.

8
    The 5-minute South Australian scheduled demand cleared in the spot market by the NEM dispatch engine (NEMDE) was negative for
    dispatch intervals 1225 hrs to 1240 hrs and reached a minimum of -38 MW at 1235 hrs. Operational demand minimums are half-hourly and
    include large-scale generation not scheduled through NEMDE. For more information, see: https://aemo.com.au/newsroom/news-
    updates/negative-electricity-demand-in-south-australia.

© AEMO 2022 | Quarterly Energy Dynamics Q4 2021                                                                                            8
NEM market dynamics

• Both New South Wales and Victoria set new minimum operational demand records during the quarter
  (Figure 8), with drivers similar to those in South Australia.

           – New South Wales’ new minimum demand record of 4,425 MW was set on the same day as the NEM record
             on Sunday 17 October 2021 at 1300 hrs and was 211 MW lower than the previous minimum set in 1999
             and 945 MW below 2020’s minimum.

           – Victoria’s new minimum demand record of 2,333 MW occurred at 1300 hrs on Sunday 28 November 2021
             and was 196 MW lower than the previous record set in Q4 2020.

 Figure 7                          SA minimum demand falls to 104 MW        Figure 8                             NSW and VIC both set new records
 SA monthly minimum operational demand – Oct-20 to Dec-21                   NSW and VIC all time minimum operational demand - annual

                       1000                                                                             6,000
 Minimum demand (MW)

                                                                                  Minimum demand (MW)
                             800
                                                                                                        5,000
                             600
                                                                                                        4,000
                             400

                             200                                                                        3,000

                               0                                                                        2,000
                                   Dec-20

                                    Apr-21

                                    Jun-21

                                   Aug-21
                                   Sep-21

                                   Dec-21
                                   Feb-21
                                   Oct-20
                                   Nov-20

                                    Jan-21

                                   May-21

                                    Oct-21
                                   Nov-21
                                     Jul-21
                                   Mar-21

                                                                                                                               2003
                                                                                                                                      2005
                                                                                                                                             2007
                                                                                                                                                    2009
                                                                                                                        2001

                                                                                                                                                                                              2021
                                                                                                                                                                  2013

                                                                                                                                                                                2017
                                                                                                                                                           2011
                                                                                                                 1999

                                                                                                                                                                         2015

                                                                                                                                                                                       2019
                                                      SA                                                                               NSW                    VIC

With cooler than average Q4 conditions and increased distributed PV output, quarterly maximum demands in the
NEM were also down on recent fourth quarters (Figure 9). In particular, New South Wales’ maximum demand of
11,176 MW was 1,370 MW (or 11%) lower than Q4 2020, representing its lowest Q4 level since 2001 (Figure 10)
while Victoria’s maximum demand of 7,547 MW was its lowest Q4 level since 2016.

 Figure 9                          Q4 maximum demand fall in mainland NEM   Figure 10 Lowest NSW Q4 maximum demand since 2001
 NEM maximum operational demands – Q4 2021 vs Q4 2020                       NSW maximum operational demands – Q4s

                             14,000                                                                 14,000
       Maximum demand (MW)

                                                                            Maximum demand (MW)

                             12,000
                             10,000                                                                 13,000

                              8,000
                              6,000                                                                 12,000

                              4,000
                                                                                                        11,000
                              2,000
                                   0
                                       NSW      QLD           SA     VIC                            10,000
                                                                                                                 2001
                                                                                                                        2003
                                                                                                                               2005

                                                                                                                                                                                              2021
                                                                                                                                       2007
                                                                                                                                              2009

                                                                                                                                                                     2015
                                                                                                                                                      2011
                                                                                                                                                             2013

                                                                                                                                                                            2017
                                                                                                                                                                                   2019

                                           Q4 2020         Q4 2021

© AEMO 2022 | Quarterly Energy Dynamics Q4 2021                                                                                                                                                      9
NEM market dynamics

Intra-day demand swing
As minimum operational demands now typically occur in the middle of the day, an emerging dynamic in the NEM
is increasing intra-day demand swing – the difference between daily maximum and minimum demands – with this
swing occurring within a relatively short timeframe.

As an example, Queensland recorded its highest daytime intra-day operational demand swing for a Q4 in 2021
(Figure 11). This occurred on 4 October 2021 with a difference of 3,605 MW between daily minimum operational
demand of 4,228 MW at 1030 hrs and maximum operational demand of 7,833 MW at 1900 hrs (Figure 12).

    Figure 11 Record Q4 daily demand swing in                                    Figure 12 Operational demand swing of 3,605 MW from
              Queensland                                                                   1030 hrs to 1900 hrs
    QLD maximum daytime intra-day operational demand swing                       QLD operational demand – 4 October 2021
    (Q4s9)
                                                                                                            8,500
                        4,000                                                                                                                                  Maximum

                                                                                  Operational demand (MW)
                                                                                                            7,500
    demand swing (MW)
    Maximum intra-day

                        3,500
                                                                                                            6,500

                        3,000                                                                               5,500

                        2,500                                                                               4,500
                                                                                                                                                                 Minimum
                                                                                                            3,500
                        2,000

                                                                                                                                                       10:30
                                                                                                                                                               12:30

                                                                                                                                                                               16:30
                                                                                                                                                                                       18:30
                                                                                                                                  4:30

                                                                                                                                                                       14:30

                                                                                                                                                                                               20:30
                                                                                                                                                                                                       22:30
                                                                                                                    0:30
                                                                                                                           2:30

                                                                                                                                         6:30
                                                                                                                                                8:30
                                                                   2020

                                                                          2021
                                2015

                                       2016

                                              2017

                                                     2018

                                                            2019

                                                                                                                                                       QLD
                                                      QLD

Efficiently dispatching generation and demand-side resources to meet large daily demand swings introduces
operational challenges and places increased importance on short term forecasting accuracy. The swings in
demand, driven by both distributed PV and demand-side response, plus ramps in renewable generation become
increasingly important as renewable penetration increases. The forecasting, not only of these swings or ramps,
but also of the associated uncertainty and variability driven by the weather systems and/or market responses are
critical for short term commitment and utilisation of resources. Variability and uncertainty are two distinct
operational challenges that require management, both via market structures and through deployment of enhanced
forecasting techniques.

As the energy transition progresses, it is expected there will be a higher demand for flexible resources to be
online and ready to be dispatched up and down to match variability and uncertainty in supply and demand.
Without a new reserve service, interventions may increase due to the lack of suitable flexibility that can physically
respond to increasing variability.

There is increased net demand uncertainty over operational timeframes, which supports the development of a
new operating reserve product. An operating reserve product/market comprises a dispatchable service in
real-time and co-optimised with other energy market services. The product could be procured 30 minutes ahead
of time and align with the requirement to return the system to a secure operating state within 30 minutes.

9
    Daytime intra-day operational demand swing is measured for each day as the difference between minimum and maximum operational
    demands recorded between 0600 hrs and 2000 hrs. Prior to high levels of distributed PV penetration, daily minimum demands typically fell
    outside this window, in the early overnight hours.

© AEMO 2022 | Quarterly Energy Dynamics Q4 2021                                                                                                                                                                10
NEM market dynamics

1.2 Wholesale electricity prices

Mainland NEM prices averaged $57/MWh for the quarter, down 13% on Q3 but 31% higher than in Q4 2020
(Figure 13). Within the quarter, monthly mainland averages increased progressively, rising from $39/MWh in
October to $75/MWh in December.

Figure 13 A slowing decline in NEM prices
Mainland average wholesale electricity price

              140
              120
              100
      $/MWh

               80
               60
               40
               20
                   0
                       Q4 18 Q1 19 Q2 19 Q3 19 Q4 19 Q1 20 Q2 20 Q3 20 Q4 20 Q1 21 Q2 21 Q3 21 Q4 21

Price behaviour once again varied significantly across NEM regions (Figure 14):

• Queensland’s quarterly average price of $97/MWh was its highest Q4 average on record and more than
       double the level of one year ago. Price volatility, particularly in November and December, was a significant
       factor, lifting the region’s average by $27/MWh (Section 1.2.2). Conversely, Victoria’s quarterly average price
       of $28/MWh was its lowest Q4 average since 2014.

• Underlying energy prices in other mainland NEM regions fell from Q3 levels, and price outcomes were broadly
  comparable with those of a year ago, although episodes of price volatility late in December raised South
       Australia’s quarterly average relative to Q4 2020, while in New South Wales underlying prices above those of
       2020 were offset by an absence of volatility in Q4 2021.

Figure 14 Queensland prices hold up the NEM average
Average wholesale electricity price by region10
                                                                                                      Q4 20
                                                                                                              Q3 21
                                                                                                                      Q4 21

         100

                                                                                                                              Cap price
              75
                                                                                                                              Energy price
 $/MWh

              50

              25

               -
                          QLD                 NSW                      VIC                     SA                              TAS

10
     ‘Energy price’ is used in electricity pricing to remove the impact of price volatility (that is, price above $300/MWh). Since commencement of
     5MS from 1 October 2021, energy and cap prices are calculated on a 5-minute basis.

© AEMO 2022 | Quarterly Energy Dynamics Q4 2021                                                                                                  11
NEM market dynamics

The gap between prices in the northern NEM regions of Queensland and New South Wales and the southern
regions persisted through the quarter (Figure 15), with prices in Queensland and New South Wales averaging
$45/MWh higher than those in Victoria and South Australia, the second largest differential after Q2 2021.

Figure 15 North-South price divide continues
Average spot electricity price by mainland NEM region

         140

         120

         100

         80
 $/MWh

         60

         40

         20

            0
                    Q4 19      Q1 20         Q2 20     Q3 20      Q4 20         Q1 21         Q2 21       Q3 21       Q4 21

                                                 NSW           QLD         SA           VIC

A monthly breakdown of average prices by region (Figure 16) clearly shows the rising trend within the quarter and
the impacts of volatility in Queensland and South Australia.

Figure 16 Energy prices and volatility rising through the quarter
Average wholesale monthly electricity price (energy and cap) by region and month – Q4 2021

            140
                                       QLD     NSW     VIC   SA      TAS
            120

            100
    $/MWh

            80

            60

            40

            20

                0
                            October 2021                     November 2021                            December 2021

The profile of average energy price by time of day for the mainland regions relative to Q4 2020 (Figure 17) shows
a continuing trend of lower middle-of-day prices, driven by increasing solar generation capacity (grid-scale and
distributed PV) and declining operational demand, but higher evening and overnight prices. In Victoria, spot price
averages in Q4 2021 were negative between 0925 hrs and 1420 hrs, while the overall average between 0800 hrs
and 1630 hrs was just $0.1/MWh (Figure 18).

© AEMO 2022 | Quarterly Energy Dynamics Q4 2021                                                                               12
NEM market dynamics

 Figure 17 Lower daytime prices, higher evening and                                                           Figure 18 Victorian middle-of-day prices fall below
           overnight prices                                                                                             zero
 Mainland NEM average Q4 energy prices by time of day                                                         Victoria average Q4 spot prices by time of day

             140                                                                                                  100
             120                                                                                                      80
             100
                                                                                                                      60
     $/MWh

                                                                                                              $/MWh
             80
                                                                                                                      40
             60
                                                                                                                      20
             40
             20                                                                                                        0
              0                                                                                                   -20
                                                      10:05
                                                              12:05

                                                                              16:05
                                                                                      18:05
                                 4:05

                                                                      14:05

                                                                                              20:05
                                                                                                      22:05
                   0:05
                          2:05

                                        6:05
                                               8:05

                                                                                                                                                              10:05
                                                                                                                                                                      12:05

                                                                                                                                                                                      16:05
                                                                                                                                                                                              18:05
                                                                                                                                                                                                      20:05
                                                                                                                                         4:05

                                                                                                                                                                                                              22:05
                                                                                                                                                       8:05

                                                                                                                                                                              14:05
                                                                                                                           0:05
                                                                                                                                  2:05

                                                                                                                                                6:05
                                        Q4 2020                          Q4 2021                                                                  Q4 2020                         Q4 2021

1.2.1 Wholesale electricity price drivers
Important influences on the level and pattern of electricity prices in Q4 2021 are summarised in Table 1 below,
and discussed in more detail in subsequent sections of this report.

Table 1 Wholesale electricity price levels: Q4 2021 drivers

 Price volatility                        Episodes of volatility, discussed further in Section 1.2.2, significantly lifted quarterly average prices in Queensland
                                         and South Australia and added $10/MWh to the NEM mainland average, compared to $5/MWh in Q4 2020 and
                                         $7/MWh in Q3 2021.
 Thermal                                 Black coal generation output was 693 MW lower than in Q4 2020, with many generators also repricing marginal
 generation                              offer bands upwards (Section 1.3.1). Compared with Q4 2020, average black coal volumes offered below
                                         $40/MWh fell by over 2000 MW. Rising gas prices (Section 2.2) saw reduced output from gas-fired generators
                                         (Section 1.3.2) but higher price levels at times when gas units did set the spot price (Section 1.2.4). These
                                         repricing trends particularly affected evening and overnight electricity prices when thermal generation sets price
                                         more frequently.
 Variable renewable                      VRE supply increased steadily, with additional grid-solar output averaging 269 MW and wind 156 MW
 energy (VRE)                            (Section 1.3.4). Combined with distributed PV growth (+492 MW) reducing daytime operational demands
 supply                                  (Section 1.1.2), this saw falls in NEM daytime prices (Figure 17) and increased negative price incidence
                                         (Section 1.2.3).
 Price separation                        While underlying spot prices fell or were stable in the southern NEM regions, the larger share of thermal generation
                                         in Queensland and New South Wales and higher prices being set by black coal and gas (Section 1.2.4), as well as
                                         limitations on transfers of lower cost energy from the southern regions (Section 1.4) each contributed to ongoing
                                         north-south price differentials in Q4.

1.2.2 Wholesale electricity price volatility
Spot price volatility increased on Q3 levels, contributing $27/MWh to Queensland’s average quarterly spot price
and $11/MWh to South Australia’s. Although there was minimal volatility in other regions, this yielded the highest
Q4 NEM volatility since 2009 (Figure 19). As in Q2 and Q3, there was also very significant volatility in contingency
FCAS prices in Queensland during the quarter, leading to high FCAS recovery costs discussed in Section 1.5.1.

Drivers of energy price volatility in Queensland and South Australia were varied, with days of very high volatility 11
summarised in Table 2.

11
     The AER publishes $5000/MWh reports which analyse the cause of these events in more detail: https://www.aer.gov.au/wholesale-
     markets/performance-reporting.

© AEMO 2022 | Quarterly Energy Dynamics Q4 2021                                                                                                                                                                       13
NEM market dynamics

Figure 19 Highest Q4 cap returns since 2009
Q4 average cap returns by region - stacked12

             120
                                                                                        NSW      QLD       SA     TAS      VIC
             100

             80
     $/MWh

             60

             40

             20

              0
                   2009    2010    2011    2012     2013     2014     2015     2016    2017     2018     2019     2020     2021

Table 2 High priced days in Q4 2021

 Region             Date          Average daily        No. of DIs            Contribution to        Drivers
                                  price ($/MWh)        =>$10k/MWh            quarterly cap
                                                                             returns ($/MWh)
 QLD                20 Dec        $853                 16                    $7.75                  • High evening peak demands >9,000 MW
                                                                                                    • Declining grid-solar output
                                                                                                    • Limited NSW imports
                                                                                                    • Gas and hydro units setting price
                    09 Dec        $612                 13                    $5.32                  • High evening peak demands >8,400 MW
                                                                                                    • Declining grid-solar output
                                                                                                    • Coal-fired outages
                                                                                                    • Gas units setting price
                    11 Nov        $572                 5                     $4.26                  • Local FCAS constraints due to QNI works
                                                                                                    • Extreme FCAS volatility influencing
                                                                                                      energy price through co-optimisation and
                                                                                                      impacts on generator rebidding
                                                                                                    • Rapid changes in operational demand due
                                                                                                      to variability in distributed PV output
 SA                 30 Dec        $409                 7                     $3.08                  • Evening peak volatility
                                                                                                    • Low wind and grid-solar output
                                                                                                    • Interconnector flows from Victoria at limit
                                                                                                    • Gas units and batteries setting price
                    13 Dec        $308                 4                     $2.08                  • Low wind, variable cloud cover affecting
                                                                                                      distributed PV and grid-solar
                                                                                                    • Interconnector flows from Victoria at limit
                                                                                                    • Rapid changes in supply demand balance

As an illustration of one of these varied causes of volatility, Figure 20 shows demand, generation availability and
spot prices for South Australia on 13 December, when high and changing levels of cloud cover reduced
distributed PV output, leading to increased and unusually variable scheduled demand 13 through the middle of the
day. A more typical daily demand pattern is illustrated by the scheduled demand profile for 14 December overlaid

12
     A measure of volatility in electricity prices is the presence of high price events – prices above $300/MWh. This is often represented as
     ‘quarterly cap returns’, which is the sum of the NEM pool price minus the $300 cap price for every dispatch interval in the contract quarter
     where the pool price exceeds $300/MWh, divided by the number of dispatch intervals in the quarter. Since commencement of 5MS from 1
     October 2021, cap returns are calculated on a 5-minute basis for current and previous quarters.
13
     ‘Scheduled demand’ refers to demand met through the market clearing process by large-scale scheduled and semi-scheduled generation
     and loads. It is the net supply requirement to meet the difference between underlying demand and supply from distributed PV and
     non-scheduled sources.

© AEMO 2022 | Quarterly Energy Dynamics Q4 2021                                                                                                     14
NEM market dynamics

on the chart. Wind output through the middle of the day was very low and cloud cover also affected grid-solar
output, both reflected in the changes seen in generation availability. The resulting variations in market
supply-demand balance led directly to instances of spot price volatility, as gas and liquid-fuelled generation as
well as battery storage were dispatched to manage rapid changes in the net supply requirement.

Figure 20 Weather-driven demand variability triggers volatility in South Australia
South Australian dispatch outcomes for 13 December 2021

           3,000
           2,600                                                                                           14,000
           2,200
           1,800                                                                                           9,000

                                                                                                                    $/MWh
   MW

           1,400
           1,000
                                                                                                           4,000
            600
            200
           -200                                                                                            -1,000
                   0:05   2:05   4:05   6:05   8:05   10:05 12:05 14:05 16:05 18:05 20:05 22:05

                            Scheduled Demand (13-Dec)                  Typical Scheduled Demand (14-Dec)
                            Generation Availability                    RRP [RHS]

Five-minute settlement (5MS)
An early and readily observable impact of the change to 5MS from 1 October 2021 was the effective cessation of
dispatch prices regularly falling to the market price floor of -$1,000/MWh following a very high price dispatch
interval (Figure 21). Previously, loads and generators had a strong financial incentive to rebid after a price spike
early in a 30-minute trading interval due to the effect of the spike on the 30-minute average settlement price.
Under 5MS, this incentive is removed, and in most circumstances price spikes have not been followed by price
collapses to the floor over the balance of a half-hour (Figure 22).

 Figure 21 Pre 5MS – Rebidding after Qld price spikes               Figure 22 Post 5MS – No rebidding after price spikes
 Queensland 5-minute spot prices – 30 September 2021                Queensland 5-minute spot prices – 4 Oct 2021

         5,000                                                              5,000

         4,000                                                              4,000

         3,000                                                              3,000
                                                                    $/MWh
 $/MWh

         2,000                                                              2,000

         1,000                                                              1,000

             0                                                                  0

         -1,000                                                             -1,000
                                                                                      7:45

                                                                                     17:45
                                                                                     11:45

                                                                                     14:45
                                                                                      6:45

                                                                                      8:45
                                                                                      9:45
                                                                                     10:45

                                                                                     12:45
                                                                                     13:45

                                                                                     15:45
                                                                                     16:45

                                                                                     18:45
                                                                                     19:45
                   7:45

                  11:45

                  14:45

                  17:45
                   6:45

                   8:45
                   9:45
                  10:45

                  12:45
                  13:45

                  15:45
                  16:45

                  18:45
                  19:45

                                  QLD1 RRP                                                      QLD1 RRP

© AEMO 2022 | Quarterly Energy Dynamics Q4 2021                                                                             15
NEM market dynamics

1.2.3 Negative wholesale electricity prices
Negative and zero spot price14 incidence continued to trend upwards in 2021, occurring in 11.2% of all dispatch
intervals15, more than doubling 2020’s average of 4.9%. During Q4 2021, the frequency of negative spot prices
was similar to Q3 2021 at 16.6% of all dispatch intervals, with the majority of negative prices in October. Negative
spot prices occurred consistently across all NEM regions, with records set in South Australia and Victoria. In
South Australia, spot prices were negative 28% of the time during Q4 2021, surpassing the previous quarterly
high of 23%, while Victoria reached a new record of 24% (Figure 23).

Figure 23 Negative prices declined from October highs but still set quarterly records
Frequency of negative or zero spot prices in South Australia and Victoria
                                     45%
                                     40%
     Negative price occurrence (%)

                                     35%
                                     30%
                                     25%
                                     20%
                                     15%
                                     10%
                                     5%
                                     0%
                                           Dec-20

                                           Aug-21

                                           Dec-21

                                           Dec-20

                                           Aug-21

                                           Dec-21
                                            Jun-21

                                           Sep-21

                                            Jun-21

                                           Sep-21
                                           Feb-21

                                            Apr-21

                                           Feb-21

                                            Apr-21
                                            Jan-21

                                            Jan-21

                                            Oct-21
                                           Oct-20
                                           Nov-20

                                           May-21

                                             Jul-21
                                           Mar-21

                                            Oct-21
                                           Nov-21

                                           Oct-20
                                           Nov-20

                                           Mar-21

                                           May-21

                                             Jul-21

                                           Nov-21
                                            South Australia                                 Victoria

These South Australian and Victorian records were driven by high incidences in October, with negative spot
prices occurring in 40% and 34% of dispatch intervals respectively during the month. Drivers included:

• Reduced daytime demand – driven by very mild conditions and high distributed PV output, in October 2021,
                    combined Victorian and South Australian daytime operational demand between 1000 hrs and 1500 hrs
                    dropped below 4,500 MW 52% of the time compared to 14% of the time in October 2020, contributing to
                    frequent negative spot price occurrence during the middle of the day.

• High VRE and hydro output – increased levels of VRE output particularly from Victorian grid-solar and wind,
  coupled with increased Tasmanian hydro offers below $0/MWh and transfers on Basslink, contributed to
                    increased occurrence of negative prices in the southern regions.

• Interconnector constraints – transfers of energy across the Victoria – New South Wales Interconnector (VNI)
  were constrained to lower daytime levels in Q4 (Section 1.4), tending to suppress prices in southern regions.

Change in VRE bidding behaviour
While the overall frequency of negative spot prices remained high during the quarter, there was a notable
reduction in the proportion of negative prices falling within the -$1,000 to -$100/MWh and -$15 to $0/MWh price
ranges, while negative prices around the minus $35-$50/MWh range, close to the value of a Large-scale

14
     Hereafter referred to as negative prices.
15
     Since commencement of 5MS from 1 October 2021, negative and zero spot price occurrences are calculated on a 5-minute basis for current
     and previous quarters.

© AEMO 2022 | Quarterly Energy Dynamics Q4 2021                                                                                          16
NEM market dynamics

Generation Certificate (LGC)16 have increased substantially. For example, in South Australia 40% of all negative
price intervals fell within this minus $35-50/MWh price band, an increase from 16% in Q3 2021 (Figure 24).

A key driver to this increase was the change in VRE bidding behaviour since 1 October 2021. A large proportion of
semi-scheduled generators across the NEM have altered their bidding behaviour. During the week prior to
1 October 2021, on average over 8,600 MW of nominal capacity was offered at market price floor of -$1,000/MWh,
however since then volumes offered at this level have declined substantially, with only around 5,500 MW offered in
the week after 1 October, as more VRE generators shifted their offers towards their break-even price or short run
marginal cost (SRMC) within the -$100/MWh to -$35/MWh ranges (Figure 25). Typically, a VRE generator’s break-
even price is influenced by the value of an LGC, however other factors such as a generator’s power purchase
agreements (PPAs) and portfolio position are also key determinant to this price.

Figure 24 Significant increase in minus $35/MWh to $50/MWh price band in Q4 2021
South Australian negative spot price band - % of the time

                                100%
     % of time spot price
NEM market dynamics

1.2.4 Price-setting dynamics
Price-setting behaviour in Q4 2021 continued trends observed in Q3 (Figure 26). Across the NEM, the proportion
of periods in which gas offers set prices declined to 7%, down from 13% in Q3 and 12% in Q4 2020. Wind and
solar price-setting frequency increased to 12% in Q4 from 10% in Q3, an increase of eight percentage points
since Q4 2020. Q4 2021 prices were set by these sources for 23% of the time in South Australia and 16% in
Victoria. The ongoing price separation between northern and southern NEM regions noted in Section 1.2 meant
that black coal set prices much less frequently in the south, with brown coal increasing its price-setting frequency
in Victoria, South Australia and Tasmania.

Figure 26 Thermal price-setting frequency steady in the north, falling in the south
Price-setting by fuel type

                            100%
   Percentage of time (%)

                            80%
                            60%
                            40%
                            20%
                             0%
                                                                     Q4 21

                                                                                                                  Q4 21

                                                                                                                                                             Q4 21
                                   Q4 20
                                             Q1 21

                                                                                  Q4 20
                                                                                          Q1 21

                                                                                                                           Q4 20
                                                                                                                                   Q1 21

                                                                                                                                                                       Q4 20
                                                                                                                                                                                Q1 21

                                                                                                                                                                                                          Q4 21

                                                                                                                                                                                                                      Q4 20
                                                                                                                                                                                                                              Q1 21
                                                                                                                                                                                                                                      Q2 21

                                                                                                                                                                                                                                                      Q4 21
                                                     Q2 21
                                                             Q3 21

                                                                                                  Q2 21
                                                                                                          Q3 21

                                                                                                                                           Q2 21
                                                                                                                                                   Q3 21

                                                                                                                                                                                        Q2 21
                                                                                                                                                                                                  Q3 21

                                                                                                                                                                                                                                              Q3 21
                                                 QLD                                          NSW                                          VIC                                          SA                                            TAS

                                                     Black Coal                     Brown Coal                            Gas             Hydro                 Wind                Solar                   Other

Note: price setting can occur inter-regionally; for example, Victoria’s price can be set by generation offers in other NEM regions.

Black coal and gas offers set prices at higher average levels in Q4 (Figure 27), and their significant role in
price-setting frequency in the northern NEM regions goes towards explaining the regional price differentials
observed in the quarter (Section 1.2). Increases in underlying traded prices for black coal and gas, discussed in
Section 2.2.1, were likely to have been influences on offer price levels for some of these generators.

Figure 27 Black coal and gas offers setting higher prices in Q4 2021
Average prices set by fuel type

                            180
                                                                                                                                154
                            160
                                                                                                              134
                            140
                            120                                                                                                                                       102
   $/MWh

                            100
                                                                                             71                                                    75                                    68
                             80                        61                67
                             60    45                                                                                                                                                                        39
                             40
                             20                                                                                                                                                                                                  7                    11
                              0
                                   Q4 2020

                                                                        Q4 2021

                                                                                            Q4 2020

                                                                                                                                Q4 2021

                                                                                                                                                   Q4 2020

                                                                                                                                                                                        Q4 2021

                                                                                                                                                                                                            Q4 2020

                                                                                                                                                                                                                                                  Q4 2021
                                                                                                                                                                      Q3 2021
                                                      Q3 2021

                                                                                                              Q3 2021

                                                                                                                                                                                                                               Q3 2021

                                              Black coal                                                      Gas                                                    Hydro                                             Brown coal

© AEMO 2022 | Quarterly Energy Dynamics Q4 2021                                                                                                                                                                                                               18
NEM market dynamics

1.2.5 Electricity futures markets
During the quarter, ASX Calendar (Cal) 2022 futures prices increased across all states, from an average of
$57/MWh at the end of Q3 2021 to finish the year at $73/MWh, with participants’ outlooks influenced by wholesale
spot price trends, possible impact from long-term generation unit outages and closures, and potentially higher fuel
cost expectations in 2022.

Queensland led the rally, rising $29/MWh to $91/MWh and reversing its previous spread to New South Wales
which rose $13/MWh to $79/MWh. The spread between the northern and southern states increased by $13/MWh
to $25/MWh on average, with South Australia at $65/MWh while Victoria remained the lowest-priced state at
$56/MWh (Figure 28).

Figure 28 Queensland Cal22 swaps rise strongly
ASX Energy – Cal22 swap price by region – seven-day averages

          100
           90
           80
  $/MWh

           70
           60
           50
           40
           30
            Jan-21   Feb-21 Mar-21 Apr-21 May-21 Jun-21          Jul-21   Aug-21 Sep-21 Oct-21 Nov-21 Dec-21

                      New South Wales           Victoria             Queensland         South Australia

The individual base quarters’ contributions to the Calendar 2022 swap increase were most notable in the
Q1 2022 price movement. Queensland led the rally from $78/MWh at the end of last quarter to finish the year at
$132/MWh, followed by New South Wales (up $17/MWh to $90/MWh), while smaller increases in South Australia
(to $75/MWh) and Victoria (to $57/MWh) emphasised the growing spread between northern and southern NEM
regions (Figure 29).

Figure 29 Queensland Q1 2022 swaps rally
ASX Energy – Q1 2022 swap price by region – seven-day averages

          150

          130

          110
 $/MWh

          90

          70

          50

          30
           Jan-21    Feb-21 Mar-21 Apr-21 May-21 Jun-21          Jul-21   Aug-21 Sep-21 Oct-21 Nov-21 Dec-21

                      New South Wales           Victoria             Queensland         South Australia

© AEMO 2022 | Quarterly Energy Dynamics Q4 2021                                                                  19
NEM market dynamics

1.3 Electricity generation

Figure 30 and Table 3 show the change in NEM generation
                                                                                                 Figure 30 Renewable energy leads output increase
mix in Q4 2021 compared to Q4 2020, while Figure 31                                              Change in supply – Q4 2021 versus Q4 2020
shows the change by time of day. Key outcomes compared
                                                                                                                            600
to Q4 2020 include:
                                                                                                                            400

                                                                                                      Average change (MW)
• NEM instantaneous renewable share of total generation
                                                                                                                            200
           reached a record 61.8%, with distributed PV output
                                                                                                                              0
           accounting for 32% of total generation during the
           interval, followed by wind and grid-scale solar at 28%                                                           -200
           combined.                                                                                                        -400

• Hydro generation increased to its highest Q4 average                                                                      -600
  since 2016, led by Tasmania where La Niña conditions                                                                      -800

                                                                                                                                                              Grid Solar
                                                                                                                                                      Hydro

                                                                                                                                                                             Wind
                                                                                                                                     Distributed PV

                                                                                                                                                                                      Brown Coal

                                                                                                                                                                                                           Black Coal
                                                                                                                                                                                                   Gas
  filled dams to near record levels during the quarter.

• Black coal-fired generation fell to its lowest Q4 average
  since NEM start, with both Queensland and New South
  Wales contributing to the decline.

• Gas generation declined to its lowest Q4 average since 2003, with South Australia falling to its lowest Q4
  average since NEM start.

Table 3 NEM large-scale supply mix by fuel type

 Quarter                                Black coal            Brown coal       Gas                                           Hydro                            Wind                            Grid solar
 Q4 2020                                         52.1%                17.8%                  6.4%                                    6.8%                                  11.9%                         5.0%
 Q4 2021                                         49.8%                17.4%                  5.0%                                    8.5%                                  12.9%                         6.4%
 Change                                              -2.3%             -0.4%                 -1.4%                                   1.7%                                  1.0%                          1.4%

Figure 31 Renewable energy displaces thermal generation in Q4 2021
Change in supply – Q4 2021 versus Q4 2020 by time of day

                        2,500
                        2,000
                         1,500
  Average change (MW)

                         1,000
                          500
                            0
                         -500
                        -1,000
                        -1,500
                        -2,000
                        -2,500
                                 0:00   2:00    4:00         6:00   8:00    10:00    12:00    14:00                 16:00          18:00              20:00      22:00              0:00

                                   Brown Coal        Black Coal      Wind      Gas      Hydro              Grid Solar                            Distributed PV

© AEMO 2022 | Quarterly Energy Dynamics Q4 2021                                                                                                                                                                  20
NEM market dynamics

1.3.1 Coal-fired generation

Black coal-fired fleet
During Q4 2021, average black coal-fired generation declined to 10,016 MW, its lowest Q4 output since NEM start
and 693 MW lower than Q4 2020 (Figure 32). Record low output was driven by both the Queensland and New
South Wales fleet, with output decreasing by 406 MW and 287 MW, respectively (Figure 33).

Figure 32 Q4 NEM black coal-fired output at new lows
Average NEM black coal-fired generation – Q4s

                            14,500
             Average MW

                            13,500
                            12,500
                             11,500
                            10,500
                             9,500
                                       2000
                                              2001
                                                     2002
                                                            2003
                                                                   2004
                                                                          2005
                                                                                 2006
                                                                                        2007
                                                                                               2008
                                                                                                      2009

                                                                                                                                                                                          2020
                                                                                                                                                                                                 2021
                                                                                                             2010
                                                                                                                    2011
                                                                                                                                  2012
                                                                                                                                         2013

                                                                                                                                                       2015
                                                                                                                                                              2016
                                                                                                                                                                     2017
                                                                                                                                                                            2018
                                                                                                                                                                                   2019
                                                                                                                                                2014
Average Queensland black coal-fired output declined to 5,055 MW, its lowest Q4 generation since 2014.
Increased outages (69% unplanned, 31% planned), coupled with units offering capacity at higher price bands and
several black coal units operating at lower availability, were the key drivers of lower output. Key changes:

• Increased outages (mostly unplanned) at Callide C Power Station reduced average output by 334 MW. Higher
  levels of outages were largely due to Unit 4 remaining out of service since its major incident in Q2 2021 18.

• While there were almost no outages during the quarter at Tarong Power Station, average output reduced by
  330 MW compared to Q4 2020, as units were offered at reduced available capacity of around 195 MW after
               10 November 2021 (Figure 34).

• Fewer planned outages at Tarong North and Kogan Creek Power Stations this quarter increased average
  output by 224 MW and 208 MW, respectively.

 Figure 33 Decline in coal generation across the NEM                                                                Figure 34 Reduced availability at Tarong mid-quarter
 Change in coal-fired generation – Q4 2021 vs Q4 2020                                                               Tarong average daily availability – Q4 2021

                            500                                                                                                   1,500
                                                                Kogan
                            300                                 Creek
     Average change (MW)

                                                               Tarong
                                                                                                                     Average MW

                            100       Bayswater                                                                                   1,000
                                                                North                     LYB
                           -100                                                         Yallourn
                                       Eraring                Callide C                   LYA                                       500
                           -300
                           -500          VPB                   Tarong
                                                                                                                                         0
                           -700
                                                                                                                                             22-Oct
                                                                                                                                             29-Oct

                                                                                                                                             26-Nov
                                                                                                                                               3-Dec
                                                                                                                                             10-Dec

                                                                                                                                             24-Dec
                                                                                                                                             31-Dec
                                                                                                                                                1-Oct

                                                                                                                                              17-Dec
                                                                                                                                              15-Oct

                                                                                                                                             12-Nov
                                                                                                                                             19-Nov
                                                                                                                                               8-Oct

                                                                                                                                               5-Nov

                                                            Stanwell PS
                           -900
                                                                                   Rest of state
                           -1100                                                                                                                  TARONG#1                                TARONG#2
                                        NSW                        QLD                    VIC                                                     TARONG#3                                TARONG#4

18
      Callide Unit 4 is currently scheduled to return on 7 April 2023.

© AEMO 2022 | Quarterly Energy Dynamics Q4 2021                                                                                                                                                         21
NEM market dynamics

In New South Wales, despite increased average availability (+466 MW), black coal-fired output declined to its
lowest Q4 average on record this quarter (4,961 MW). A shift in black coal offers to higher price bands, and
displacement by VRE and distributed PV, contributed to lower output. Compared to Q4 2020, an average 1,430
MW of New South Wales coal offers were shifted from lower price levels to bands above $40/MWh (Figure 35).

• Increased outages (mostly planned) at Eraring Power Station, coupled with units shifting around 920 MW of
        capacity on average to higher price bands (>$40/MWh), reduced average output by 430 MW to its lowest
        quarterly output since Q4 2016.

• Average output at Vales Point B Power Station declined by 208 MW to its lowest Q4 level since 2011. With
  small changes to availability (-73 MW) over Q4 2020, lower output was driven by increases in marginal offer
  prices and displacement by VRE output – utilisation rate19 declined from 81% in Q4 2020 to 66% this quarter.

• Fewer outages at Bayswater Power Station increased average output by 307 MW. On average, Bayswater
  units were out of service 17 days compared to 29 days in Q4 2020.

Figure 35 New South Wales black coal-fired generation shifting offers to higher price bands
NSW black coal-fired generation bid supply curve – Q4 2021 vs Q4 2020

                     200
                                Q4 2021         Q4 2020
     Price ($/MWh)

                     150

                     100

                     50

                       0
                        3,500    4,000             4,500             5,000                   5,500                    6,000                             6,500
                                                                Offers (MW)

Brown coal-fired fleet

Average brown coal-fired generation decreased by 158 MW
                                                                                Figure 36 Decline in midday brown coal output
compared to Q4 2020 as reduced output from Yallourn                                       more pronounced in Q421
(-170 MW) and Loy Yang A (-78 MW) more than offset                              Brown coal average output by time of day – selected quarters
increases from Loy Yang B (+91 MW).
                                                                                             4,100
Despite an increase in average availability compared to
Q4 2020 (+115 MW), brown coal-fired output declined as                                       3,700
                                                                                Average MW

low and negative daytime spot prices in Victoria induced
                                                                                             3,300
more flexible operation, with average utilisation rate
reducing from 95% in Q4 2020 to 89% in Q4 2021. While
                                                                                             2,900
brown coal units have exhibited flexibility in previous
quarters, the decline in daytime generation this quarter was                                 2,500
even more pronounced – compared to Q4 2020 and
                                                                                                                                        10:05
                                                                                                                                                12:05

                                                                                                                                                                16:05
                                                                                                                                                                        18:05
                                                                                                                                                                                20:05
                                                                                                                   4:05

                                                                                                                                                        14:05

                                                                                                                                                                                        22:05
                                                                                                     0:05
                                                                                                            2:05

                                                                                                                          6:05
                                                                                                                                 8:05

Q3 2021, output between 1000 hrs and 1600 hrs during
Q4 2021 was 448 MW and 383 MW lower, respectively                                                              Q420                      Q321                       Q421
(Figure 36).

19
     Ratio of generator’s average generation divided by average availability.

© AEMO 2022 | Quarterly Energy Dynamics Q4 2021                                                                                                                                                 22
NEM market dynamics

1.3.2 Gas-powered generation
During Q4 2021, NEM gas generation declined to 1,000 MW on average, 486 MW lower than the previous quarter
and 318 MW less than Q4 2020, reaching its lowest Q4 average since 2003 (Figure 37).

South Australia20 (333 MW on average) led the decline to its lowest Q4 average since NEM start (Figure 38),
while Queensland (546 MW) decreased to its lowest Q4 average since 2018.

Figure 37 Gas generation declines to its lowest Q4 since 2003
Average Q4 gas generation by state

                  3,000
                  2,500
 Average MW

                  2,000
                  1,500
                  1,000
                   500
                      0

                                                                                  QLD           SA        NSW   VIC            TAS

During the quarter, elevated gas prices (Section 2.1) coupled with high negative price occurrence frequently
rendered gas generation subeconomic in most regions. In addition, the commissioning of all four synchronous
condensers in South Australia reduced the online synchronous generation requirement to the equivalent of two
large gas generation units from 25 November21, with typical minimum output of 80 MW (Figure 39). Volumes of
gas generation directed thus fell in Q4 2021 (Section 1.5.2).

 Figure 38 Record low Q4 SA gas generation                                                                      Figure 39 Syncons enable lower gas generation
 Average SA gas-fired generation – Q4s                                                                          Average SA Q4 2021 gas-fired generation with two and four
                                                                                                                synchronous condensers
                  1,000
                                                                                                                               600
                   800                                                                                                         500
                                                                                                                  Average MW
     Average MW

                                                                                                                               400
                   600
                                                                                                                               300
                   400                                                                                                         200
                                                                                                                               100
                   200
                                                                                                                                 0
                                                                                                                                                                        10:30
                                                                                                                                                                                12:30

                                                                                                                                                                                                16:30
                                                                                                                                                                                                        18:30
                                                                                                                                                   4:30

                                                                                                                                                                                                                20:30
                                                                                                                                                                                                                        22:30
                                                                                                                                                                                        14:30
                                                                                                                                     0:30
                                                                                                                                            2:30

                                                                                                                                                          6:30
                                                                                                                                                                 8:30

                     0
                                 2000
                                        2002
                                               2004
                                                      2006
                                                             2008

                                                                                                       2020
                                                                                                2018
                          1998

                                                                    2010
                                                                           2012
                                                                                  2014
                                                                                         2016

                                                                                                                                 Syncons testing                           Syncons commissioned

20
     AGL Torrens Island Unit A1 was officially withdrawn on 30 September 2021 with no impact on Q4 2021 averages, as last generation was in
     September 2020.
21
     AEMO moved to four synchronous condenser operation for system normal conditions as of 1900 hrs on 25 November 2021. For more
     information, refer to Market notice 92718 and https://aemo.com.au/energy-systems/electricity/national-electricity-market-nem/system-
     operations/congestion-information-resource/related-resources/operation-of-davenport-and-robertstown-synchronous-condensers

© AEMO 2022 | Quarterly Energy Dynamics Q4 2021                                                                                                                                                                                 23
NEM market dynamics

1.3.3 Hydro
Hydro generation increased by 307 MW on average compared to Q4 2020 (Figure 40), influenced by La Niña
conditions with increased rainfall mainly in Tasmania, coupled with higher mainland prices and volatility.

Figure 40 Hydro Tasmania leads hydro generation increase
Q4 average hydro generation by state
                2,500
                                                                                                                                                              TAS             VIC             NSW             QLD
                2,000
   Average MW

                1,500

                1,000

                 500

                   0
                                Q4 12           Q4 13               Q4 14                  Q4 15             Q4 16               Q4 17           Q4 18                Q4 19              Q4 20                Q4 21

By region compared to Q4 2020:

• Tasmania was the main contributor to higher NEM hydro output, increasing 243 MW to 1,024 MW to its
    highest Q4 average since 2018, with hydro generators in the region bidding an additional 388 MW below
    $40/MWh, as high rainfall increased dam levels to near record levels, finishing the quarter at 49%. Generation
    increased especially in the first two months of the quarter, capturing higher mainland evening peak prices via
    Basslink exports but importing in the middle of the day, while in December generation fell and Basslink
    switched to higher Tasmanian imports (Figure 41).

• Mainland – hydro output increased by 65 MW on average to 677 MW. Victoria (+46 MW) and Queensland
  (+33 MW) were the main contributors to the increase, ramping up especially during the evening shoulder
    period to capture increasing prices, while output in New South Wales was comparable to last year.

Figure 41 Hydro Tasmania generation flex
Q4 2021 Tasmania hydro generation, regional prices, and Basslink transfer by time of day

                1750                                                                                                                                                                                            120
                1500                                                                                                                                                                                            100
                1250                                                                                                                                                                                            80
   Average MW

                1000
                                                                                                                                                                                                                60
                                                                                                                                                                                                                      $/MWh

                 750
                                                                                                                                                                                                                40
                 500
                                                                                                                                                                                                                20
                 250
                   0                                                                                                                                                                                            0
                -250                                                                                                                                                                                            -20
                -500                                                                                                                                                                                            -40
                                                                                                                                                                                      18:05
                                                           10:05
                                                                   12:05

                                                                                   16:05
                                                                                           18:05
                                                                                                   20:05

                                                                                                                                                      10:05
                                                                                                                                                              12:05

                                                                                                                                                                              16:05
                                                                                                           22:05

                                                                                                                                                                                              20:05
                                                                                                                                                                                                      22:05
                                      4:05

                                                                                                                                 4:05
                                                                           14:05

                                                                                                                                                                      14:05
                        0:05
                               2:05

                                             6:05
                                                    8:05

                                                                                                                   0:05
                                                                                                                          2:05

                                                                                                                                        6:05
                                                                                                                                               8:05

                                                October-November                                                                                      December

                               Generation [LHS]                                     Basslink [LHS]                                      TAS Price [RHS]                                       VIC Price [RHS]

© AEMO 2022 | Quarterly Energy Dynamics Q4 2021                                                                                                                                                                               24
NEM market dynamics

1.3.4 Wind and solar
Total VRE generation across the NEM reached 31.8 terawatt hours (TWh) by the end of 2021, representing 17%
of the NEM generation mix (Figure 42). Compared to 2020, VRE output increased by 5.4 TWh in 2021, with wind
and grid-solar contributing 3.3 TWh and 2.1 TWh, respectively. While VRE output continued to grow as new
capacity additions commenced generation in the NEM, its annual growth rate of 20% was similar to 2020.

Figure 42 NEM VRE output increased by 20%
NEM VRE – annual generation

                            35

                            30
     Generation (TWh)

                            25

                            20

                            15

                            10

                            5

                            0
                                  2010    2011   2012   2013   2014     2015    2016    2017   2018   2019     2020     2021

                                                                 Wind      Grid Solar

Compared to Q4 2020, average grid-scale VRE generation in Q4 2021 increased by 425 MW, with grid-scale
solar and wind contributing 269 MW and 156 MW, respectively. Higher output was concentrated in
New South Wales (+265 MW) and Victoria (+203 MW, Figure 43) due to ramping up of capacity that was still
commissioning in Q4 202022 as well as new capacity additions over the past year.

Figure 43 NSW and VIC lead VRE output increase
Average change in VRE generation – Q4 2021 vs Q4 2020

                            350
                                                                                                        Wind      Grid-solar
      Average change (MW)

                            250

                            150

                             50

                            -50
                                         NSW             QLD                   SA              VIC                TAS

22
     Includes projects which started generating in quarter(s) earlier than the comparison period (Q4 2020) but had not reached full capacity.

© AEMO 2022 | Quarterly Energy Dynamics Q4 2021                                                                                                 25
NEM market dynamics

Increased VRE output also resulted in several renewable generation records during the quarter, including:

• Highest NEM instantaneous renewable share of total generation 23 – on 15 November 2021, renewable
  penetration (including grid-scale wind and solar, hydro, biomass, battery discharge and distributed PV)
  reached a reached a record high 61.8% of total NEM generation in the half hour ending 1130 hrs (Figure 44),
            surpassing the previous record set in Q3 2021 of 61.4%.

            – During this interval, distributed PV output accounted for 32% of total generation, followed by VRE output
              (wind and grid-scale solar) at 28%.

• Highest NEM average renewable share of total generation – NEM average renewable share reached
  34.9% of total generation during the quarter, surpassing the previous record set in Q3 2021 (31.6%).

• Highest grid-scale solar output – NEM grid-scale solar output reached 4,444 MW in the half-hour ending
  1200 hrs on 24 December 2021, 560 MW higher than the previous record set in Q3 2021.

Figure 44 NEM instantaneous renewable penetration reached 61.8%
NEM instantaneous renewable penetration quarterly records

                                 70%

                                 60%
     Renewable penetration (%)

                                 50%

                                 40%

                                 30%

                                 20%

                                 10%

                                 0%
                                       Q1 19   Q2 19   Q3 19    Q4 19    Q1 20   Q2 20 Q3 20 Q4 20   Q1 21   Q2 21   Q3 21   Q4 21

                                                               Maximum           Average     Minimum

Average grid-scale solar generation reached a quarterly high of 1,291 MW, surpassing the previous record (set in
Q1 2021) by 221 MW. A marked increase in grid-solar curtailment on Q4 2020 levels (+159 MW, Section 1.5.3)
and lower solar irradiation, particularly in November due to wet conditions, were more than offset by ramping up of
recently installed capacity and new capacity additions particularly in New South Wales and Victoria. During the
quarter, two new solar farms commenced generation in New South Wales – Hillston Sun Farm (85MW) and
Sebastopol Solar Farm (90 MW).

23
     Instantaneous renewable penetration is calculated using the NEM renewable generation share of total generation. The measure is
     calculated on a half-hourly basis, because this is the granularity of estimated output data for distributed PV. Renewable generation includes
     grid-scale wind and solar, hydro generation, biomass, battery generation and distributed PV, and excludes battery load and hydro pumping.
     Total generation = NEM generation + distributed PV generation.

© AEMO 2022 | Quarterly Energy Dynamics Q4 2021                                                                                                  26
NEM market dynamics

• In New South Wales, increased output (+176 MW) was predominantly driven by ramping up of recently
  installed capacity (Sunraysia, Wellington, Darlington Point and Limondale 1 solar farms), which accounted for
           88% of the increase. Similarly, in Victoria the continued ramp up at Kiamal and Glenrowan solar farms
           accounted for majority of the output increase in the region.

• Despite small capacity additions over the past year, grid-solar output in South Australia was largely unchanged
  (-1 MW) due to lower output in November driven by below average solar irradiation.

Wind output increased by 156 MW on average, with increases in Victoria and New South Wales (+211 MW
combined) while output in South Australia and Tasmania declined by 37 MW and 22 MW, respectively. Drivers for
increased wind output were a combination of ramping up at recently installed capacity and new capacity additions
in Victoria and New South Wales, more than offsetting lower NEM wind speeds during the quarter (average wind
available capacity factor24 falling to 32% in Q4 2021 from 35% in Q4 2020) and small increases in wind
curtailment (+25 MW). Two new wind farms commenced generation during the quarter, one in Victoria
(Diapur Wind Farm, 7 MW) and one in South Australia (Lincoln Gap Wind Farm Stage 2, 85 MW).

1.3.5 NEM emissions
During the quarter, NEM emissions declined to the lowest quarterly total on record at 28 million tonnes carbon
dioxide equivalent (MtCO2-e), 8% lower than the previous quarterly low in Q4 2020 (Figure 45), driven by reduced
thermal generation and demand combined with continuing growth in VRE output.

Figure 45 Record low quarterly emissions
Quarterly NEM emissions and emissions intensity (Q4s)

                           50                                                                                              1.0
                           45

                                                                                                                                 Emissions Intensity (tCO2-e/MWh)
                           40                                                                                              0.8
     Emissions (MtCO2-e)

                           35
                           30                                                                                              0.6
                           25
                           20                                                                                              0.4
                           15
                           10                                                                                              0.2
                            5
                            -                                                                                              -
                                2011   2012   2013   2014   2015   2016     2017    2018     2019     2020      2021

                                                      Emissions           Emissions Intensity

24
     Capacity factors of each project are weighted by maximum capacity to derive weighted average by state. Project capacity factors are
     calculated using the availability divided by its maximum installed capacity. The use of availability instead of generation removes the impact
     of curtailment.

© AEMO 2022 | Quarterly Energy Dynamics Q4 2021                                                                                                                     27
You can also read