Cooling South Melbourne - IMPACT ANALYSIS OF COOLING INTERVENTIONS - Urban Heat Island Mitigation ...
←
→
Page content transcription
If your browser does not render page correctly, please read the page content below
Cooling South Melbourne
 IMPACT ANALYSIS OF COOLING INTERVENTIONS

                                   Built
                                   Environment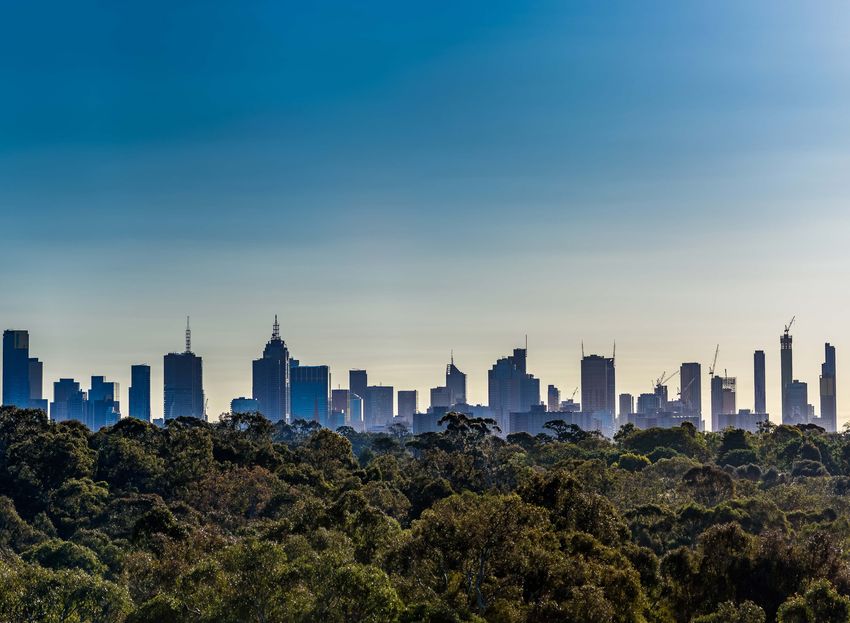
Contents

                                                   Executive Summary                                                                                          4

                                                   Part 1 - Overview                                                                                          7
                                                   Climate Conditions in Melbourne                                                                            8
                                                   Urban Development Characteristics                                                                          9
                                                   Urban Overheating Challenges                                                                              14

                                                   Part 2 - Urban Overheating Mitigation Strategies to Inform Strategic Planning                             23
                                                   The Need for Urban Heat Mitigation in Planning Processes                                                  24
                                                   Proposed Urban Overheating Mitigation Strategies                                                          25
                                                      » Greater Melbourne                                                                                    25
                                                      » South Melbourne Study Area                                                                           25

                                                   Part 3 - Impact Analysis of Cooling Interventions                                                         27
                                                   Cooling Potential for Greater Melbourne in 2020 and 2050                                                  28
                                                      » High Albedo for Urban Surfaces                                                                       31
                                                      » Urban Greenery                                                                                       31
                                                      » Water Irrigation                                                                                     31
                                                      » Combination of Cooling Interventions                                                                 32
                                                      » Informing the South Melbourne Study Area                                                             35
                                                   Cooling Potential for the South Melbourne Study Area in 2020 and 2050                                     36
                                                      » Scenario 1 - New Buildings with Business as Usual Private Green Coverage                             38
                                                      » Scenario 2 - New Buildings with Moderate Private Green Coverage and Additional Public
Date: November 2020                                     Realm Green Coverage                                                                                 40
                                                      » Scenario 3 - New Buildings with Optimised Private Green Coverage and Additional Public
Authors:                                                Realm Green Coverage                                                                                 42
Lan Ding, UNSW
Henry Petersen, UNSW                                  » Scenario 4 - New Buildings and Cool Materials for all Streets, Footpaths and Private Hard Surfaces   44
William Craft, UNSW
Mattheos Santamouris, UNSW                            » Scenario 5 - New Buildings and Cool Roofs for all New and Existing Buildings                         46
Deo Prasad, UNSW                                      » Scenario 6 - Cool Roofs for all Existing Buildings                                                   48
Paul Osmond, UNSW
Renae Walton, City of Port Phillip                    » Scenario 7 - Combination of all Interventions                                                        50
Steven McKellar, City of Port Phillip
David O’Reilly, City of Port Phillip
                                                      » Scenario 8 - Combination of all Interventions Including Water Misting                                52
                                                      » Scenario 9 - New Buildings with Increased Building Height                                            54
Acknowledgment:                                       » Comparative Impact Analysis of Cooling Potential                                                     56
Special thanks go to Serena Falasca, UniUrb, for
the meso-scale modelling and analysis.
                                                   Part 4 - Informing the South Melbourne Central Structure Plan                                             59
Many thanks also go to A/Professor Philip
Oldfield, Dr Riccardo Paolini and Dr Shamila       Cooling Intervention Results in a Planning Context                                                        60
Haddad for their support and assistance.
                                                   Recommendations to Inform the Future Planning of South Melbourne                                          62

Above: Outdoor Summer Event at the South           Part 5 - Urban Heat Island Mitigation Decision-Support Tool                                               73
Melbourne Market
                                                   Overview of Key Functions                                                                                 74
Photo: City of Port Phillip
Cover & Back: South Melbourne Town Hall            South Melbourne Cooling Interventions in a 3D Interactive Platform                                        75
Photo: Donaldytong / Wikimedia / CC BY-SA 3.0
                                                   References                                                                                                76

2     Cooling South Melbourne                                                                                                                                3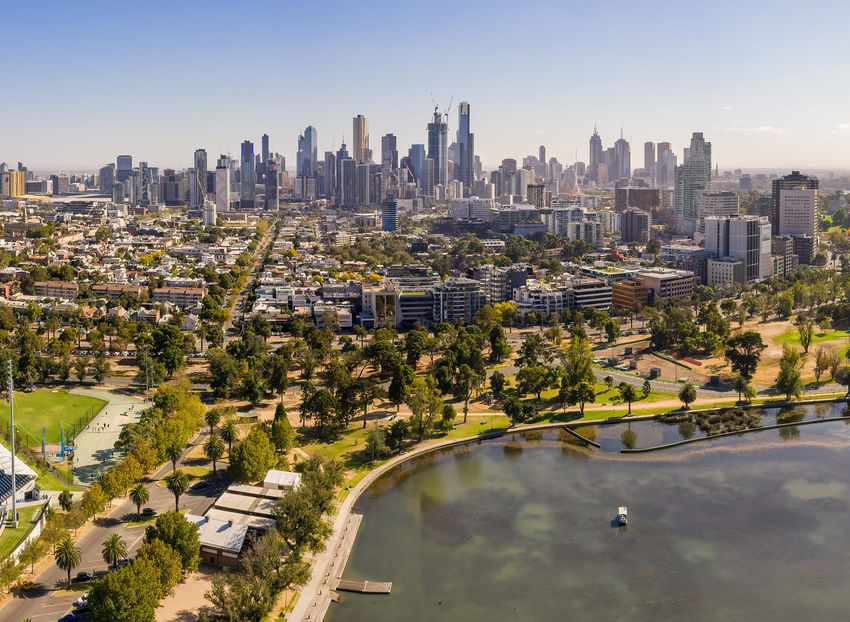
Executive Summary

Climate change is the defining             species selection and planting          which enabled the nine cooling           air conditioning use and thereby
challenge of our time. Just last           density) and private realm building     intervention scenarios in the            limit potential heating effects from
year, 2019 was the second warmest          design (form, structure, materials      microscale level to be modelled          the waste heat of air conditioning.
year and ended the warmest                 and green infrastructure), as well      using ENVI-met, a computation fluid      The most effective intervention
decade (2010- 2019) ever recorded          as identifying suitable locations for   dynamics (CFD) model. This impact        scenario was the combination of
(WMO, 2020). The City of Port              cooling interventions. Its purpose      analysis highlights the maximum          all mitigation strategies including
Phillip has identified the need            is also to model this information       possible cooling potential for the       water misting sprays, which had a
to reduce the urban heat island            so that it can be used in the           South Melbourne Study Area under         significant localised cooling impact
(UHI) effect – increased ambient           development and testing of built        both current climate conditions          on street level air and surface
temperature in high-density urban          form and public realm interventions     in 2020 and future conditions in         temperatures. The combination of
areas compared to surrounding              that will inform and provide            2050. These nine scenarios and           all cooling interventions was able to
suburban or rural areas – as a key         supporting strategic justification      their cooling potential have also        respond to the diversity of land use
priority in developing a greener,          for updating the South Melbourne        been integrated into the online and      and urban typologies throughout the
cooler and more liveable city that is      Structure Plan (2007).                  interactive Microclimate and Urban       study area.
resilient and can adapt to climate                                                 Heat Island Mitigation Decision-
                                           To ensure the development of a                                                   One of the redevelopment
change (City of Port Phillip, 2018).                                               Support (UHI-DS) Tool.
                                           greener, cooler and more liveable                                                scenarios involved the increasing
Many of the City of Port Phillip’s
                                           city in the future, this report         The results of this impact               of building heights within the key
local strategies, guidelines, plans
                                           identifies key urban overheating        analysis show that all nine              redevelopment precincts of the
and policies for future planning
                                           challenges for both Greater             cooling intervention scenarios           study area beyond the maximum
therefore prioritise the need to
                                           Melbourne and the South Melbourne       can effectively reduce street level      permissible planning controls. This
minimise the impacts of increased
                                           Study Area and proposes urban           air and surface temperatures             scenario resulted from a careful
urban overheating.
                                           overheating mitigation strategies       throughout the South Melbourne           consideration of transitional
The South Melbourne Study                  to address them. These mitigation       Study Area under current and future      building scale, integration
Area has been highlighted as               strategies include increasing           climate conditions. Increasing urban     with public and private green
an area that, due to its land use,         public and private urban greenery,      greenery in the public realm and         infrastructure, material properties,
demographics and ambient                   water misting, changes to street,       the addition of cool materials for all   and prevailing wind flows through
temperature, is considered by              footpath and roof materials, as         streets, footpaths and private hard      the study area. It was shown that
Council to be a heat vulnerability         well as a combination of these, and     surfaces was highly effective at         if planning controls effectively
hot spot. Additionally, the area is        are consolidated into nine cooling      reducing street level air and surface    address these factors, an increase
expected to undergo change in the          intervention scenarios for the South    temperatures, especially in business     in future density in the study area
coming years with a new structure          Melbourne Study Area. These             and retail precincts that have           does not have to mean the impacts
plan slated for development in the         intervention scenarios are informed     wider, unshaded streets. Moderate        of the UHI effect are exacerbated.
coming 12 months. A key challenge          by a cooling impact analysis of         green infrastructure for private
                                                                                                                            Developed from the outcomes
for the City of Port Phillip is to         Greater Melbourne using the             green coverage demonstrated an
                                                                                                                            of the impact analysis of cooling
manage this future growth and              Weather Research & Forecasting          effective scenario for new buildings.
                                                                                                                            intervention scenarios, a set of
redevelopment in South Melbourne           (WRF) model and are tailored            While the impact of cool roofs is
                                                                                                                            recommendations are provided to
in a way that does not limit its ability   specifically to the urban context of    less than cool materials for hard
                                                                                                                            inform future planning of South
to mitigate and adapt to urban heat.       South Melbourne and the Structure       urban surfaces, it is important to
                                                                                                                            Melbourne towards 2050.
                                           Plan controls.                          note, given the extent of existing
The primary purpose for this report                                                buildings with aging roof materials
is to gather information in response       3D model data for the study             in the study area, that cool roofs
to this challenge, which includes          area, including typologies of           can lead to significant reductions
information that could influence           new buildings and private               in roof surface temperatures. This
the design of both the public realm        green coverage scenarios, was           can potentially improve indoor
(surface types, material use, plant        provided by the City of Port Phillip    thermal comfort, reduce energy and

4    Cooling South Melbourne                                                                                                                                        5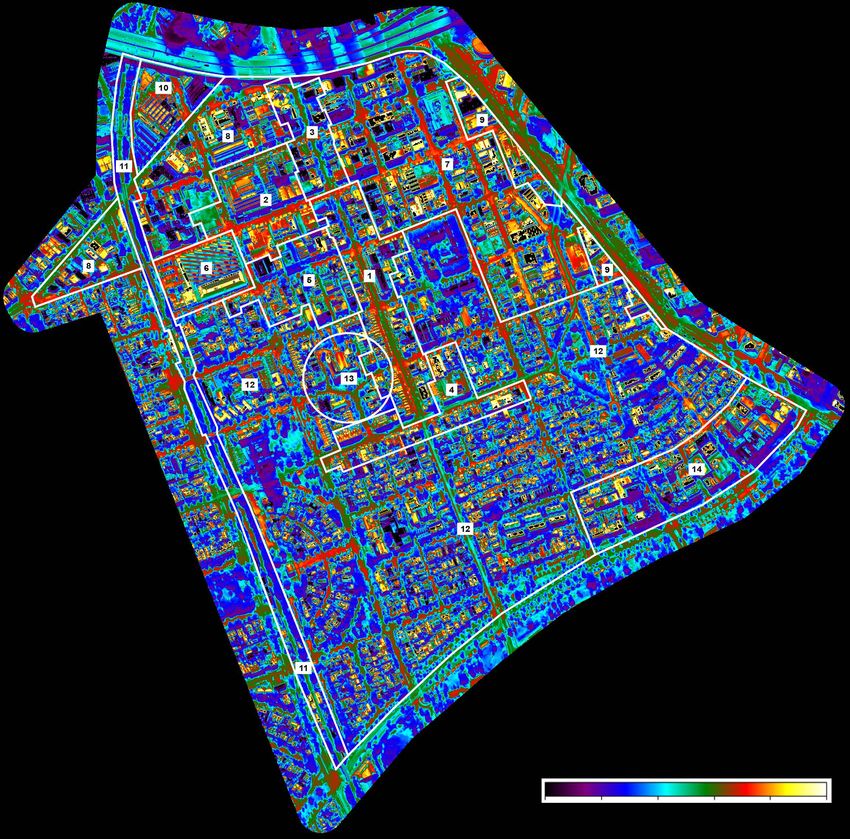
Part 1 - Overview

                                                  Left: Melbourne CBD
                                                  skyline
                                                  Photo: Adam Calaitzis /
                                                  Adobe Stock

6   Cooling South Melbourne                                                 7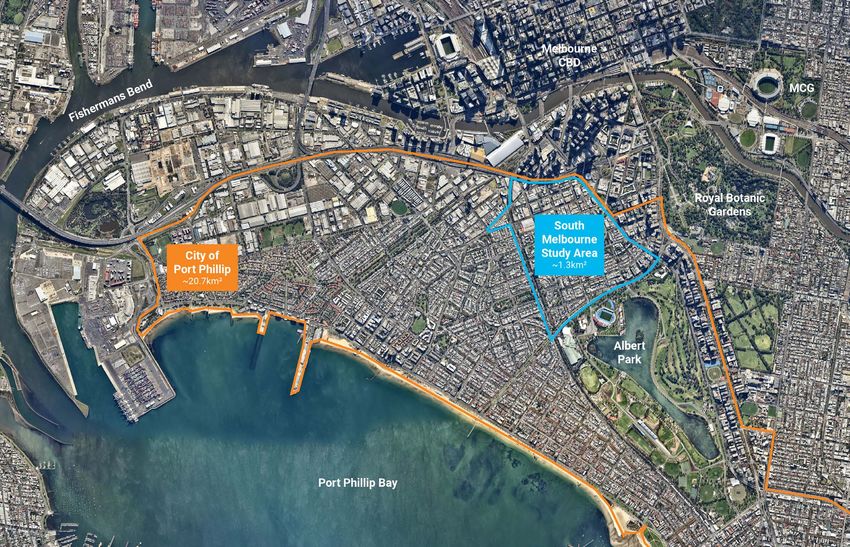
Climate Conditions in Melbourne                                                               Urban Development Characteristics

Greater Melbourne is characterised              annual temperatures could increase            For the last two decades, Melbourne    sustainably (Victorian Government,
by a temperate oceanic climate                  by up to 1.6˚C by the 2030s and               has been experiencing a significant    2017a).
and is well known for its highly                up to 2.7˚C by the 2050s under a              demographic change that is driving
variable weather conditions. These                                                            a population boom in the inner-city    Managing this growth through
                                                high greenhouse gas emissions
temperature swings are due to its                                                             and outer-suburban developments.       higher density urban areas is
                                                scenario. Also under a high
geographic location that is subject                                                           While Melbourne’s transport system     therefore a key challenge for
                                                emissions scenario, the frequency
to both cold air masses from the                                                              has good foundations, including        the City of Port Phillip, which is
                                                of extreme heat days (>35˚C) is
south and hot and dry air masses                                                              the largest tram network in the        already Victoria’s most densely
                                                projected to increase from 8.3
from the desert. This means that                                                              world, the more the city sprawls in    populated municipality (City of Port
                                                days up to 20.4 days by the 2050s
while Melbourne is typically slightly                                                         response to this growing population,   Phillip, 2018). If not planned well,
                                                (Table 1). Similarly, the frequency of
cooler than most other Australian                                                             the more likely it is to “become       increasing density in urban areas
                                                hot nights (minimum temperature
cities in summer, it still experiences                                                        an unsustainable city divided          can have significant environmental
                                                >20˚C) is projected to increase
unpredictable temperature spikes                                                              by disadvantage and inequality”        impacts and exacerbate the UHI
                                                from 5.8 days up to 18.4 days by
and heatwaves, with record                                                                    (Victorian Government, 2017a). In      effect. The South Melbourne Study
                                                the 2050s (Clarke JM et al., 2019)
temperatures exceeding 45˚C (BOM,                                                             addition to creating an urban growth   Area (Figure 1) in this report is a key
                                                (Table 1).
2020a).                                                                                       boundary and developing a city of      development area for increasing
                                                To put this into perspective, CSIRO           20-minute neighbourhoods, the          density within the City of Port
Temperatures will continue to                   suggest that if urgent action isn’t                                                  Phillip municipality. An overview
                                                                                              Victorian Government emphasises
increase across Greater Melbourne               taken to reduce global greenhouse                                                    of its existing and proposed urban        Figure 1: South Melbourne
                                                                                              urban renewal as a key strategy                                                  Study Area within the City of
in the future, but the severity of              gas emissions, Melbourne’s climate                                                   development characteristics is
                                                                                              to ensuring Melbourne grows                                                      Port Phillip municipality
these increases depends on global               in the 2050s could be more like                                                      given below.                              Photo: NearMap, 2020
greenhouse gas emissions over                   Wangaratta’s current climate – a
the coming decades (Clarke JM et                regional city over 200km inland
al., 2019). CSIRO’s recent Greater              from Melbourne (Clarke JM et al.,
Melbourne Climate Projections                   2019).
2019 suggests that maximum

Table 1: Number of extreme heat days and hot nights projected for Greater Melbourne under a
high greenhouse gas emissions scenario (Clarke JM et al., 2019)

                                  Extreme Heat Days
                   (Days/Year with a Maximum Temperature >35˚C)

                1981-2010                                     2040-2059
                  8.3 days                                13.1 to 20.4 days

                                       Hot Nights
                   (Days/Year with a Minimum Temperature >20˚C)

                1981-2010                                     2040-2059
                  5.8 days                                13.3 to 18.4 days

8    Cooling South Melbourne                                                                                                                                                                                   9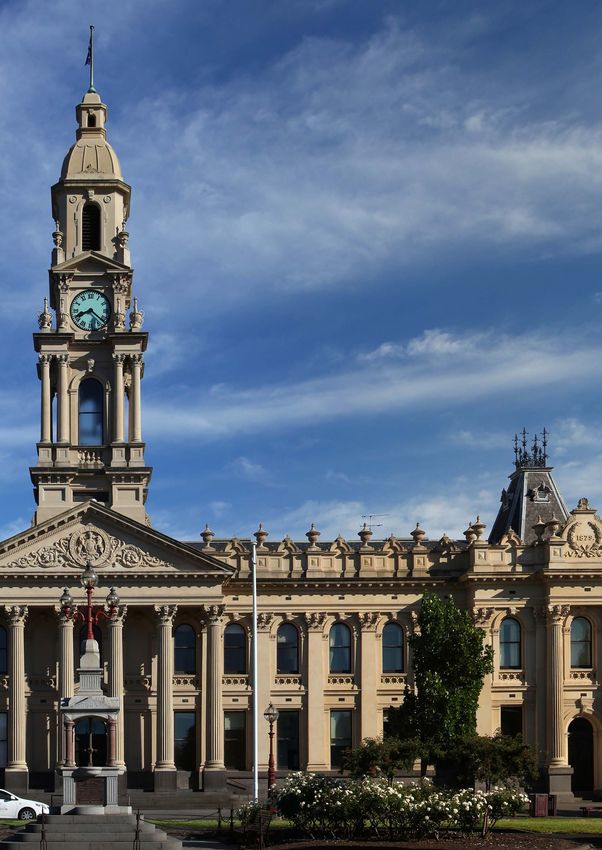
Existing Urban Conditions                 Within the commercial, retail and
                                          industrial areas, buildings are
The South Melbourne Study Area            constructed with a zero setback
has five broader land uses – the          to create a hard street edge. This
South Melbourne Activity Centre,          means that there is limited public
the surrounding business precincts,       open space in these areas but there
mixed-use precincts, the Emerald          are still a few public open spaces
Hill Civic, Cultural and Community        within and surrounding the study
Hub and the heritage residential          area (e.g. small parks in residential
areas. There is a diverse mix of          areas, St Vincent Gardens to the
building types such as the Victorian      west, Albert Park to the south - see
era shopfronts of Clarendon Street,       Figure 2) (City of Port Phillip &
the contemporary commercial and           David Lock Associates, 2007). The
retail development along Kings            existing street canopy coverage of
Way, the heritage residential areas       South Melbourne (17%) is above
dating back to the 1800s and social       the municipal average but the park
housing from the 1960s. There is a        canopy coverage is below (City of
                                                                                  Below: Park Towers
                                                                                  Photo: Mattinbgn / Wikimedia /
substantial portion of the study area     Port Phillip, 2019).                    CC BY-SA 3.0                                                                                                         Left: Fishley Street Terraces
protected by the City of Port Phillip’s
heritage policy which discourages
the demolition of any significant
                                                                                                                   Future Redevelopment                       New development with a range
and contributory buildings (City                                                                                                                              of different building types, scales
of Port Phillip & David Lock                                                                                       In 2007, the City of Port Phillip          and functions are encouraged
Associates, 2007).                                                                                                 adopted the South Melbourne                within these areas provided they
                                                                                                                   Central Structure Plan that outlined       align with the strategic intent
Buildings within the South
                                                                                                                   the vision for any development at          of the Structure Plan. Land use
Melbourne Study Area generally
                                                                                                                   that time. This document divides           changes are proposed to enable
range from two to four storeys with
                                                                                                                   South Melbourne into 13 distinct           South Melbourne to evolve as a
some exceptions such as the South
                                                                                                                   precincts (adapted to 14 for this          unique mixed-use precinct that
Melbourne Town Hall Spire and
                                                                                                                   report – see Figure 2) that have           supports residential, business
Park Towers, as well as more recent
                                                                                                                   similarities in land use patterns          and retail activities, including a
mixed use developments in the
                                                                                                                   and urban character. The existing          creative industries cluster. New
north west and approved but yet to
                                                                                                                   development controls for the               buildings in these key development
be build office developments in the
                                                                                                                   South Melbourne Study Area are             areas are permitted an increase
north east. There is a transitional
                                                                                                                   based on this Structure Plan. The          in height, typically to a maximum
scale throughout the study area
                                                                                                                   South Melbourne Central Urban              of six storeys, but must ensure
from the low-scale residential
                                                                                                                   Design Framework builds upon the           that the streetscape character is
development to the south to the
                                                                                                                   strategic directions of the Structure      maintained and that street level
increased height towards the
                                                                                                                   Plan and sets out the specific urban       interaction is encouraged. New
Kings Way boundary and an abrupt
                                                                                                                   design principles, objectives and          development in these areas also
transition to the high-rise towers
                                                                                                                   built form guidelines to achieve           offers an opportunity to improve the
of Southbank and Docklands. This
                                                                                                                   this vision. It focuses on the areas       public domain by maximising public
is known as the ‘bowl of South
                                                                                                                   that have the most development             open space where possible and
Melbourne Central’ (City of Port
                                                                                                                   potential, which are the business          prioritising sustainable modes of
Phillip & David Lock Associates,
                                                                                                                   and mixed-use areas as well as key         transport (City of Port Phillip, 2007;
2007).
                                                                                                                   individual development sites (City of      City of Port Phillip & David Lock
                                                                                                                   Port Phillip, 2007; City of Port Phillip   Associates, 2007).
                                                                                                                   & David Lock Associates, 2007).

10   Cooling South Melbourne                                                                                                                                                                                                           11
A more detailed description of South Melbourne, meaning that the
the existing and proposed urban current controls will have limited
development characteristics for the influence on future redevelopment
14 precincts is provided in Table 2. in South Melbourne. This review
presents an opportunity for new
It is important to note that a
development controls and public
thorough review of this Structure
realm initiatives to mitigate urban
Plan from 2007 is considered
heat island impacts, and there
necessary, and the City of Port
is a timely opportunity to update
Phillip has commenced preparation
existing planning controls to embed
of a new South Melbourne Structure
the recommendations developed
Plan. This process will likely result
from this study.
in new built form controls for
Left: Sketch showing the
potential to maximise public
open space and encourage
sustainable modes of transport
(City of Port Phillip & David
Lock Associates, 2007)
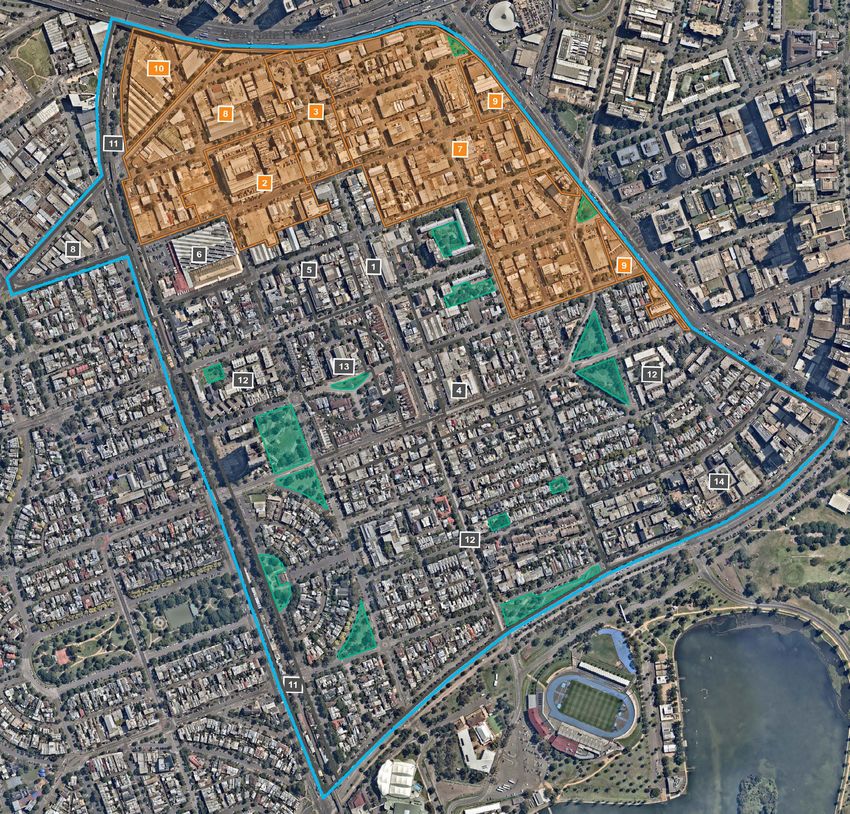
South Melbourne Study Area Precincts: South Melbourne Figure 2: South Melbourne
1. Clarendon Street Core Local Shopping Strip Study Area Boundary Study Area showing the
14 precincts and key
2. Emerging Activity Precinct
South Melbourne Study redevelopment areas
3. Northern Mixed Activity Edge Area Precinct Boundaries Photo: NearMap, 2020
4. Southern Mixed Activity Edge
5. Coventry Street Specialty Shopping Precinct Precincts That Have Significant
6. South Melbourne Market Redevelopment Potential
7. Eastern Business Precinct
8. Western Business Precinct Green Open Space
9. Kings Way Mixed Use Corridor
10. City Road Wedge
11. Ferrars Street Light Rail Corridor
12. Heritage Overlay Residential Areas
13. Emerald Hill Civic, Cultural and Community Hub
14. Southern Business Precinct
12 Cooling South Melbourne 13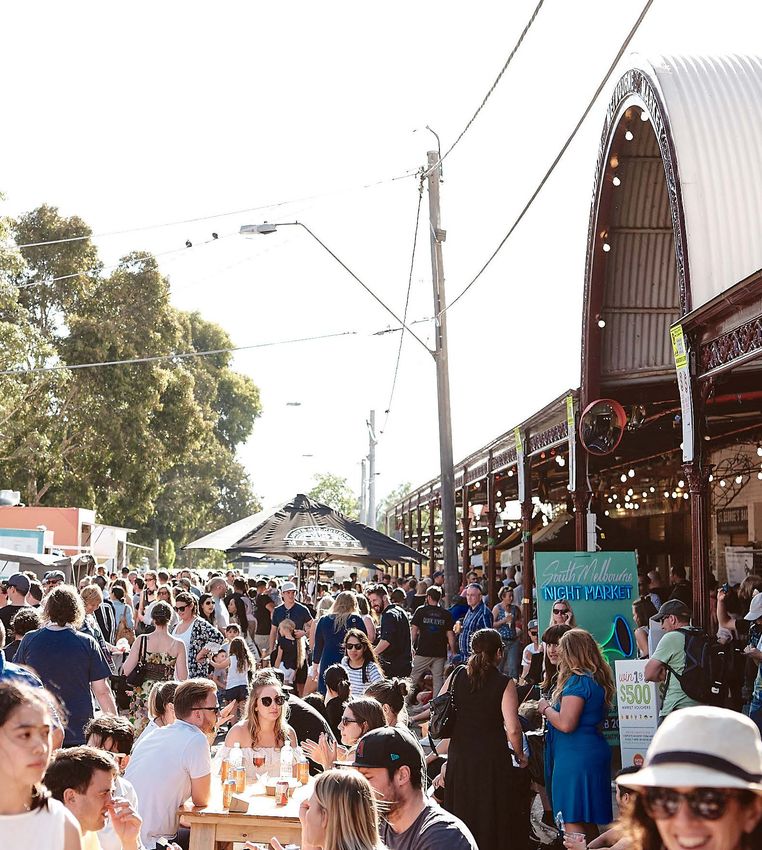
Urban Overheating Challenges

As the population, ambient               seen in the heritage residential
temperature and the frequency of         areas to the south and the social
extreme heat events increases,           housing areas where there is a higher
the challenge of urban overheating       street canopy coverage. Within
grows. While this is a global            these residential areas, a significant
challenge, many of the impacts           number of dwellings have higher
of urban overheating are                 roof surface temperatures which can
experienced at a local level. It         often be attributed to darker or lower
is well documented that higher           performing materials of heritage
ambient temperatures in urban            buildings. Areas of higher overall
areas can have a direct and serious      surface temperatures (shown in red,
impact on the health, wellbeing          yellow and white) are predominantly
and safety of citizens and the           the business, retail and industrial
overall environmental quality of         areas of the South Melbourne Study
a city (Santamouris, 2015). More         Area. Factors that contribute to these
specifically, urban overheating can      higher surface temperatures are the
cause increases in cooling energy        wide unshaded streets, the compact
consumption, peak electricity            urban context and the large exposed
demand, citizen vulnerability, heat      roof surfaces. More specific urban
related mortality and morbidity          overheating challenges for the 14
and levels of harmful pollutants         precincts is provided in Table 2.
(Santamouris, 2020), as well as
cause significant loss of income         Importantly, the areas of higher
for local businesses (Sweeney            overall surface temperatures are
Research & City of Melbourne,            the key redevelopment areas within
2014). A key challenge for the City      the South Melbourne Study Area.
of Port Phillip is to manage this        Therefore, it is crucial that the        Below: Large exposed roofs
                                                                                  of the business, retail and
future growth and redevelopment in       redevelopment of these hot spots         industrial areas of the South

South Melbourne in a way that does       effectively mitigates the impacts of     Melbourne Study Area
                                                                                  Photo: Bob Tan / Wikimedia /
not limit its ability to mitigate and    urban overheating.                       CC BY-SA 4.0
adapt to urban heat.

To help understand the existing
urban overheating challenges
                                                                                                                  South Melbourne Study Area Precincts:
facing South Melbourne, Figure 3
                                                                                                                   1.   Clarendon Street Core Local Shopping Strip       Figure 3: Airborne thermal
shows the surface temperature                                                                                                                                            imagery of the South
                                                                                                                   2.   Emerging Activity Precinct
distribution across the study area                                                                                 3.   Northern Mixed Activity Edge                     Melbourne Study Area taken at
in April 2020. The significant                                                                                                                                           approximately 13:00 on April
                                                                                                                   4.   Southern Mixed Activity Edge
                                                                                                                                                                         14, 2020
variations in surface temperature                                                                                  5.   Coventry Street Specialty Shopping Precinct
                                                                                                                   6.   South Melbourne Market
are influenced by differences in the
                                                                                                                   7.   Eastern Business Precinct
physical urban environment (built                                                                                  8.   Western Business Precinct
form, scale, density, materials, etc.)                                                                             9.   Kings Way Mixed Use Corridor
and land cover (paved, vegetated,                                                                                 10.   City Road Wedge
water, etc.). Areas of lower surface                                                                              11.   Ferrars Street Light Rail Corridor
                                                                                                                  12.   Heritage Overlay Residential Areas
temperatures (shown in purple,                                                                                    13.   Emerald Hill Civic, Cultural and Community Hub
blue and green) are predominantly                                                                                 14.   Southern Business Precinct

14   Cooling South Melbourne                                                                                                                                                                        15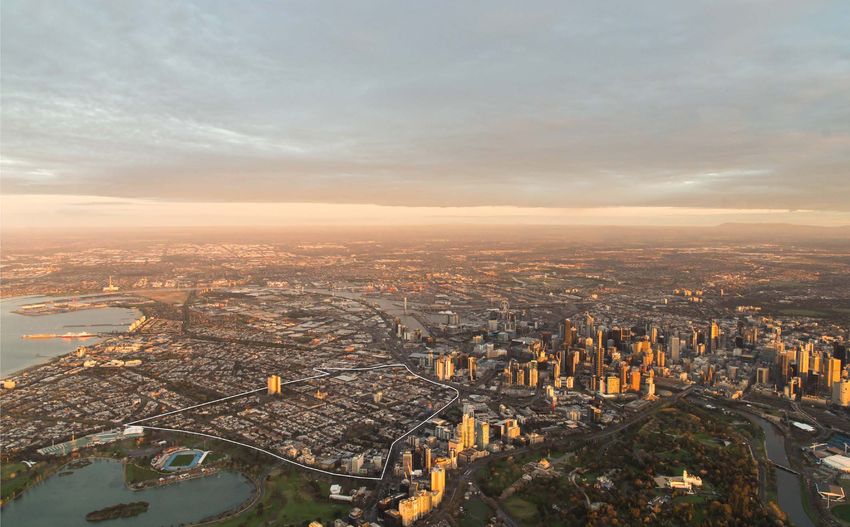
Table 2: Urban development characteristics and overheating challenges in the South Melbourne Study Area
PRECINCTS & URBAN
THERMAL IMAGERY AERIAL IMAGERY STREETSCAPE URBAN DEVELOPMENT CHARACTERISTICS URBAN OVERHEATING CHALLENGES
TYPOLOGIES
1
Clarendon Street
Core Local Shopping
Strip
Existing:
» A dense mix of low-rise buildings (1-3 storeys) that have » Some darker roof materials (especially in areas of heritage
predominantly retail functions and are heritage protected buildings) which could result in indoor thermal discomfort
» Low tree canopy coverage along streets during high temperature days
COMPACT LOW-RISE
» Predominantly paved surfaces in public and private areas » Large areas of unshaded impervious ground cover - wide
streets (e.g. Clarendon St, Coventry St, Park St)
4 » Surrounded by wide streets (>28m) with moderate volumes
(Retail)
of street and on-site parking » Contested urban space (e.g. tram line, retail functions)
Southern Mixed limits opportunities for urban vegetation in public areas
Potential New Development:
Activity Edge » Compact urban context limits opportunities for urban
» New development in these precincts is quite limited due to
heritage restrictions with a few isolated exceptions (e.g. vegetation in private areas
between Bank St and Park St, east of Clarendon St) » Any new development must be carefully considered so it
» Medium-rise (3-9 storeys) mixed-use development does not exacerbate the impacts of urban overheating (e.g.
encouraged with ground level retail with commercial or urban greenery, material selection, etc.)
residential above
5
Coventry Street
Specialty Shopping
Precinct
Existing:
» A dense mix of medium-rise buildings (3-9 storeys) » Abundant urban surface materials that absorb and store
» Low tree canopy coverage along streets large amounts of heat
» Predominantly paved surfaces in public and private areas
MEDIUM-RISE
» Large areas of unshaded impervious ground cover - wide
2
COMPACT
» Surrounded by wide streets (>28m) with moderate/high streets (e.g. York St, Cecil St)
volumes of street and on-site parking
Emerging Activity Potential New Development: » Compact urban context limits opportunities for urban
Precinct » New development is limited due to recent developments vegetation in private areas
and heritage restrictions with a few isolated exceptions » Any new development must be carefully considered so it
(e.g. south of York St) does not exacerbate the impacts of urban overheating (e.g.
» Medium-rise (3-9 storeys) mixed-use development with urban greenery, material selection, etc.)
primarily retail and business functions
Existing: » Large roof areas exposed to direct solar radiation
» Open arrangements of large footprint low-rise buildings (extensive rooftop solar contributes to higher surface
LARGE LOW-RISE
(1-3 storeys) temperatures in certain areas)
» Low tree canopy coverage along streets » Large areas of unshaded impervious ground cover (e.g.
6 » Predominantly paved surfaces in public and private areas wide streets and on-site carparking)
South Melbourne » Surrounded by wide streets (>28m) with high volumes of » Limited opportunities for urban vegetation in private areas
Market street and on-site parking » Limited shading in pedestrian areas for special events
Potential New Development: (surrounding roads used as pedestrian areas with
» Potential to redevelop at grade car park with a medium-rise temporary shading)
(3-9 storeys) mixed-use development that could include » Any new development must be carefully considered so it
parking, commercial, residential and community uses does not exacerbate the impacts of urban overheating (e.g.
urban greenery, material selection, etc.)
16 Cooling South Melbourne 17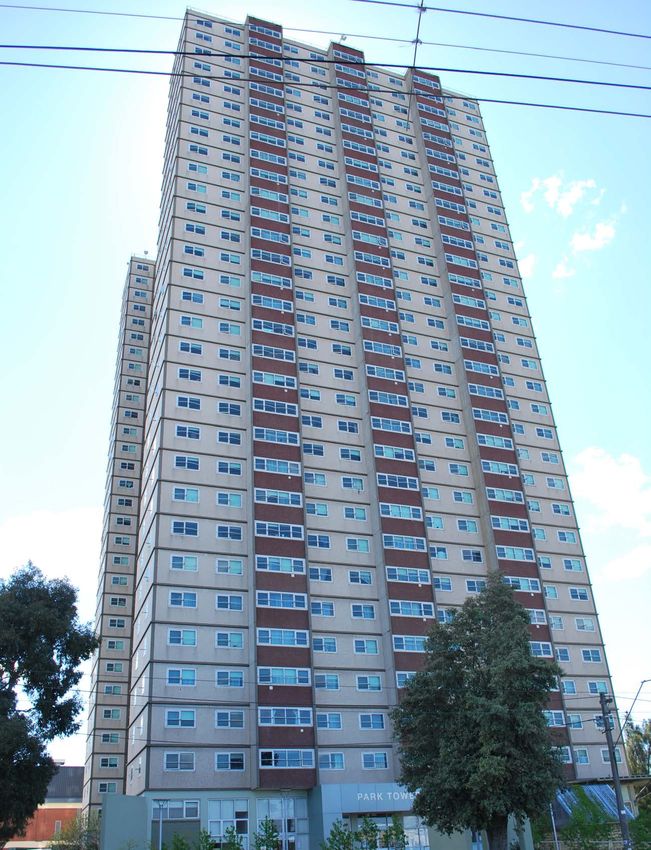
Table 2 (continued): Urban development characteristics and overheating challenges in the South Melbourne Study Area
PRECINCTS & URBAN
THERMAL IMAGERY AERIAL IMAGERY STREETSCAPE URBAN DEVELOPMENT CHARACTERISTICS URBAN OVERHEATING CHALLENGES
TYPOLOGIES
3
Northern Mixed
Activity Edge
Existing: » Abundant urban surface materials that absorb and store
» A dense mix of low-rise (1-3 storeys) and medium-rise large amounts of heat
COMPACT LOW/MEDIUM-RISE
buildings (3-9 storeys) that have predominantly commercial » Increased roof surface temperature and surrounding air
functions temperature from darker roof materials which could also
» Moderate tree canopy coverage along streets result in indoor thermal discomfort during high temperature
7 » Predominantly paved surfaces in public and private areas days
» A mix of wide (>28m), medium (12-28m) and narrow » Large areas of unshaded impervious ground cover - wide
Eastern Business
(9 storeys)
COMPACT LOW/
temperature from darker roof materials which could also result
» Low tree canopy coverage along streets
9 » Predominantly paved surfaces in public and private areas
in indoor thermal discomfort during high temperature days
» Large areas of unshaded impervious ground cover - wide
» Surrounded by wide streets (>28m) with low volumes of
Kings Way Mixed streets (e.g. Kings Way, York St, Coventry St)
street and on-site parking
Use Corridor » Compact urban context limits opportunities for urban
Potential New Development:
vegetation in private areas
» Potential for new medium-rise (3-9 storeys) and high-rise
» Any new development must be carefully considered so it does
(>9 storeys) mixed-use buildings that integrate street level
not exacerbate the impacts of urban overheating (e.g. urban
retail, residential and office uses
greenery, material selection, etc.)
Existing:
» A dense mix of low-rise (1-3 storeys) commercial and
COMPACT LOW-RISE
industrial buildings that are predominantly heritage » Large roof areas exposed to direct solar radiation
protected » Large areas of unshaded impervious ground cover - wide
(Industrial)
» Low/moderate tree canopy coverage along streets streets (e.g. City Rd, Cecil St, Whiteman St)
10 » Predominantly paved surfaces in public and private areas » Compact urban context limits opportunities for urban
City Road Wedge » Surrounded by wide streets (>28m) with low volumes of vegetation in private areas
street and on-site parking » Any new development must be carefully considered so it
Potential New Development: does not exacerbate the impacts of urban overheating (e.g.
» Potential for a new high-rise (>9 storeys) residential urban greenery, material selection, etc.)
building to act as a transitional scale between South
Melbourne Central and the Southbank high-rise
18 Cooling South Melbourne 19Table 2 (continued): Urban development characteristics and overheating challenges in the South Melbourne Study Area
PRECINCTS & URBAN
THERMAL IMAGERY AERIAL IMAGERY STREETSCAPE URBAN DEVELOPMENT CHARACTERISTICS URBAN OVERHEATING CHALLENGES
TYPOLOGIES
» A dense mix of low-rise (1-3 storeys) semi-detached » Increased roof surface temperature and surrounding air
COMPACT LOW-RISE residential buildings that are predominantly heritage temperature from darker roof materials which could also
(Residential) protected result in indoor thermal discomfort during high temperature
» Limited permeable ground cover in private areas days
» Moderate/high tree canopy coverage along streets with » Limited opportunities for private garden spaces
some vegetated street verges and public green spaces » Large areas of unshaded impervious ground cover - the
» A mix of wide (>28m), medium (12-28m) and narrow wider streets (e.g. James Service Pl, Napier St, Stead St,
(9 storeys)
OPEN MEDIUM/
» Abundance of permeable (vegetated) land cover in public » Large building envelopes exposed to direct solar radiation
HIGH-RISE
and private areas due to the open built form arrangements
» High tree canopy coverage along streets with vegetated » Urban heat vulnerability - some inhabitants in social
street verges housing areas may be unable to maintain a thermally
» Surrounded by wide streets (>28m) with moderate/high comfortable indoor environment
volumes of street and on-site parking
» Typically social/affordable housing within urban areas
» A dense mix of low-rise (1-3 storeys) semi-detached » Increased roof surface temperature and surrounding air
COMPACT LOW-RISE
buildings and key public services (e.g. Town Hall, Library, temperature from darker roof materials which could also
13
(Civic Centre)
Police Station) that are heritage protected result in indoor thermal discomfort during high temperature
» A mix of permeable (vegetated) and impervious (paved) days
Emerald Hill Civic,
ground cover in public and private areas » Large areas of unshaded impervious ground cover - wide
Cultural and
» Moderate tree canopy coverage along streets streets (e.g. Perrins St, Bank St, Clarendon St)
Community Hub
» Surrounded by wide streets (>28m) with moderate volumes » Heritage elements may limit cooling potential (e.g.
of street parking bluestone paving, roof materials, etc.)
» A dense mix of medium-rise (3-9 storeys) and high-rise » Abundant urban surface materials that absorb and store
COMPACT MEDIUM/
buildings (>9 storeys) large amounts of heat
» Moderate tree canopy coverage along streets with some
HIGH-RISE
14 vegetated street verges
» Increased roof surface temperature and surrounding air
temperature from darker roof materials which could also
Southern Business » Urban surfaces shaded by surrounding tall buildings result in indoor thermal discomfort during high temperature
Precinct » A mix of predominantly wide (>28m) and medium (12-28m) days
streets with low/moderate volumes of street and on-site » Compact urban context limits opportunities for urban
parking vegetation in private areas
Aerial Images:
NearMap, 2020
Streetscape Images:
Google Streetview, 2020
20 Cooling South Melbourne 21Part 2 - Urban Overheating
Mitigation Strategies to Inform
Strategic Planning
Left: View of South
Melbourne looking north
towards the CBD
Photo: Michael Evans /
Adobe Stock
22 Cooling South Melbourne 23The Need for Urban Heat Mitigation Proposed Urban Overheating
in Planning Processes Mitigation Strategies
Greater Melbourne
Tackling urban overheating environment, urban amenity and
challenges requires multi-sector human health. It investigates The Guide to Urban Cooling Strategies significantly reduce surface and air
collaboration as well as leadership what mitigation strategies are recommends increased tree canopy, temperatures. Melbourne’s relatively
in urban policy and strategic appropriate for Greater Melbourne cool materials, permeable paving low rainfall during summer means that
planning processes to incorporate and a South Melbourne Study and evaporative cooling as effective permeable paving and water irrigation
climate change adaptation and Area, and determines to what strategies for cooling Greater strategies will also be effective for
mitigation strategies. The Victorian extent various cooling intervention Melbourne. Melbourne CBD’s high cooling Greater Melbourne (Osmond &
Government has developed an options involving built form, urban urban density settings results in 12.9% Sharifi, 2017).
Implementation Plan for Plan greenery and cool materials can of canopy cover (Jacobs et al., 2014).
Melbourne 2017-2050 that help in mitigating urban overheating Therefore, increasing tree canopy The cooling impact analysis of high
includes the improvement of and keeping our streetscapes cover is an appropriate strategy to albedo materials, water irrigation,
climate change strategies in the and cities cool. Computer fluid reduce air temperature and improve increased urban greenery and
Victoria Planning Provisions and dynamics models and simulations amenity and thermal comfort at combination of these cooling
all planning schemes, and will are employed to provide scientific street level. To address Melbourne’s interventions for Greater Melbourne
ensure these provisions are based outcomes and establish evidence high solar radiation intensity and UV will be presented in Part 3. The
on scientific outcomes (Victorian to inform future provisions and level in summer, high albedo and outcomes of this impact analysis
Government, 2017b). This report planning schemes at a local level for high emittance1 materials for urban will inform the cooling intervention
demonstrates an urban planning the City of Port Phillip. An overview surfaces such as cool pavements options for the South Melbourne Study
and development approach to of the key processes carried out for and roofs are effective in radiating Area.
mitigating urban overheating and this Cooling South Melbourne report the urban heat away, which can
minimising the impact of climate is shown in Figure 4. Figure 4: Overview of the key
extremes on the outdoor thermal
processes carried out for this
report South Melbourne Study Area
The South Melbourne Study Area, an addition of new buildings in the
inner-city area just south of the CBD, northern and eastern redevelopment
has distinctive urban characteristics areas offers a unique opportunity
and urban overheating challenges to explore the cooling impact of
(Table 2). The proposed urban these three private green coverage
overheating mitigation strategies scenarios (BAU, Moderate and
for this study area are aligned with Optimised), as well as cool materials
the strategies for Greater Melbourne for public and private hard surfaces
but are tailored to its specific urban and cool roofs. Due to Melbourne’s
context. hot and dry summers, water misting
sprays are also investigated as a
The South Melbourne Study Area,
cooling intervention to reduce air
despite having 17% of street canopy
temperatures across the study area.
coverage from existing trees (City 1
Albedo refers to the
of Port Phillip, 2019), still offers Part 3 conducts a cooling impact proportion of incident light
reflected from a surface;
opportunities to increase urban analysis of these cooling interventions its reflectivity. Emittance
greenery in the public realm through for the current climate in 2020 and the refers to the amount of heat
radiated from a material at a
additional trees and rain gardens future climate of 2050. The outcomes given temperature compared
along restricted streets (see Scenario of this analysis show the maximum to a theoretical 'black body'
2). Increases in urban greenery can cooling potential for the South (Osmond & Sharifi, 2017). As
most urban surfaces already
also be achieved in private areas Melbourne Study Area and can be have high emittance and
through three green infrastructure used to inform the City of Port Phillip’s albedo is easier to modify,
the focus will be on changing
scenarios defined by the development planning of South Melbourne towards the albedo of urban surfaces
of the City of Melbourne’s Green 2050.
Factor Tool (Ashley, 2020). The
24 Cooling South Melbourne 25Existing buildings Private Green Space
City Rd
Existing trees Private Hard Surfaces
Yo
rk
St
t
ars S
Ferr
ay
sW
Alb
ert
ng
St
Ki
Part 3 - Impact Analysis of
Existing Roads Public Green Space Cooling Interventions
Existing Footpaths
Left: 3D model of the
existing conditions
(base case) of the South
Melbourne Study Area
26 Cooling South Melbourne 27Cooling Potential for Greater -37.6 Barren tundra
Mixed tundra
Melbourne in 2020 and 2050 Wooded tundra
Water
Barren or sparsely vegetated
Snow and ice
The cooling potential for Greater domains (Figure 5) were simulated
-37.8 Cropland/natural vegetation mosaic
Melbourne in 2020 and 2050 with a horizontal resolution
Figure 5: (a) The four two-way Urban and built-up
was modelled using the Weather increasing from 13.5 km in the nested WRF domains across
Croplands
Research and Forecasting (WRF) largest domain (d01) to 0.5 km in the Greater Melbourne (d01, d02,
Latitude
d03, d04); (b) Satellite image of Permanent wetlands
model. Four two-way nested innermost domain (d04) (Table 3).
the innermost domain (d04) Grasslands
Savannas
-38.0 Woody savannas
d01
Open shrublands
Closed shrublands
Mixed forest
Deciduos broadleaf forest
Deciduos neadleaf forest
-38.2 Evergreen broadleaf forest
Evergreen needleaf forest
144.6 144.8 145.0 145.2 145.4
Longitude
Cooling intervention scenarios were built-up areas could experience Figure 6: Land use
classification in Greater
defined and applied to the urban ambient temperature increases Melbourne (d04) (NASA, MODIS
and built-up areas across Greater of 2.1°C - 3.7°C in February 2050 database). The City of Port
Phillip municipal boundary
Melbourne (refer to 13 in Figure 6) in comparison to February 2020
shown in white.
to understand its cooling potential (Figure 7). However, through a
and to inform the South Melbourne combination of carefully considered
Study Area. Simulations of cooling cooling interventions, the simulation
intervention scenarios were results show that maximum
(a) (b) conducted for the whole of February ambient temperature reductions of
in 2020 and 2050. Simulation 4.7°C and 6.3°C can be achieved
results show that without any direct in 2020 and 2050 respectively for
Table 3: The four simulation domains in the WRF model action or cooling interventions, a representative summer’s day
Greater Melbourne’s urban and (February 10) (Figure 8).
Domain Resolution (km) n. cells (longitude x latitude)
d01 13.5 100 x 100
d02 4.5 100 x 100
d03 1.5 130 x 130
d04 0.5 187 x 181
Figure 7: Projected hourly
ambient temperature
increase for February 2050
in comparison to February
2020 (temperature difference
is averaged across the whole
month of February)
28 Cooling South Melbourne 29High Albedo for Urban Surfaces
Simulation results show that high 5.0°C and 5.4°C can be achieved
albedo materials for urban surfaces for 2020 and 2050 respectively,
2020
(e.g. roofs, walls, streets) are which can lead to maximum
highly effective in reducing both ambient temperature reductions
average and maximum surface and of up to 1.9°C for both 2020 and
ambient temperatures between 2050 (Figure 9). While its cooling
(a) (b)
9:00 and 19:00 for February 2020 effectiveness reduces overnight,
and 2050 (Figures 9 and 10). These increasing the albedo of urban
high albedo materials are most surfaces is crucial to improving
effective during the middle of the outdoor thermal comfort of
the day between 13:00 and 15:00 Greater Melbourne in the future,
when urban surfaces receive the with average ambient temperature
most direct solar radiation. During reductions of up to 1.3°C possible
2050
these hours, maximum surface throughout February in 2050 (Figure
temperature reductions of up to 10).
(c) (d)
Urban Greenery
Figure 8: Projected ambient temperature scenarios for Greater Melbourne on February 10, 2020 and 2050 at 14:00 at 2m height. (a) Ambient
temperature in 2020 (base case); (b) Ambient temperature reduction in 2020 through a combination of defined cooling interventions in
comparison to the base case; (c) Ambient temperature in 2050 (base case); (d) Ambient temperature reduction in 2050 through a combination Urban greenery also plays a crucial increase of urban greenery in the
of defined cooling interventions in comparison to the base case. The City of Port Phillip municipal boundary shown in white.
role in improving the outdoor urban and built-up areas of Greater
thermal comfort of our cities. Melbourne can provide maximum
The defined individual and » High albedo materials: this Figures 9 and 10 show that an ambient temperature reductions
combination of cooling scenario includes an increased increase of 20% in urban greenery of up to 1.5°C and 1.8°C in 2020
interventions are described below, albedo value of 0.6 for urban is highly effective for urban areas and 2050 respectively (Figure 9),
followed by the comparative impact surfaces (e.g. roofs, walls, at reducing maximum and average as well as provide average ambient
analysis of cooling interventions for streets). ambient temperatures during the temperature reductions of up to
Greater Melbourne: early hours of the morning (1:00 1.0°C throughout February in 2050
» Urban greenery: this scenario
» Base case: the base case includes an increase of 20% in - 7:00). During these hours, an (Figure 10).
scenario was defined with greenery for the urban areas.
an albedo value of 0.2 for
urban surfaces (e.g. roofs, » Irrigation: this scenario
walls, streets) The base case includes the irrigation of Water Irrigation
scenario does not include vegetation. Evapotranspiration
irrigation but waste heat from of vegetation is doubled in the
urban areas for this scenario. Although increasing the results show that well irrigated
cars and people (anthropogenic evapotranspiration of urban vegetation across the urban and
heat) was included for both » Combination of interventions: greenery is the least effective built-up areas of Greater Melbourne
2020 and 2050. this scenario is a combination individual cooling intervention can lead to surface and ambient
of high albedo materials, strategy, it plays an important role in temperature reductions of up to
irrigation and increasing urban reducing both ambient and surface 1.4°C and 0.5°C respectively for
greenery. temperatures throughout the day 2020, and up to 1.3°C and 0.5°C
(Figures 9 and 10). The simulation respectively for 2050 (Figure 9).
30 Cooling South Melbourne 31Combination of Cooling Interventions
The combination of cooling and average surface temperature temperatures. This sustained having different weather conditions,
interventions leads to significant reductions of almost 7.0°C cooling potential can lead to similar trends can be observed
reductions in both maximum and throughout February in 2020 and maximum ambient temperature with the effectiveness of increased
average surface and ambient 2050 (Figure 10). reductions of approximately 1.5°C urban greenery at night and high
temperatures for 2020 and 2050. - 3.0°C (Figure 9) and average albedo urban surfaces during the
Figures 9 and 10 show that When observing maximum and ambient temperature reductions of day leading to sustained periods
considerable maximum and average average ambient temperature approximately 1.0°C - 2.0°C (Figure of average ambient temperature
surface temperature reductions are reductions, Figures 9 and 10 10) throughout February in 2020 reductions.
possible between 9:00 and 19:00, show that the combination of and 2050.
primarily due to the effectiveness cooling interventions can provide
of increasing the albedo of urban increased cooling benefits for a Figures 11 and 12 show the average
surfaces. During the middle of the greater amount of time. This is ambient temperature reductions of
day (13:00 - 15:00), the combination due to the effectiveness of high the individual and combination of
of cooling interventions can lead albedo urban surfaces during the cooling interventions over a 5-day 2
This was the warmest five-day
to maximum surface temperature day and increased urban greenery period (10 - 15 February)2 for 2020 period for Melbourne's Olympic
Park weather station (BOM,
at night in reducing ambient and 2050 respectively. Despite
reductions of up to 8.2°C (Figure 9) 2020b)
2020 2050 2020 2050
(a) (b) (a) (b)
(c) (d) (c) (d)
Figure 9: Comparison of the cooling intervention scenarios against the base case showing maximum reductions in surface temperatures for (a) Figure 10: Comparison of the cooling intervention scenarios against the base case showing average reductions in surface temperatures for (a)
2020; and (b) 2050; and ambient temperatures for (c) 2020; and (d) 2050; averaged across February for Greater Melbourne 2020; and (b) 2050; and ambient temperatures for (c) 2020; and (d) 2050; averaged across February for Greater Melbourne
32 Cooling South Melbourne 33Informing the South Melbourne Study Area
The comparative impact analysis The results from this impact
results for Greater Melbourne analysis of Greater Melbourne can
show that significant reductions in inform the selection of appropriate
surface and ambient temperatures cooling interventions at a local
can be achieved now in 2020 and scale for the South Melbourne
in the future towards 2050. The Study Area. These results can also
simulation results have shown that help to frame the cooling of South
a carefully considered combination Melbourne towards 2050 within the
of cooling interventions can achieve larger objective of cooling Greater
the greatest cooling potential for Melbourne. The next section will
the urban and built-up areas of present the impact analysis of
Greater Melbourne. Individually, a series of cooling interventions
an increase of albedo for urban tailored to the specific context of
Figure 11: Comparison of average ambient temperature reductions for the individual and combination of cooling interventions across Greater surfaces was the most effective the South Melbourne Study Area.
Melbourne between 10 - 15 February 2020 strategy in reducing daytime It will demonstrate how urban
ambient and surface temperatures, overheating mitigation strategies
while an increase of urban greenery combined with urban planning and
was the most effective at reducing design parameters can impact the Below: View of the South
ambient temperatures across local thermal environment, thereby Melbourne Study Area in the
context of Greater Melbourne
Greater Melbourne. improving outdoor and indoor Photo: nilsversemann / Adobe
thermal comfort. Stock
Figure 12: Comparison of average ambient temperature reductions for the individual and combination of cooling interventions across Greater
Melbourne between 10 - 15 February 2050
34 Cooling South Melbourne 35Cooling Potential for the South Melbourne
Study Area in 2020 and 2050
The impact analysis of cooling associated Urban Design Framework Table 4: The nine cooling intervention scenarios for the South Melbourne Study Area
interventions for the South Melbourne informed the development of nine
Scenario Scenario Description
Study Area was conducted for the cooling intervention scenarios
current climate of 2020 and the (Table 4) which include proposed New Buildings with Business as Usual Private Green Coverage: New buildings (commercial, residential
and mixed-use) in the key redevelopment precincts (2, 3, 7, 8, 9 and 10 – see Figure 3) and individual
future climate of 2050 using the new buildings, increasing public and 1
redevelopment sites; and a business as usual (BAU) green infrastructure scenario4 for private green coverage
computational fluid dynamics (CFD) private urban greenery, water misting for these new buildings.
based microclimate model, ENVI- sprays, and changes to street, New Buildings with Moderate Private Green Coverage and Additional Public Realm Green Coverage: New
met. The simulation date and time footpath and roof materials. 2 buildings (same as scenario 1); a moderate green infrastructure scenario4 for private green coverage for these
were set for February 14, 2020 and new buildings; and additional street trees and rain gardens.
These nine scenarios were developed New Buildings with Optimised Private Green Coverage and Additional Public Realm Green Coverage: New
2050 between 08:00 and 15:00 with a
and analysed to highlight the 3 buildings (same as scenario 1); an optimised green infrastructure scenario4 for private green coverage for
wind speed of 2.5m/s from the north. these new buildings; and additional street trees and rain gardens.
maximum possible cooling impact
February 14 2020 was used as it was
for the South Melbourne Study Area. New Buildings and Cool Materials for all Streets, Footpaths and Private Hard Surfaces: Scenario 1 with cool
a hot summer’s day in Melbourne 4
materials for all public and private hard surfaces (e.g. footpaths, carparks, streets, courtyards, etc.).
3D model data for the study area,
with the maximum recorded New Buildings and Cool Roofs for all New and Existing Buildings: Scenario 1 with cool roofs for all new
typologies of new buildings and 5
temperature reaching 33.7°C3. buildings and existing buildings for the whole study area.
Appropriate cooling interventions private green coverage scenarios
6 Cool Roofs for all Existing Buildings: Cool roofs are applied to all existing buildings in the study area.
options were defined and modelled to were provided by the City of Port
7 Combination of all Interventions: Combination of scenarios 2, 4 and 5.
investigate their potential to mitigate Phillip which enabled the nine cooling
intervention scenarios to be modelled Combination of all Interventions Including Water Misting: Combination of scenarios 2, 4 and 5 with additional
the impacts of urban overheating 8
water misting cooling systems for public open spaces.
within the South Melbourne Study in ENVI-met and the Microclimate
New Buildings with Increased Building Height: Scenario 2 with increased building height that exceed the
Area. The results of these cooling and Urban Heat Island Mitigation 9
maximum permissible heights outlined in the City of Port Phillip’s planning controls.
interventions are discussed in this Decision-Support (UHI-DS) Tool (see
section and are reported from 08:00 Part 5). The parameter settings used
- 15:00 for the comparison charts to model the cooling intervention
and at 14:00 (typical peak daily scenarios in ENVI-met are outlined in
Table 5: Input parameters for modelling the cooling intervention scenarios in ENVI-met 4
BAU, Moderate and Optimised
temperature) for the surface and Table 5. green infrastructure scenarios
Albedo Input Values are from the development of
air temperature maps. The results The results of the impact analysis of the City of Melbourne's Green
Roads (old asphalt pavements) 0.08
from the impact analysis of cooling the cooling intervention scenarios are Factor Tool (Ashley, 2020)
Footpaths, private ground cover, etc. (i.e.
interventions for Greater Melbourne described in detail in the following concrete pavements)
0.2
in the previous section were used to sections. It is important to note Roofs (flat roofs, concrete) 0.2
set the boundary climate conditions that this report focuses primarily on Roofs (pitched roofs, terracotta tiles) 0.25
for the South Melbourne Study Area. improving outdoor thermal comfort Soil 0.15
Façade (concrete) 0.2
As mentioned in part 1 of this for the South Melbourne Study
Façade (glass curtain walls, assumed 1/3
report, the South Melbourne Study Area. Therefore, the analysis results new buildings)
0.6
Area is divided into 14 distinct (heatmaps and charts) show only the Façade (double glazing panel, assumed 2/3
0.32
precincts, with the business and cooling potential for outdoor surface new buildings)
mixed-use precincts to the north and air temperatures at street level Cool materials for all streets, footpaths and
0.6
private hard surfaces
and east having the most significant (60%
South Melbourne Central Structure conditions for each day (e.g. northerly 3
Refer to BOM data for
Melbourne (Olympic Park)
and Implementation Plan and its wind in 2020 and westerly wind in
(BOM, 2020b)
2050).
36 Cooling South Melbourne 37Scenario 1 - New Buildings with Business
2020 2050
as Usual Private Green Coverage
Existing trees
New buildings aligned
FE 5
RR with SMC Structure Plan
T RD AR
ALBER S BAU private green
Surface Temperature [°C]
Surface Temperature [°C]
ST
coverage
KI
NG
RD
S
TY
W
CI
AY
(a) (b)
Air Temperature [°C]
Air Temperature [°C]
Description Wedge allowing increased heights Figure 13: Overview of cooling
intervention scenario 1
of up to 40m and 90m respectively.
Scenario 1 involves the impact This enables any new development
analysis of a set of proposed to respect the scale of existing
new buildings with a business as heritage buildings and emphasise
usual (BAU) green infrastructure the ‘bowl of South Melbourne
scenario for private green coverage Central’ (see Part 1).
(Figure 13). These new buildings 5
New buildings are based
are located in the key business and The new development for on the indicative built form (c) (d)
mixed-use redevelopment precincts Scenario 1 involves a BAU green envelopes outlined by the SMC
infrastructure scenario (Ashley, Structure Plan (heights and
to the north and east of the South
setbacks)
Melbourne Study Area as well as 2020), which equates to 10-20% Temperature Distribution of the temperature distribution trends are Figure 15: Surface temperature
distributions for (a) 2020 and
key individual redevelopment sites. of the site area as urban greenery Change in Built Form shown under the projected future (b) 2050; and air temperature
The built form (height, setbacks, (including vertical) for all the new climate conditions of 2050 (Figure distributions for (c) 2020 and
The change in built form for 15). (d) 2050; from the change in
footprint, materials, etc.) represents buildings (Figure 14). built form with new buildings
Scenario 1 creates some cooler
the maximum permissible The cooling intervention scenarios
and BAU private green coverage
areas that are shaded by the new (Scenario 1)
development outlined in the South in this section are discussed in
medium/high-rise buildings (e.g.
Melbourne Central (SMC) Structure terms of their cooling potential
York St). Figure 15 shows that
and Implementation Plan and the in comparison with Scenario
surface temperatures are hotter
SMC Urban Design Framework. 1 unless stated otherwise. For
for hard surfaces (roads and
This typically involved maintaining footpaths), especially for wider example, the cooling potential
a 2-3 storey (8-12m) street wall roads with less tree canopy (e.g. of these new buildings with both
with stepped setbacks allowing Cecil St). This results in higher air moderate and optimised green
buildings to reach 5-6 storeys (20- temperatures near the wider streets infrastructure scenarios for private
Figure 14: Example
24m), with buildings to the east in building with BAU private and in unshaded public open space green coverage will be analysed in
the Kings Way Mixed-Use Corridor green coverage within (e.g. Dorcas St Reserve and Eastern comparison to BAU in Scenarios 2
the Kings Way Mixed and 3 respectively.
and to the north in the City Road Use Precinct
Reserve) (Figure 15). Similar
38 Cooling South Melbourne 39Scenario 2 - New Buildings with Moderate Private Green
Coverage and Additional Public Realm Green Coverage
Existing trees 2020 2050
New buildings aligned
FE
RR with SMC Structure Plan
T RD AR
ALBER S
ST Moderate private green
coverage
Additional rain gardens
Air Temperature Reduction [°C]
Air Temperature Reduction [°C]
and street trees
KI
NG
RD
S
TY
W
CI
AY
(a) (b)
Figure 18: Air temperature reductions6 of moderate private green coverage for all new buildings (Scenario 2) compared to BAU private green
coverage (Scenario 1) for (a) 2020 and (b) 2050
Description would require changes to future Figure 16: Overview of cooling of street level air temperatures The maximum air temperature 6
Some maximum air and
intervention scenario 2 surface temperature results
road and pedestrian configurations. under current and future climate reduction resulting from the
Scenario 2 involves the same set for the cooling intervention
An overview of Scenario 2 is shown conditions (Figure 18). Reductions increase of private green coverage scenarios were omitted to
of new buildings from Scenario in Figure 16. are more widespread in these and additional street trees and rain increase the reliability of results
1 but with a moderate green redevelopment areas due to the gardens in these key redevelopment
infrastructure scenario for private increase of private green coverage areas reaches 0.78°C and 0.82°C in
green coverage to investigate its Cooling Potential for the new buildings and the 2020 and 2050 respectively (Figure
cooling potential. A moderate green density of additional street trees 19).
infrastructure scenario equates to An increase of private green
and rain gardens.
40-50% of the site area as urban coverage from BAU to moderate
greenery (including vertical) (Ashley, in the northern and eastern
2020) for all the new buildings redevelopment precincts, along
(Figure 17). with additional street trees and Figure 17: Example building
2020 2050
with moderate private green
rain gardens results in a reduction coverage within the Eastern
This scenario also includes Business Precinct
additional public realm green
coverage through additional street
trees and rain gardens. Although the
existing street tree canopy coverage
of the South Melbourne Study Area
is above the municipal average
(see Part 1), additional greening is
proposed to mitigate localised hot
spots and to highlight the maximum
possible cooling potential. This (a) (b)
involved increasing greenery along
streets with current restrictions Figure 19: Maximum air temperature reductions of moderate private green coverage for all new buildings (Scenario 2) compared to BAU private
(e.g. tram lines, car parking), which green coverage (Scenario 1) for (a) 2020 and (b) 2050
40 Cooling South Melbourne 41You can also read