Ascend Wellness Holdings - Investor Roadshow Presentation April 2022
←
→
Page content transcription
If your browser does not render page correctly, please read the page content below
Ascend Wellness Holdings
Investor Roadshow Presentation
April 2022

                                 1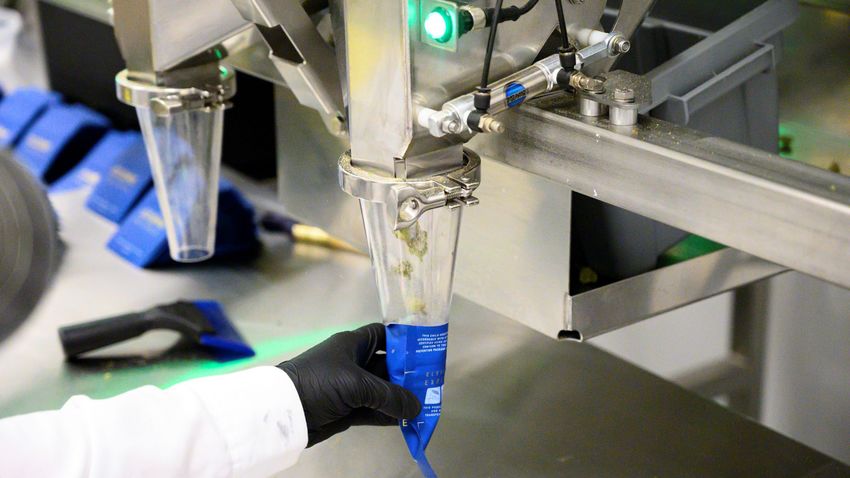
CAUTI O NA RY STATEM E N T REGAR D I N G F ORWARD LOOKI N G STATE M E N T S

This presentation includes forward-looking information and statements, which may include, but are not limited to, the plans, intentions, expectations,
estimates, and beliefs of the Company. Words such as “expects”, “continue”, “will”, “anticipates” and “intends” or similar expressions are intended to
identify forward-looking statements. Without limiting the generality of the preceding statement, all statements in this presentation relating to estimated
and projected revenue, expectations regarding production capacity, anticipated capital expenditures, proceeds from sale leasebacks, expansion, profit,
product demand, margins, costs, cash flows, sources of capital, growth rates and future financial and operating results are forward-looking statements.
We caution investors that any such forward-looking statements are based on the Company’s current projections and expectations about future events
and financial trends, the receipt of all required regulatory approvals, and on certain assumptions and analysis made by the Company in light of the
experience of the Company and perception of historical trends, current conditions and expected future developments and other factors management
believes are appropriate. Forward-looking information and statements involve and are subject to assumptions and known and unknown risks,
uncertainties, and other factors which may cause actual events, results, performance, or achievements of the Company to be materially different from
future events, results, performance, and achievements expressed or implied by forward-looking information and statements herein. Such factors include,
among other, the risks and uncertainties identified in the Company’s Annual Report on Form 10-K for the year ended December 31, 2021, and in the
Company’s other reports and filings with the applicable Canadian securities regulators on its profile on SEDAR at www.sedar.com and the U.S. Securities
and Exchange Commission at www.sec.gov. Although the Company believes that any forward-looking information and statements herein are reasonable,
in light of the use of assumptions and the significant risks and uncertainties inherent in such information and statements, there can be no assurance that
any such forward-looking information and statements will prove to be accurate, and accordingly readers are advised to rely on their own evaluation of
such risks and uncertainties and should not place undue reliance upon such forward-looking information and statements. Any forward-looking
information and statements herein are made as of the date hereof, and except as required by applicable laws, the Company assumes no obligation and
disclaims any intention to update or revise any forward-looking information and statements herein or to update the reasons that actual events or results
could or do differ from those projected in any forward looking information and statements herein, whether as a result of new information, future events
or results, or otherwise, except as required by applicable laws. The Canadian Securities Exchange has not reviewed, approved or disapproved the content
of this presentation.

                                                                                                                                                        2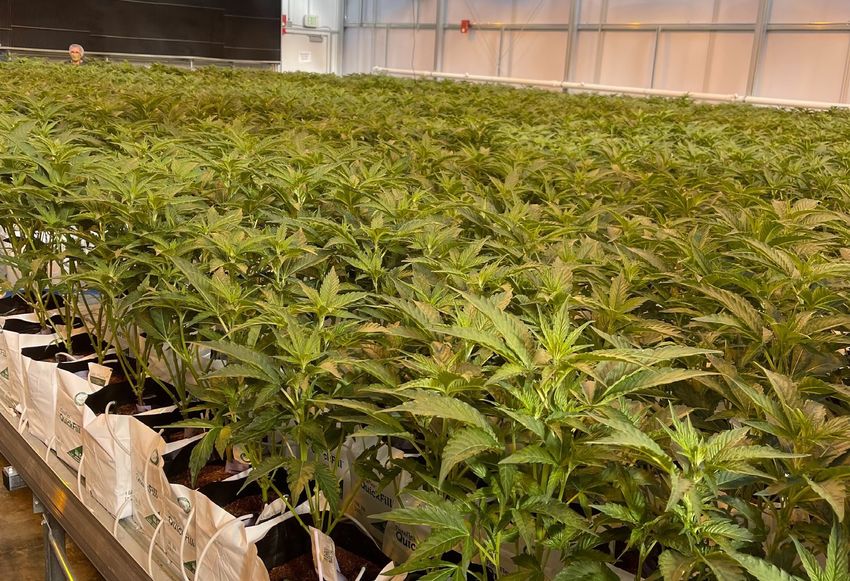
CANNABIS MARKET BY THE NUMBERS
Unprecedented growth across the emerging industry with room for continued expansion

                              SALES                                                             STATES          SUPPORT

                     $25Bn                                                                      18             68%
                   US LEGAL SALES 1                                             STATES PLUS DC                US CITIZENS
                       IN 2021                                              RECREATIONAL PROGRAMS        SUPPORT LEGALIZATION 3

                    $48Bn                                                                       38               4
                    US LEGAL SALES                                                  STATES HAVE              BILLS IN-PLAY
                        BY 2025 2                                                 MEDICAL PROGRAMS

                    $62Bn                                                                       70%          >50%
               GLOBAL LEGAL SALES                                             OF US STATES LEGAL               CONGRESS
                    BY 2026 2                                               MEDICAL OR RECREATIONAL      SUPPORTS LEGALIZATION 3
1.   “How Cannabis pricing differs from other consumer goods”. Deloitte with HIFYRE and BDSA.
2.   “US Cannabis Collective: Ahead of the Curve”. Vivien Azer @ Cowen Research.                                                   3
3.   “Welcome to Cannabis High…” Wolfe Research.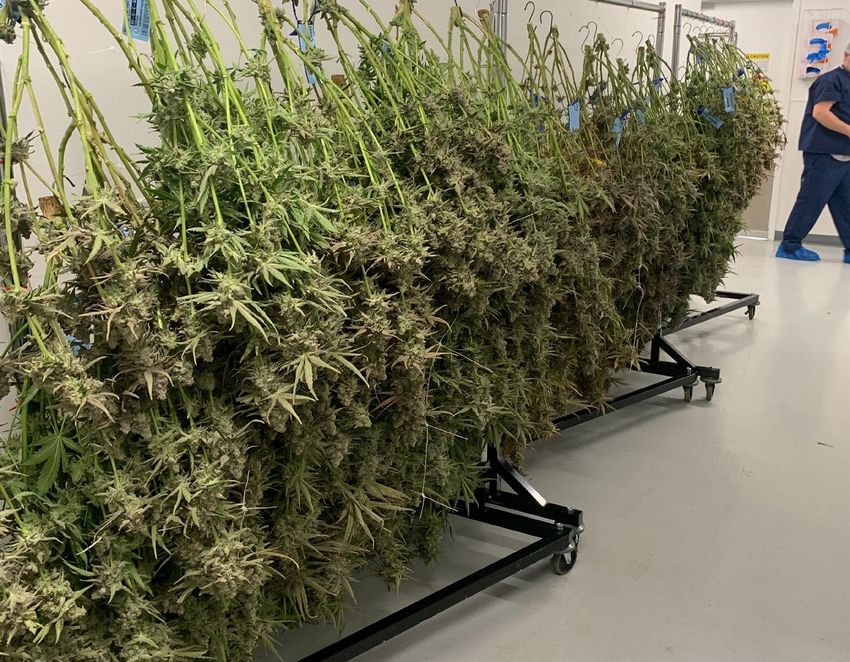
OVERVIEW
Vertically integrated operator with assets in Illinois, Michigan, Ohio, Massachusetts, New Jersey, and Pennsylvania.
Owns and operates state-of-the-art cultivation facilities; grows award-winning strains and produces a curated selection of products.

 Tickers                                CSE: AAWH.U; OTCQX: AAWH                                       EV1                                   $855M

 Founded                                2018                                                           Market Cap1                           $750M
                                                                                                       Revenue /
                                                                                                                                             2020             $144M / +1100%
 Headquarters                           New York                                                       YoY Growth
                                                                                                                                             2021E            $332M / +131%

                                                                                                       Adj. EBITDA /
                                                                                                                                             2020             $31M / 21.5%
 Employees                              ~1,500                                                         Margin
                                                                                                                                             2021E            $79 / 23.9%

                                                                                                       EV /                                  1.8x
 States of Operation                    NJ, MI, OH, IL, MA, PA
                                                                                                       2022E Revenue(2)
                                                                                                       EV /                                  6.2
 Dispensaries                           20 open
                                                                                                       2022E Adj. EBITDA(2)
                                                                                                       Total Debt /
 Cultivation                            5 open                                                                                               $259M / $155M
                                                                                                       Cash

 1.   EV= 181M of fully diluted shares outstanding times $4.15 share price (CSE) on 3/9/22 equals $75M market cap. Market cap plus $103 of net debt equals $943M enterprise value
                                                                                                                                                                                    4
 2.   2022 estimates based on consensus and stock price as of 3/9/22.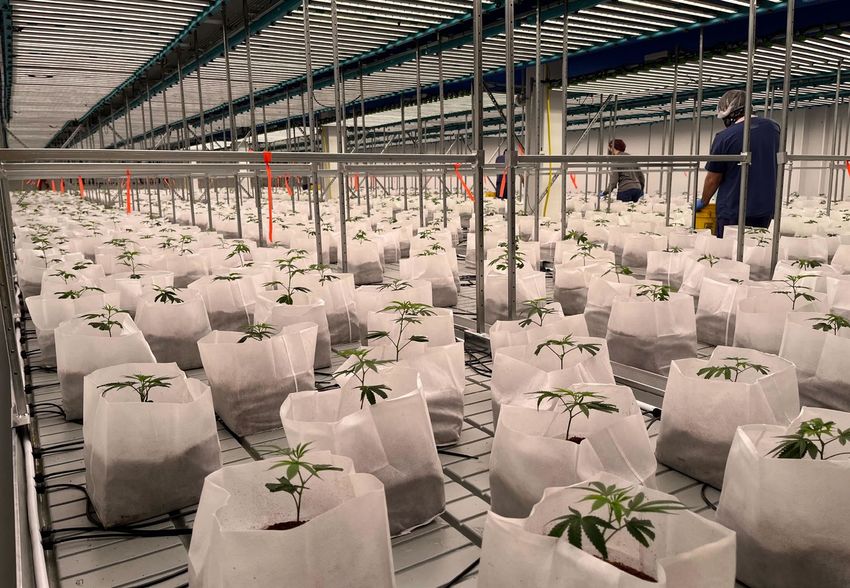
FY FINANCIAL HIGHLIGHTS                                                                             (US$ MILLIONS)

    FY’20 VS. FY’21
        Net Revenue Growth                                                               +131.3%
        US$ Millions

                                                                                                                                                        • Y/Y revenue growth driven by 6
                                                                                           $332.4
                                                                                                                                                          new store openings and 100,000 sq.
                                                                                                                                                          ft of canopy expansions
                              $143.7

                               FY '20                                                       FY '21                                                      • Y/Y 245 bps of margin expansion
                                                                                                                                                          driven by expanded utilization of
       Adj. EBITDA / Margin1                                                                                                                              wholesale footprint and leveraged
       US$ Millions
                                                                                               23.9%                                                      G&A
                                                              Profit:
                                                             +157.6%
                                   21.4%
                                                             Margin:                           $79.4
                                                             +245 bps
                                  $30.8

                                 FY '20                                                       FY '21
1. Adjusted Gross Profit / Margin and Adjusted EBITDA / Margin are non-GAAP financial measures. Please see the “GAAP Reconciliations” at the end of this presentation for a reconciliation of non-GAAP to GAAP measures.
                                                                                                                                                                                                                           5
ASCEND INVESTMENT THESIS

FOCUS: ACHIEVE SCALE IN SELECT LIMITED LICENSE MARKETS

KEY FLAGSHIP LOCATIONS WITH HIGH BARRIERS TO ENTRY

DISCIPLINED CAPITAL ALLOCATION; SUCCESSFUL EXECUTION OF M&A

MANAGEMENT WITH PROVEN TRACK RECORD OF EXECUTION IN IL

CONTINUED MARGIN IMPROVEMENT AS MORE ASSETS ARE “TURNED ON”

STRONG FINANCIALS AND REVENUE GROWTH

                                                              6   6
2022 OUTLOOK
Continue to scale our asset base of premier retail locations and state-of-the art cultivation facilities

 MEET IMPENDING RECREATIONAL DEMAND IN NJ, SOLIDIFY POSITION
 AS TOP PLAYER IN THE STATE

 DRAMATIC INCREASES IN PRODUCTION IN IL, MA, NJ, & PA

 CONTINUE EXPANSION INTO EXISTING MARKETS, PARTICULARLY
 ILLINOIS & MASSACHUSETTS

 IMPROVE BOTH RETAIL & WHOLESALE OPERATIONAL EXCELLENCE

 EXPAND & ELEVATE CURRENT BRAND PORTFOLIO

                                                                                                           7
ILLINOIS                                     MASSACHUSETTS

    FOOTPRINT                                                                                                                                                                                                    NEW JERSEY

                                                                                                                                                                                      MICHIGAN

    6 states
                                                                                                                                                                                                             PENNSYLVANIA

                                                                                                                                                                                                  OHIO

    20 dispensaries
   ILLINOIS                                       MICHIGAN                                       OHIO
   8 retail                                       6 retail                                       2 medical retail
   1 cultivation / processing                     2 planned retail                               1 cultivation / processing
                                                  1 cultivation / processing

   MASSACHUSETTS
   2 retail                                       NEW JERSEY                                     PENNSYLVANIA
   1 planned retail                               2 retail                                       6 medical retail licenses
   1 cultivation / processing                     1 planned retail                               1 cultivation / processing
                                                  1 cultivation / processing                     license

                                                                                                                                                                                                                                      Current Operations
                                                                                                                                                                                                                                      Pending Transaction1

                        MAY 2018                                                  2019 YE                                                       CURRENT                                                        2022 YE
                        Company                                                   4 Dispensaries                                                20 Dispensaries                                                24 Dispensaries2
                        founded
                                                                                 32,000 ft2                                                     213,000 ft2                                                    ~255,000 ft2
                                                                                 Canopy                                                         Canopy                                                         Canopy

1. NY close pending the resolution of ongoing litigation with the seller. The transaction would include 4 dispensaries and 1 cultivation facility, which are not included in these numbers. Definitive agreement signed in PA for 6
   dispensary licenses and 1 cultivation/processing license.
2. Does not include 4 dispensaries that are part of potential MedMen NY transaction or the 6 dispensary licenses recently acquired in PA as they will not be open before 2022 YE.                                                                            8
4 OF TOP REC MARKETS AND 2 OF TOP MEDICAL MARKETS
                                                                                                       Total Number                                                                                            2020E Legal plus
                                                                         Population                   of Dispensaries                     Population Per                                                         Illicit Sales
                                       State                         (2021 in Millions)(1)                    (2021)(2,3)                  Dispensary                          State Rank(4)                       ($U.S. Billions)(4)

                       RECREATIONAL
                                    Illinois                                 12.7                                111                           115,000                                   4                                $3.2

                                 Michigan                                    10.1                                448                            22,500                                   5                                $2.8

                               New Jersey                                     9.3                                 23                           620,000                                   7                                $2.2

                            Massachusetts                                     7.0                                130                            54,000                                   9                                $1.9

                       MEDICAL
                                      Ohio                                   11.8                                 53                           223,000                                   3                                $2.7

                              Pennsylvania                                   13.0                                136                           103,000                                   2                                $2.9

1.   2021 Census. U.S. Census Bureau’s Vintage 2021 national and state population estimates.
2.   Grown In Cannabis fact Sheet, January 2022; medical and recreational dispensaries
3.   Pennsylvania DOH, Medical Marijuana Dispensaries in Pennsylvania, as of February 2022
4.   “Initiate on US Cannabis: Generational Wealth Opportunity, Avg. Upside >100%”, Jefferies, July 7, 2021. Rank based on 2020E legal and illicit sales by the state in each respective categories (medical vs recreational).           9
REVENUE MIX GOAL

                                       50%
                                      In-house Ozone,
                              Ozone Reserve, and Partner Brands

      50%        50%
     WHOLESALE   R E TA I L            50%
                                     Third-party brands

                                                                  10
HIGHLY DESIRABLE FLAGSHIP LOCATIONS
ST. LOUIS AREA CHICAGO BOSTON NEW JERSEY NEW JERSEY
COLLINSVILLE RIVER NORTH BOSTON GARDEN / PARAMUS AREA FORT LEE
Strategically located Located just outside FANEUIL HALL On Rt. 17 and a Minutes to the
in the retail corridor Chicago Loop, the Downtown Boston mile from Garden George Washington
near St. Louis central shopping located between State Plaza in Bridge, NJ Turnpike,
and business district TD Garden and Northern NJ and NJ Rt. 46
Faneuil Hall
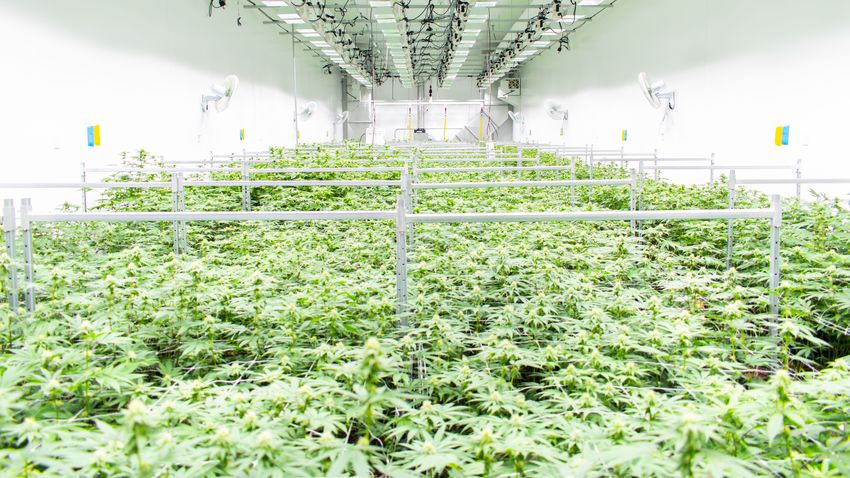
11CANOPY UPDATE
Canopy
Canopy at Current est. at
YE21 March YE22
State (ft2) 2022 (ft2)
IL 113,000 113,000 113,000
MI 28,000 28,000 28,000
MA 17,000 54,000 54,000
NJ 16,000 16,000 42,000 Barry, IL Franklin, NJ
OH 2,000 2,000 18,000
Total 176,000 213,000 255,000
Vegetation Room - Greenhouse Construction of Phase 2
• Completed construction on 100,000 sq.ft
in 2021
• Began planting of the IL greenhouse in
January
• Began planting incremental 37,000 sq. ft
of canopy in MA in March
Athol, MA Lansing, MI
Phase 2 Planting Drying Rack - Harvest 19 12PIPELINE OF ASSETS
Significant upside from assets “turning on” in 2022 and 2023
East Lansing, MI New Bedford, MA Fort Lee, NJ PA Dispensary 1 PA Dispensary 2 PA Dispensary 3
Dispensary Dispensary Dispensary
Montclair, NJ Century, MI Boston, MA PA Dispensary 4 PA Dispensary 5 PA Dispensary 6
Dispensary Expansion Dispensary Dispensary 2nd Floor
Franklin, NJ Athol, MA Franklin, NJ Pennsylvania Pennsylvania
Phase 2 Lab & Kitchen Lab & Kitchen Cultivation Lab & Kitchen
Cultivation
2022 2023 13LAUNCHING A NEW VALUE BRAND
Value brands comprise 25% of sales1 in Simply Herb markets
LAUNCHING NOW IL, MA, MI AVAILABLE IL, MA, MI, NJ AVAILABLE IL, MA, MI
FORM FACTORS Flower, pre-rolls FORM FACTORS Edibles, vapes, flower, glass FORM FACTORS Edibles, vape, flower, infused pre-
joints, pre-rolls rolls, concentrates
POTENCY Flower THC 18-22%
POTENCY Flower THC 22-25% QUALITY Flower THC 25%+; broad terpene profiles,
CONSUMER The price conscious consumer
CONSUMER Cannabis consumer looking for a higher quality buds, etc
PRICE $$$$$ quality, trusted, everyday brand CONSUMER Provides the most exceptional
PRICE $$$$$ cannabis experience to the ‘canna-connoisseur’
PRICE $$$$$
GOOD BETTER BEST
(1) BDSA bottom 25th percentile ARP in MA, IL, and MI Q3-Q4 2021
14 14FY BALANCE SHEET AND CASH FLOW
12/31/21
($ in millions)
($ in millions)
Cash &
E q u i v a l e n t s (1) $155.5
Fully Diluted
Shares
Outstanding 181.0
Basic &
D i l u t e d (2)
To t a l D e b t ,
n e t (3) $258.7 9/30/21 12/31/21
N e t D e b t (4) $103.3 • $4M cash inflow from operations (excluding changes in working
capital); $24M cash used for changes in working capital, driven by
(1) Does not include inflows from 24 Munsonhurst Rd Franklin, NJ sale-leaseback which was executed
subsequent to quarter-end.
income cash tax payments
(2) Includes 171.6M Class A Common Shares, 8.0M of unvested Restricted Stock Units, Restricted Stock
Awards, or options, and 1.4M in the money warrants. There are 3.5M warrants outstanding at an exercise
price of $4. Dilution was calculated using the treasury stock method and a 12/31/31 share price of $6.61 on
the CSE.
• $28M cash for investing including $9M for acquisitions, and $18M of
(3) Total Debt, net is equal to Total debt less unamortized deferred financing costs.
(4) Net debt is equal to Total Debt less Cash & Equivalents
net Capex, driven by IL greenhouse, MA and MI cultivation
(5) Cash used for working capital includes changes in operating assets and liabilities net of effects of
acquisitions. These include changes in accounts receivable, inventory, other assets, accounts payable,
expansions, and IL, MA, and NJ dispensary investments
accrued liabilities, other current liabilities, lease liabilities, and income taxes payable.
Note: waterfall may not foot due to rounding. 15VALUATION COMPARISON (1)
Company and Industry poised for re-rate
Adj. EBITDA Growth 22E/21 EV/ 2022E Adj. EBITDA
80% 75% 25.0x
73% 22.2x
70%
20.0x
60%
50%
15.0x
40%
30% 10.0x 8.8x
6.8x
20%
10% 5.0x
10%
0%
0.0x
FANG All MSOS AAWH FANG All MSOS AAWH
1. Multiples based on FactSet data exported on 3/2/2022
2. All MSOS includes Green Thumb, Curaleaf, Cresco, Trulieve, Ascend Wellness, Jushi, Terrascend, Verano, and Columbia Care.
16ACCELERATED EXPANSION THROUGH DISCIPLINED M&A
Two-pronged M&A approach
1. Maximize scale in existing footprint 2. Expand into other populous, limited license,
Prioritize continued expansion to optimize scale recreational or near-recreational markets
in existing footprint where permits allow Identify opportunities to grow and replicate
existing blueprint
• 2 dispensaries
OH • 5 dispensary cap
PA AZ CT
IL
• 54k canopy sq. ft.
cultivation
• 8 dispensaries MA • Expand cultivation MD
• 10 dispensary cap manufacturing and
VA
distribution
Recently acquired 6 dispensary and 1
cultivation license in PA
17COMMITTED TO PEOPLE AND THE PLANET
Environmental, Social, and Governance (ESG) initiatives; AWH has pledged to several United Nations Sustainable
Development Goals (several of which are highlighted below) and is disclosing data aligned with the Sustainable
Accounting Standards Board (SASB) in the Company’s 2021 annual report
Job Creation Benefits
AWH has created strong jobs in areas with high AWH provides employees with a 401k plan, FSA plan, Long-
unemployment e.g. AWH has created 400 jobs in Pike Term and Short-Term Incentive plan, and comprehensive
county, IL and is the county’s largest employer. core and voluntary benefits.
Strong Wages COVID
Depending on state, job position, and labor markets, all AWH provided numerous COVID related benefits to
field eployees are paid an average of $4.70 to $14.50 per employees including 36 hours of PTO and gift cards to
hour more than minimum wage. incentivize vaccination rates.
Employee Resource Groups (ERGs) Expungement Clinics
AWH has over 100 employees participating in 3 ERGs AWH has contributed funds to the Continuing Legal
(Women in Leadership, LGBTQIA+, and Black) to promote Education (CLE) institute, which seeks to educate attorneys
an inclusive culture and environment. interested in learning the ins and outs of the expungement
process.
Data Example
37% of leadership positions (supervisor and up) are held Incubation Nonprofit
by females; 26% of leadership positions held by ethnic In January 2022, AWH established the Ascend Foundation, a
minorities. Working to increase both stats to improve 501(c)(4) with a commitment to support individuals who
parity. qualify as social equity applicants.
18APPENDIX
19USE OF NON-GAAP FINANCIAL METRICS AND ADDITIONAL INFORMATION
This presentation includes certain non-GAAP financial measures as defined by the SEC. Reconciliations of these non-GAAP
financial measures to the most directly comparable financial measures calculated and presented in accordance with GAAP are
included in the appendix. This information should be considered as supplemental in nature and not as a substitute for, or
superior to, any measure of performance prepared in accordance with GAAP.
We define “Adjusted Gross Profit” as gross profit excluding non-cash inventory costs. We define “Adjusted Gross Margin” as
Adjusted Gross Profit as a percentage of net revenue. Our “Adjusted EBITDA” is a non-GAAP measure used by management
that is not defined by U.S. GAAP and may not be comparable to similar measures presented by other companies. We define
“Adjusted EBITDA Margin” as Adjusted EBITDA as a percentage of net revenue. Management calculates Adjusted EBITDA as
the reported net loss, adjusted to exclude: income tax expense; other (income) expense; interest expense; depreciation and
amortization; depreciation and amortization included in cost of goods sold; non-cash inventory adjustments; equity based
compensation; start-up costs; transaction-related and other legal expenses; litigation settlement; and loss on sale of assets.
Accordingly, management believes that Adjusted EBITDA provides meaningful and useful financial information, as this
measure demonstrates the operating performance of the business. Non-GAAP financial measures may be considered in
addition to the results prepared in accordance with U.S. GAAP, but they should not be considered a substitute for, or superior
to, U.S. GAAP results.
20GAAP RECONCILIATIONS $ in thousands
FY 2019 Q1 2020 Q2 2020 Q3 2020 Q4 2020 FY 2020 Q1 2021 Q2 2021 Q3 2021 Q4 2021 FY 2021
Adjusted Gross Profit
Gross Profit $ 3,287 $ 7,492 $ 12,178 $ 18,352 $ 22,892 $ 60,914 $ 29,667 $ 34,516 $ 40,954 $ 30,835 $ 135,972
Gross Margin 27.3% 33.2% 48.0% 44.3% 42.2% 42.4% 44.9% 41.4% 43.4% 34.8% 40.9%
Depreciation and amortization included in cost of 323 1,069 627 941 1,059 3,696 2,162 2,387 2,063 3,000 9,612
goods sold
Equity-based compensation included in cost of
goods sold - 349 2,580 2,929
Non-cash inventory adjustments (589) - - 146 - 146 750 2,714 335 1,115 4,914
Adjusted Gross Profit $ 3,021 $ 8,561 $ 12,805 $ 19,439 $ 23,951 $ 64,756 $ 32,579 $ 39,617 $ 43,701 $ 37,530 $ 153,427
Adjusted Gross Margin 25.1% 37.9% 50.4% 46.9% 44.1% 45.1% 49.3% 47.5% 46.3% 42.4% 46.2%
FY 2019 Q1 2020 Q2 2020 Q3 2020 Q4 2020 FY 2020 Q1 2021 Q2 2021 Q3 2021 Q4 2021 FY 2021
Adjusted EBITDA
Net Income / (Loss) $ (33,241) $ (7,118) $ (4,305) $ (4,915) $ (7,503) $ (23,841) $ (48,223) $ (44,897) $ (13,026) $ (16,511) $ (122,657)
Income tax expense 667 2,437 3,632 5,643 6,990 18,702 8,976 11,995 12,307 8,442 41,720
Other (income) expense (24) (6) 3 (3) (1) (7) (80) (82) (44) (50) (256)
Interest expense 6,477 2,530 2,873 2,627 4,963 12,993 7,337 36,888 12,376 7,388 63,989
Depreciation and amortization 2,989 1,951 1,969 2,299 1,695 7,914 2,419 2,470 2,520 2,628 10,037
Depreciation and amortization included in cost of 323 1,069 627 941 1,059 3,696 2,162 2,387 2,063 3,000 9,612
goods sold
Non-cash inventory adjustments (589) - - 146 - 146 750 2,714 335 1,115 4,914
Equity-based compensation 312 185 85 71 339 680 2,487 1,711 2,587 8,565 15,350
Equity-based compensation included in cost of - - - - - - - - 349 2,580 2,929
goods sold
Start-up costs(1) 10,096 1,419 1,845 2,729 2,104 8,097 1,311 1,716 1,227 1,211 5,465
Transaction-related and other non-recurring
expenses(2) - 103 164 737 1,160 2,164 2,178 5,406 2,191 1,434 11,209
Litigation settlement - - - - - 36,511 36,511
Loss on the sale of assets - 286 286 649 (44) 605
Adjusted EBITDA $ (12,990) $ 2,570 $ 7,179 $ 10,275 $ 10,806 $ 30,830 $ 15,828 $ 20,308 $ 23,534 $ 19,758 $ 79,428
Adjusted EBITDA Margin (108.0%) 11.4% 28.3% 24.8% 19.9% 21.4% 23.9% 24.4% 24.9% 22.3% 23.9%
1) One-time costs associated with acquiring real estate, obtaining licenses and permits, and other costs incurred before commencement of operations at certain locations.
2) Legal and professional fees associated with the Company’s go-public transaction and other non-recurring expenses. 21
Note: Adjusted Gross Profit, Adjusted Gross Margin, Adjusted EBITDA, and Adjusted EBITDA Margin are a non-GAAP financial measures.ASCEND WELLNESS HOLDINGS
https://awholdings.com/investors
Investor Contact: Rebecca Koar, VP Investor Relations
IR@awholdings.com
22You can also read