Assessment of the Pacific halibut (Hippoglossus stenolepis) stock at the end of 2022 - International Pacific Halibut Commission
←
→
Page content transcription
If your browser does not render page correctly, please read the page content below
IPHC-2023-SA-01
 Assessment of the Pacific halibut (Hippoglossus stenolepis) stock at the end of 2022

                               PREPARED BY: IPHC SECRETARIAT (I. STEWART & A. HICKS; 15 DECEMBER 2022)

PURPOSE
To provide the Commission with a detailed report of the 2022 stock assessment analysis.

EXECUTIVE SUMMARY
This stock assessment reports the status of the Pacific halibut (Hippoglossus stenolepis)
resource in the International Pacific Halibut Commission (IPHC) Convention Area at the end of
2022. A summary of the data and assessment results, as well as management related
information is provided both on the stock assessment webpage and in the meeting materials for
the IPHC’s 99th Annual Meeting (AM099; IPHC-2023-AM099-11). The input data files for each
model included in this stock assessment are available on the IPHC’s stock assessment
webpage.
A detailed overview of data sources is provided in a separate document (IPHC-2023-SA-02);
only a few key observations are described here. Fishing mortality from all sources in 2022 was
estimated to be up 4% from 2021. In addition to the estimated mortality, the assessment includes
data from both fishery dependent and fishery independent sources, as well as auxiliary biological
information. The 2022 modelled Fishery-Independent Setline Survey (FISS; see IPHC-2023-
AM099-08 and IPHC-2023-AM099-09) detailed a coastwide aggregate Numbers-Per-Unit-Effort
(NPUE) which decreased by 8% from 2021 to 2022. The modelled coastwide FISS Weight-Per-
Unit-Effort (WPUE) of legal (O32) Pacific halibut, the most comparable metric to observed
commercial fishery catch rates, decreased by 18% from 2021 to 2022. Preliminary coastwide
commercial fishery WPUE (based on all 2022 logbook records available for this assessment)
decreased 15% coastwide. Biological information (ages and lengths) from both the commercial
fishery and FISS shows a shift from the previously dominant 2005 year-class to the 2012 cohort
(10 years old in 2022), representing the largest abundance at any single age. At the coastwide
level, individual size-at-age continues the increasing trend for younger ages up to about 14,
depending on the IPHC Regulatory Area.
This stock assessment continues to be implemented using the generalized Stock Synthesis
software (Methot and Wetzel 2013). The analysis consists of an ensemble of four equally
weighted models: two long time-series models, reconstructing historical dynamics back to the
beginning of the modern fishery, and two short time-series models incorporating data only from
1992 to the present, a time-period for which estimates of all sources of mortality and survey
indices are available for all regions. For each time-series length, there are two models: one fitting
to coastwide aggregate data, and one fitting to data disaggregated into the four geographic
regions. This combination of models includes uncertainty in the form of alternative hypotheses
about several important axes of uncertainty, including: natural mortality rates (estimated in all
models except the short coastwide time-series model), environmental effects on recruitment
(estimated in the long time-series models), and other model parameters. Results are based on
the approximate probability distributions derived from the ensemble of models, thereby
incorporating the uncertainty within each model as well as the uncertainty among models.
The 2022 stock assessment represents a full analysis, following the previous full assessment
conducted in 2019, updated in 2020 and again in 2021. Changes from the 2021 assessment
were developed and reviewed by the IPHC’s Scientific Review Board (SRB), in June (SRB020;
                                            Page 1 of 37
IPHC-2023-SA-01
IPHC-2022-SRB020-07, IPHC-2022-SRB020-R) and September 2022 (SRB021; IPHC-2022-
SRB021-08, IPHC-2022-SRB021-R). Improvements to the modelling and data for 2002
included: updating the software version, including an informative prior on natural mortality (M)
and assigning larger values to the youngest ages (0-2) based on meta-analysis of other flatfish
species, improving the basis for data weighting via the use of bootstrapped effective sample
sizes, estimating M in the short time-series Areas-As-Fleets (AAF) model, and adding standard
data sources from all fisheries and surveys.
Overall, spawning biomass estimates remain highly consistent with those of recent stock
assessments. However, the higher estimated value of natural mortality in the AAF short model
when included with the other four models (two of which already estimated natural mortality)
strongly affected the ensemble stock assessment estimates of recent and historical fishing
intensity. The 2022 stock assessment estimates a lower level of fishing intensity and
higher relative stock status compared to previous assessments, as well as a 26%
increase in the yield corresponding to the reference level of fishing intensity (F43%) for
2023 compared to 2022.
The results of the 2022 stock assessment indicate that the Pacific halibut stock declined
continuously from the late 1990s to around 2012. That trend is estimated to have been largely a
result of decreasing size-at-age, as well as somewhat weaker recruitment strengths than those
observed during the 1980s. The spawning biomass (SB) is estimated to have increased
gradually to 2016, and then decreased to an estimated 192 million pounds (~87,100 t) at the
beginning of 2023, with an approximate 95% credible interval ranging from 122 to 272 million
pounds (~55,400-123,200 t). The recent spawning biomass estimates from the 2022 stock
assessment are very consistent with previous analyses for the period from 2012 to the present.
Pacific halibut recruitment estimates show the large cohorts in 1999 and 2005. Cohorts from
2006 through 2011 are estimated to be much smaller than those from 1999-2005, which has led
to recent estimated declines in both the stock and fishery yield as these low recruitments have
moved int the spawning biomass. Based on age data through 2022, individual models in this
assessment produced estimates of the 2012 year-classes that were slightly lower than the
magnitude of the 2005 year-class. The 2012 year-class is estimated to be 29% mature in 2022
and the maturation of this cohort has a strong effect on the short-term projections.
The IPHC’s interim management procedure uses a relative spawning biomass of 30% as a
fishery trigger, reducing the reference fishing intensity if relative spawning biomass decreases
further toward a limit reference point at 20%, where directed fishing is halted due to the critically
low biomass condition. The relative spawning biomass at the beginning of 2023 was estimated
to be 42% (credible interval: 21-55%), slightly higher than the estimate for 2022 (41%). Both of
these estimates are higher than those from the 2021 stock assessment (i.e., 2022 was estimated
at 33%), with the change caused by the higher estimate of natural mortality in the current
analysis. The probability that the stock is below SB30% is estimated to be 25% at the beginning
of 2023, with less than a 1% chance that the stock is below SB20%. The IPHC’s current interim
management procedure specifies a target level of fishing intensity of a Spawning Potential Ratio
(SPR) corresponding to an F43%; this equates to the level of fishing that would reduce the lifetime
spawning output per recruit to 43% of the unfished level given current biology, fishery
characteristics and demographics. Based on the 2022 assessment, the 2022 fishing intensity is
estimated to correspond to an F51% (credible interval: 32-64%). Stock projections were
conducted using the integrated results from the stock assessment ensemble, details of IPHC
Regulatory Area-specific catch sharing plans and estimates of mortality from the 2022 directed
fisheries and other sources of mortality. The projections for this assessment are more optimistic
than those from recent assessments due to the maturing 2012 year-class and the increase in
Page 2 of 37IPHC-2023-SA-01
the estimated overall productivity of the stock resulting from 3/4 rather than 2/4 models
estimating natural mortality at much higher values than the historical fixed assumption of 0.15.
This translates to a lower probability of stock decline for 2022 than in recent assessments as
well as a decrease in this probability through 2023-24. Further, the trend in spawning biomass
is estimated to have stabilized as the 2012 year-class continues to mature. This translates to a
lower probability of stock decline at higher yields for 2023 than in recent assessments as well
as a decrease in this probability through 2024-26. There is greater than a 50% probability of
stock decline in 2024 (53-86/100) for all yields greater than the status quo, including the entire
range of SPR values from 40-46%. The 2023 “3-year surplus” alternative, corresponds to a
TCEY of 43.0 million pounds 19,504 t), and a projected SPR of 48% (credible interval 28-62%).
At the reference level (a projected SPR of 43%), the probability of spawning biomass decline
from 2023 to 2024 is 75%, decreasing to 71% in three years. The one-year risk of the stock
dropping below SB30% is 25% across all alternatives. Retrospective analyses for each of the four
models, and a discussion of major sources of uncertainty are also included in this document.
INTRODUCTION
The stock assessment reports the status of the Pacific halibut (Hippoglossus stenolepis)
resource in the IPHC Convention Area. As in recent stock assessments, the resource is
modelled as a single stock extending from northern California to the Aleutian Islands and Bering
Sea, including all inside waters of the Strait of Georgia and the Salish Sea, but excludes known
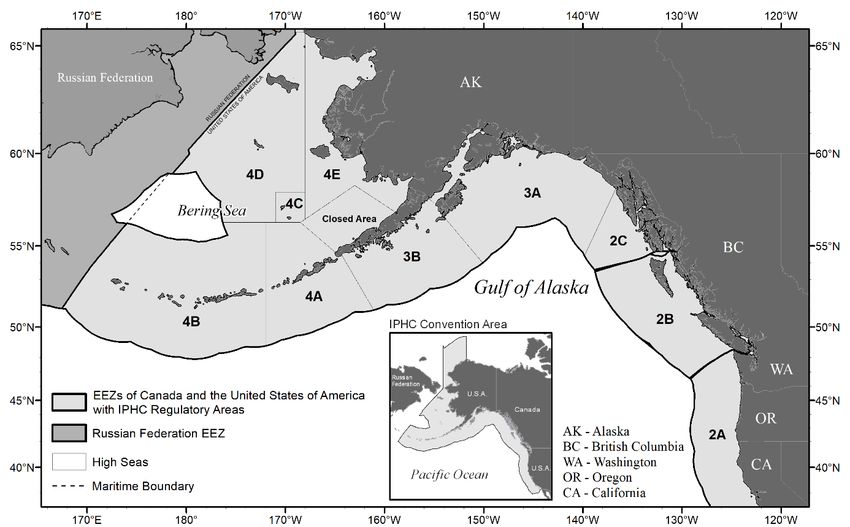
extremities in the western Bering Sea within the Russian Exclusive Economic Zone (Figure 1).
The Pacific halibut fishery has been managed by the IPHC since 1923. Mortality limits for each
of eight IPHC Regulatory Areas 1 are set each year by the Commission. The stock assessment
provides a brief summary of recently collected data; a more detailed treatment of data sources
included in the assessment and used for other analyses supporting harvest policy calculations
is provided in a separate document (IPHC-2023-SA-02) on the IPHC’s stock assessment
webpage. Results include current model estimates of stock size and trend reflecting all available
data. Specific management information is summarized via a decision table reporting the
estimated risks associated with alternative management actions. Mortality tables projecting
detailed summaries for fisheries in each IPHC Regulatory Area (and reference levels indicated
by the IPHC’s interim management procedure) will be reported at the 99th Session of the IPHC
Annual Meeting (AM099) in January 2023.
1The IPHC recognizes sub-Areas 4C, 4D, 4E and the Closed Area for use in domestic catch agreements but
manages the combined Area 4CDE.
Page 3 of 37IPHC-2023-SA-01
FIGURE 1. IPHC Convention Area (insert) and IPHC Regulatory Areas.
The IPHC’s stock assessment and review process has developed from the first ad hoc meeting
held in 2012 (Stewart et al. 2013b) to the formal SRB process including periodic external
independent peer review. The IPHC’s SRB meets two times per year: in June to review stock
assessment development, and in September to review progress in response to the June review
and to finalize the model structure and methods to be used in conducting the year’s stock
assessment. Within this annual review process two types of stock assessments are produced:
1) updated assessments where new data are added but the methods and model structures
remain largely unchanged, and 2) full stock assessments occurring every three years in which
model structure and methods are revised to reflect new data, approaches and comments from
SRB and independent review. The 2015 (Stewart and Martell 2016; Stewart et al. 2016), and the
2019 (Stewart and Hicks 2019; Stewart and Hicks 2020) stock assessments were full analyses.
The 2022 stock assessment represents a full analysis, following updates in 2020 and again in
2021. Changes from the 2021 assessment were developed and reviewed by the IPHC’s
Scientific Review Board (SRB), in June (SRB020; IPHC-2022-SRB020-07, IPHC-2022-SRB020-
R) and September 2022 (SRB021; IPHC-2022-SRB021-08, IPHC-2022-SRB021-R). Changes
to the modelling that were included in the stock assessment and new data for 2022 include:
1. Update the version of the stock synthesis software used for the analysis (3.30.19;
Methot and Wetzel 2013).
2. Expand the treatment of natural mortality (M) to include an informative prior based on
longevity and assign increased values at the youngest ages based on meta-analysis
of other flatfish species.
3. Improve the basis for data weighting via use of bootstrapped effective sample sizes
as model inputs based on the FISS and fishery sampling programs, rather than the
raw number of sets/trips used in previous assessments.
4. Estimate M in the short time-series Areas-As-Fleets (AAF) model.
Page 4 of 37IPHC-2023-SA-01
5. Include standard updates to mortality estimates from all fisheries, directed commercial
fishery and FISS (fishery-independent setline survey) biological and trend information,
and other sources including data collected in 2022.
DATA SOURCES
Each year, the data sources used to support this assessment are updated to include newly
available information and refined to reflect the most current and accurate information available
to the IPHC. Major reprocessing and development of supplementary data sources was
conducted in 2013, 2015, and again in 2019 (Stewart and Hicks 2019). For 2022, the largest
change to the underlying data was the development of a bootstrapping procedure to estimate
the effective sample size of the age-composition data, given the actual sampling design and
sample sizes in each year (Stewart and Hicks 2022). All available information for the 2022 stock
assessment was finalized on 1 November 2022 in order to provide adequate time for analysis
and modeling. As has been the case in all years, some data are incomplete, or include
projections for the remainder of the year. These include 2022 commercial fishery WPUE, 2022
commercial fishery age composition data, and 2022 mortality estimates for all fisheries still
operating after 1 November. All preliminary data series in this analysis will be fully updated as
part of the 2023 stock assessment.
Data for stock assessment use are initially compiled by IPHC Regulatory Area, and then
aggregated to four Biological Regions: Region 2 (Areas 2A, 2B, and 2C), Region 3 (Areas 3A,
3B), Region 4 (4A, 4CDE) and Region 4B and then coastwide. In addition to the aggregate
mortality (including all sizes of Pacific halibut), the assessment includes data from both fishery
dependent and fishery independent sources as well as auxiliary biological information, with the
most spatially complete data available since the late-1990s. Primary sources of information for
this assessment include modelled indices of abundance (IPHC-2023-AM099-09); based on the
FISS (in numbers and weight) and other surveys), commercial fishery Catch-Per-Unit-Effort
(weight), and biological summaries from both sources (length-, weight-, and age-composition
data). In aggregate, the historical time series of data available for this assessment represents a
considerable resource for analysis. The range of relative data quality and geographical scope
are also considerable, with the most complete information available only in recent decades
(Figure 2). A detailed summary of input data used in this stock assessment can be found in
IPHC-2023-SA-02 on the IPHC’s stock assessment webpage.
Page 5 of 37IPHC-2023-SA-01
FIGURE 2. Overview of data sources. Circle areas are proportional to magnitude
(mortality/catches) or the relative precision of the data (larger circles indicate greater precision
for indices of abundance and age composition data).
Briefly, known Pacific halibut mortality consists of directed/targeted commercial fishery landings
and discard mortality (including research), recreational fisheries, subsistence, and non-directed
discard mortality (‘bycatch’) in fisheries targeting other species and where Pacific halibut
retention is prohibited. Over the period 1888-2022 mortality has totaled 7.3 billion pounds (~3.3
million metric tons, t). Since 1923, the fishery has ranged annually from 34 to 100 million pounds
(16,000-45,000 t) with an annual average of 63 million pounds (~29,000 t). Annual mortality was
above this long-term average from 1985 through 2010 and has averaged 38.1 million pounds
(~17,300 t) from 2018-22. Coastwide commercial Pacific halibut fishery landings (including
research landings) in 2022 were approximately 26.2 million pounds (~11,900 t), up 6% from
2021. Discard mortality in the directed commercial fishery increased 58% in 2022 to 1.5 million
pounds (~680 t). Discard mortality in non-directed fisheries was estimated to be 4.5 million
Page 6 of 37IPHC-2023-SA-01 pounds in 2022 (~2,000 t)2, up 17% from 2021 and similar to estimates for 2020. The total recreational mortality (including estimates of discard mortality) was estimated to be 6.6 million pounds (~3,000 t) down 14% from 2021. Mortality from all sources increased by 4% to an estimated 39.7 million pounds (~18,000 t) in 2022. The 2022 modelled FISS results detailed a coastwide aggregate NPUE (numbers per unit effort) which decreased by 8% from 2021 to 2022, reversing the increase observed in 2021 and approaching the lowest values observed in the estimated time-series. Biological Region 3 decreased by 12%, while Biological Region 2 increased by 1%. Biological Regions 4 and 4B showed declines (2 and 6%) and are at the lowest values in the estimated time-series. The 2022 modelled coastwide WPUE of legal (O32) Pacific halibut, the most comparable metric to observed commercial fishery catch rates, decreased by 11% from 2021 to 2022. This larger decline relative to that for NPUE indicates that recruitment of younger fish is contributing more to current stock productivity than somatic growth of fish already over the legal minimum size limit. Individual IPHC Regulatory Areas varied from a 10% increase (Regulatory Area 2A) to a 37% decrease (Regulatory Area 3A) in O32 WPUE. Preliminary commercial fishery WPUE estimates from 2022 logbooks decreased by 15% at the coastwide level. The bias correction to account for additional logbooks compiled after the fishing season resulted in an estimated decline of 18% coastwide. Trends varied among IPHC Regulatory Areas and gears; Area- specific trends were mixed, and generally similar to those from the FISS. Biological information (ages and lengths) from the commercial fishery landings shows a switch from the 2005 year-class to the 2012 year-class as the largest coastwide contributor (in number) to the fish encountered. The FISS observed the 2012 cohort (10 years old) at the largest proportion in the total catch of any age class for the second year in a row. These observations of the 2012 cohort continue to show their increasing importance to the stock and to future fisheries. Individual size-at-age appears to be increasing for younger ages (
IPHC-2023-SA-01

(Stewart and Martell 2014a). Although recent modelling efforts have created some new
alternatives, no single model satisfactorily approximates all aspects of the available data and
scientific understanding. For 2022, an ensemble of four stock assessment models was again
used to explore the range of plausible current stock estimates. The ensemble approach
recognizes that there is no “true” assessment model, and that a robust risk assessment can be
best achieved via the inclusion of multiple models in the estimation of management quantities
and the uncertainty about these quantities (Stewart and Martell 2015a; Stewart and Hicks 2018).
This stock assessment is based on the approximate probability distributions derived from an
ensemble of models, thereby incorporating the uncertainty within each model as well as the
uncertainty among models. This approach reduces potential for abrupt changes in management
quantities as improvements and additional data are added to individual models and provides a
more realistic perception of uncertainty than any single model; therefore providing a stronger
basis for risk assessment.
This stock assessment continues to be implemented using stock synthesis, the generalized
stock assessment software (Methot and Wetzel 2013). The analysis consists of an ensemble of
four equally weighted models: two long time-series models, reconstructing historical dynamics
back to the beginning of the modern fishery, and two short time-series models incorporating data
only from 1992 to the present, a time-period for which estimates of all sources of mortality and
survey indices are available for all regions. For each time-series length, there are two models:
one fitting to coastwide aggregate data, and one fitting to data disaggregated into the four
geographic regions (Areas-As-Fleets; AAF). AAF models are commonly applied when biological
differences among areas or sampling programs make coastwide summary of data sources
problematic (Waterhouse et al. 2014). AAF models treat the population dynamics as a single
aggregate stock, but fit to each of the spatial datasets individually, allowing for differences in
selectivity and catchability of the fishery and survey among regions. In addition, the AAF models
more easily accommodate temporal and spatial trends in where and how data have been
collected, and fishery catches have occurred. This is achieved through explicitly accounting for
missing information in some years, rather than making assumptions to expand incomplete
observations to the coastwide level.
This combination of models included a broad suite of structural and parameter uncertainty,
including natural mortality rates (estimated in three of the four models and fixed in one model),
environmental effects on recruitment (estimated in the long time-series models), fishery and
survey selectivity (by region in the AAF models), and other model parameters. These sources
of uncertainty have historically been very important to the understanding of the stock, as well as
the annual assessment results (Clark and Hare 2006; Clark et al. 1999; Stewart and Hicks 2020;
Stewart and Martell 2016). The benefits of the long time-series models include historical
perspective on recent trends and biomass levels; however, these benefits come at a
computational and complexity cost. The short time-series models make fewer assumptions
about the properties of less comprehensive historical data, but they suffer from much less
information in the short data series as well as little context for current dynamics.
Each of the four models in the ensemble was equally weighted, and within-model uncertainty
from each model was propagated through to the ensemble results via the maximum likelihood
estimates and an asymptotic approximation to their variance. Point estimates in this stock
assessment correspond to median values from the ensemble: with the simple probabilistic
interpretation that there is an equal probability above or below the reported value.

                                          Page 8 of 37
IPHC-2023-SA-01
The 2019 stock assessment was a full analysis, including a complete re-evaluation of all data
sources and modelling choices, particularly those needed to accommodate the newly available
sex-ratio at age data from the commercial fishery. The 2020 and 2021 stock assessments
represented updates, adding data sources where available, but retaining the same basic model
structure for each of the four component models. The 2022 assessment was another full
assessment; all changes from the 2021 assessment were developed and reviewed by the
IPHC’s Scientific Review Board (SRB), in June (SRB020; IPHC-2022-SRB020-07, IPHC-2022-
SRB020-R) and September 2022 (SRB021; IPHC-2022-SRB021-08, IPHC-2022-SRB021-R).
The most important change in the 2022 assessment was the estimation of natural mortality (M)
in the short AAF model. Natural mortality has been a primary source of uncertainty in the Pacific
halibut stock assessment (and in most fisheries analyses) for decades. Prior to 1998, the Pacific
halibut stock assessment used a value of 0.20. This was changed to a value of 0.15 in 1998,
based on concerns that the consequences of an inaccurate estimate were less serious if the
value was underestimated (Clark 1999; Clark and Parma 1999). The value of 0.15 was used for
female Pacific halibut for all analyses until 2012. In the 2012 assessment, alternate values of
natural mortality were used to include a broader range of uncertainty in the harvest decision
table (Stewart et al. 2013a). In the 2013 assessment, a model (similar to the current coastwide
long time-series model) was included that estimated a higher level of natural mortality directly
from the data (Stewart and Martell 2014b). For the 2014 stock assessment, four models were
used, two of which estimated natural mortality (both at higher values) and two relied on the fixed
value of 0.15 (Stewart and Martell 2015b). This approach of four models, two estimating natural
mortality and two using the fixed value of 0.15 continued through the 2021 assessment. With the
additional years of data available and the directed commercial fishery sex-ratio time series
reaching 4 years in length, for the 2022 stock assessment there was sufficient information to
estimate natural mortality directly in the AAF short model, leading to estimation in 3 of the 4
models contributing to the ensemble.
All four models included an age-independent prior on M for Pacific halibut that was developed
based on the meta-analysis of Hamel (2014; and subsequently updated, Hamel pers. comm.),
using the prediction interval based on the maximum observed age for a wide range of species.
This prior is applied based on a maximum observed age for Pacific halibut of 55 years. In
addition, elevated M of young fish (ages 0–2) based on meta-analysis of the rates used in
assessments for other flatfish species and the corresponding asymptotic size as well as the
results of multi-species models estimating size-specific predation mortality (IPHC-2021-
SRB020-08).
The biggest change to the treatment of raw data used in the stock assessment models was to
determine maximum input sample sizes for age composition data based on a bootstrap
procedure of the actual observations from each source and year (Stewart and Hamel 2014). This
provides a better starting point for iterative reweighting of the data during modeling than does
the raw number of sets/trips used in previous assessments. This change was included in the
detailed bridging analysis provided during the June scientific review (IPHC-2021-SRB020-08).
COMPARISON WITH PREVIOUS ASSESSMENTS
As in recent analyses, the transition from the 2021 stock assessment to the final 2022 models
was performed in a stepwise manner, adding structural changes and then data incrementally to
identify which pieces of new information had the largest effect on the results. This ‘bridging’
analysis included the update to the stock synthesis software version used for 2022 (3.30.19),
the updating of 2021 data where needed and the addition of standard data sources for 2022
Page 9 of 37IPHC-2023-SA-01
including FISS and commercial fishery indices, biological sampling and mortality estimates from
all sectors. There was little effect on the historical time-series of spawning biomass or
recruitment for three of the four models included in the stock assessment (Figures 3-5) but the
estimation of M in the short AAF model resulted in an increase in the spawning biomass (Figure
6). The estimated strength of the 2012 year-class either decreased slightly or remained at a
similar value relative to other year classes with the addition of new data. However, the absolute
size of all year class estimates increased due to the higher natural mortality assumed for younger
ages.
FIGURE 3. Bridging analysis showing the change from the 2021 to final 2022 stock assessment
model estimates of spawning biomass (upper panel) and recruitment (lower panel) for the short
coastwide model.
Page 10 of 37IPHC-2023-SA-01
FIGURE 4. Bridging analysis showing the change from the 2021 to final 2022 stock assessment
model estimates of spawning biomass (upper panel) and recruitment (lower panel) for the long
coastwide model.
Page 11 of 37IPHC-2023-SA-01
FIGURE 5. Bridging analysis showing the change from the 2021 to final 2022 stock assessment
model estimates of spawning biomass (upper panel) and recruitment (lower panel) for the long
AAF model.
Page 12 of 37IPHC-2023-SA-01
FIGURE 6. Bridging analysis showing the change from the 2021 to final 2022 stock assessment
model estimates of spawning biomass (upper panel) and recruitment (lower panel) for the short
AAF model.
Estimates for female Pacific halibut natural mortality from the three models where this parameter
is estimated span values of 0.184 (AAF long), 0.213 (AAF short) and 0.215 (coastwide long); the
coastwide short model retains the fixed value of 0.15. Comparison of this year’s ensemble results
with previous stock assessments indicates that the estimates of spawning biomass from the
2022 ensemble remain very consistent with those from the 2012-21 assessments. Each of the
previous terminal assessment values lie inside the predicted 50% interval of the current
ensemble (Figure 7). The uncertainty is much greater prior to approximately 2005 reflecting the
Page 13 of 37IPHC-2023-SA-01
differences among the four individual models, particularly the beginning of the time-series’ in the
two short models. The increase in spawning biomass due the change to estimating natural
mortality in the short AAF model, relative to the 2021 assessment, is counterbalanced by the
slightly lower estimates of spawning biomass in the two long models. However, with equal
weighting of the four models the median productivity estimates (e.g., yield at a given level of
fishing intensity) are considerably higher than the 2021 and earlier assessment models (Figure
8) and reflected in the projections reported below.
FIGURE 7. Retrospective comparison of female spawning biomass among recent IPHC stock
assessments. Black lines indicate estimates from assessments conducted in 2012-2021 with the
terminal estimate shown as a red point. The shaded distribution denotes the 2022 ensemble:
the dark blue line indicates the median (or “50:50 line”) with an equal probability of the estimate
falling above or below that level; and colored bands moving away from the median indicate the
intervals containing 50/100, 75/100, and 95/100 estimates; dashed lines indicating the 99/100
interval.
Page 14 of 37IPHC-2023-SA-01
FIGURE 8. Retrospective comparison of fishing intensity (measured as Fxx%, where xx%
indicates the Spawning Potential Ratio (SPR) or the reduction in the lifetime reproductive output
due to fishing) among recent IPHC stock assessments. Thin black lines indicate estimates of
fishing intensity from assessments conducted in 2014-2021 with the projection for the mortality
limit adopted based on that assessment shown as a red point. The shaded distribution denotes
the 2022 ensemble: the dark blue line indicates the median (or “50:50 line”) with an equal
probability of the estimate falling above or below that level; and colored bands moving away
from the median indicate the intervals containing 50/100, 75/100, and 95/100 estimates; dashed
lines indicating the 99/100 interval. The grey line indicates the reference level of fishing intensity
used by the Commission in each year it has been specified (F46% during 2016-2020 and F43%
during 2021-2022).
BIOMASS, RECRUITMENT, AND REFERENCE POINT RESULTS
Ensemble
The results of the 2022 stock assessment indicate that the Pacific halibut stock declined
continuously from the late 1990s to around 2012 (Figure 7, Table 1). That trend is estimated to
have been largely a result of decreasing size-at-age, as well as somewhat weaker recruitment
strengths than those observed during the 1980s. The spawning biomass (SB) is estimated to
have increased gradually to 2016, and then decreased to an estimated 191 million pounds
(~86,600 t) at the beginning of 2022, followed by a slight increase to 192 million pounds (~87,100
t) at the beginning of 2023. The approximate 95% credible interval for 2023 ranges from 122 to
272 million pounds (~55,300-123,400 t; Figure 9). The differences among the individual models
contributing to the ensemble are most pronounced prior to the early 2000s (Figure 10); however,
current stock size estimates (at the beginning of 2023) also differ substantially among the four
models (Figure 11). The differences in both scale and recent trend reflect the structural
Page 15 of 37IPHC-2023-SA-01
assumptions, e.g., higher natural mortality estimated in three models and dome-shaped
selectivity for Biological Regions 2 and 3 in the AAF models.
TABLE 1. Estimated recent median spawning biomass (SB; millions lbs) and fishing intensity
(smaller values indicate higher fishing intensity) with approximate 95% credibility intervals, and
age-0 recruitment (millions) and age-8+ biomass (millions lbs) from the individual models
(CW=coastwide, AAF=Areas-As-Fleets) comprising the ensemble.
Fishing Fishing Recruitment Age-8+ biomass
SB intensity intensity CW CW AAF AAF CW CW AAF AAF
Year SB interval (FXX%) interval Long Short Long Short Long Short Long Short
1992 583 393-1,209 49% 29-68% 161.0 48.2 105.6 152.5 1,640 1,146 2,270 3,190
1993 569 385-1,122 49% 29-67% 108.1 22.8 62.3 75.1 1,537 1,088 2,097 2,924
1994 561 375-1,065 50% 30-67% 276.4 82.5 174.5 240.0 1,466 1,025 1,977 2,714
1995 635 416-1,139 58% 37-73% 258.0 72.5 158.7 210.7 2,044 1,355 2,451 3,340
1996 659 432-1,128 58% 36-71% 153.9 47.6 95.9 131.1 2,011 1,349 2,429 3,257
1997 717 471-1,166 52% 32-66% 137.7 36.8 86.7 115.5 2,072 1,409 2,491 3,291
1998 707 468-1092 51% 31-64% 221.4 69.0 147.8 198.0 1,976 1,364 2,355 3,075
1999 685 451-1022 49% 30-62% 288.8 92.2 189.7 267.4 1,822 1,271 2,165 2,795
2000 642 425-931 48% 29-61% 213.8 73.6 148.1 206.6 1,654 1,171 1,977 2,528
2001 587 386-832 46% 27-58% 155.4 45.2 115.5 162.0 1,459 1,036 1,754 2,210
2002 524 346-732 42% 25-54% 207.9 73.4 145.0 210.3 1,398 987 1,654 2,071
2003 461 304-634 38% 23-49% 163.2 52.5 100.5 141.2 1,334 928 1,549 1,923
2004 407 268-553 34% 21-46% 219.2 69.5 156.8 230.2 1,217 851 1,411 1,742
2005 356 235-477 32% 21-44% 298.3 105.6 212.1 307.6 1,095 760 1,272 1,562
2006 315 209-417 32% 21-43% 122.9 37.6 80.5 118.0 1,037 715 1,198 1,470
2007 283 190-372 30% 20-42% 105.0 23.3 73.6 101.5 1,033 707 1,177 1,455
2008 257 176-339 29% 20-41% 121.1 46.9 80.0 120.4 982 681 1,128 1,399
2009 230 159-304 30% 21-42% 50.3 1.4 31.3 39.9 888 615 1,039 1,291
2010 216 153-288 30% 20-42% 72.3 26.7 45.5 71.2 849 598 997 1,250
2011 208 151-280 35% 24-48% 129.6 26.2 81.3 124.4 802 571 938 1,177
2012 206 152-279 39% 27-52% 249.7 78.7 169.8 249.8 798 571 933 1,182
2013 211 160-286 41% 28-54% 103.5 2.1 80.5 109.7 849 620 984 1,256
2014 215 165-293 46% 31-59% 185.1 51.2 120.7 166.3 806 600 940 1,198
2015 221 171-301 46% 32-59% 143.9 28.4 92.3 99.9 761 569 899 1,137
2016 228 179-311 47% 32-60% 181.6 47.1 110.3 128.3 739 572 874 1,107
2017 227 178-309 47% 31-60% 178.6 39.6 108.2 126.6 675 519 812 1,019
2018 216 169-296 49% 33-62% NA NA NA NA 626 491 756 951
2019 208 160-286 48% 32-61% NA NA NA NA 628 468 742 943
2020 199 150-275 54% 38-66% NA NA NA NA 721 518 818 1,057
2021 192 139-267 51% 34-64% NA NA NA NA 705 460 809 1,038
2022 191 130-269 51% 32-64% NA NA NA NA 756 476 843 1,075
2023 192 122-272 NA NA NA NA NA NA 760 457 840 1,033
Differences are also apparent in the absolute scale of recent recruitment estimates; however,
relative recruitments from all four models show larger year-classes in 1999 and 2005 than in all
subsequent years, with 2012 being estimated slightly lower than the magnitude of the 2005 year-
class (Figure 12, Table 1). All of these recent recruitments are much lower than the 1987 cohort,
Page 16 of 37IPHC-2023-SA-01
and in the two long time-series models they are at or below those in the late 1970s and early
1980s (Figure 13). Cohorts from 2006 through 2011 are estimated to be much smaller than those
from 1999-2005 which has resulted in declines in both the stock and fishery yield as these low
recruitments became increasingly important to the age range over which much of the harvest
and spawning takes place. Based on the most recent trend and age data, this assessment
estimated the 2012 cohort to be critically important to the projected spawning biomass over the
next 2-4 years. Twenty-nine percent (29%) of this cohort is estimated to be mature in 2022 and
increasing to 69% by 2025, assuming the historical average maturity schedule currently used in
the assessment. Short-term trends in fishery yield may increase as the fisheries continue to
transition from older fish to the younger 2012 year-class, as was observed in the 2021 and 2022
fisheries. All models are estimating a slightly increasing, then stable 8+ biomass from a low in
2018 or 2019 but the ensemble shows a decline then stable spawning biomass through the
beginning of 2023 (Table 1). Recruitment estimates after 2014 remain highly uncertain, and
those after 2017 are poorly informed by any direct information from the fishery and survey data.
FIGURE 9. Cumulative distribution of the estimated spawning biomass at the beginning of 2023.
Curve represents the estimated probability that the biomass is less than or equal to the value on
the x-axis; vertical line represents the median (192 million pounds; ~87,100 t).
Page 17 of 37IPHC-2023-SA-01
FIGURE 10. Estimated spawning biomass trends (1992-2023) based on the four individual
models included in the 2022 stock assessment ensemble. Series indicate the maximum
likelihood estimates; shaded intervals indicate approximate 95% credible intervals.
FIGURE 11. Distribution of individual model estimates for the 2023 spawning biomass. Vertical
lines indicate the median values.
Page 18 of 37IPHC-2023-SA-01
FIGURE 12. Estimated trends in age-0 recruitment (upper panel) and relative recruitment
(standardized to the mean for each model over this time-period; lower panel) 1992-2017, based
on the four individual models included in the 2022 stock assessment ensemble. Series indicate
the maximum likelihood estimates; vertical lines indicate approximate 95% credible intervals.
Page 19 of 37IPHC-2023-SA-01
FIGURE 13. Trend in historical recruitment strengths (by birth year) estimated by the two long
time-series models, including the effects of the Pacific Decadal Oscillation (PDO) regimes.
Ecosystem conditions
Average Pacific halibut recruitment is estimated to be higher (47 and 44% for the coastwide and
AAF models respectively) during favorable Pacific Decadal Oscillation (PDO) regimes, a widely
used indicator of productivity in the north Pacific. Historically, these regimes included positive
conditions prior to 1947, poor conditions from 1947-77, positive conditions from 1978-2006, and
poor conditions from 2007-13. Annual averages from 2014 through 2019 were positive, with
2020 through 2022 showing negative average conditions (data were only available through
September for 2022). Although strongly correlated with historical recruitments, it is unclear
whether the effects of climate change and other recent anomalous conditions in both the Bering
Sea and Gulf of Alaska are comparable to those observed in previous decades.
Reference points
The IPHC’s interim management procedure uses a relative spawning biomass of 30% as a
trigger, below which the reference fishing intensity is reduced. At a spawning biomass limit of
20%, directed fishing is halted due to the critically low biomass condition. Beginning with the
2019 stock assessment, this calculation has been based on recent biological conditions rather
than a long-term static average. By using current weight-at-age and estimated recruitments that
are influencing the current stock only, the ‘dynamic’ calculation measures the effect of fishing on
the spawning biomass. The relative spawning biomass decreased continuously over the period
1992-2012 to near 30% (Figure 14). Since 2016, the relative spawning biomass has increased
slightly to 42% at the beginning of 2023 (credible interval: 21-55%). This result reflects the
greater effects of recruitment and size-at-age, rather than fishing in the last few years, and both
of these estimates are higher than those from the 2021 stock assessment (i.e., 2022 was
estimated at 33%), with the change caused by the higher estimate of natural mortality in the
current analysis. That the spawning biomass has been decreasing in recent years and the
relative spawning biomass has been increasing is not inconsistent: the biomass projected to
occur in the absence of fishing (the denominator of the relative biomass calculation) has also
been decreasing, and at a higher rate than the actual estimated spawning biomass (Figure 15).
Page 20 of 37IPHC-2023-SA-01 The probability that the stock is below the SB30% level is estimated to be 25% at the beginning of 2023, with less than a 1% chance that the stock is below SB20% (Figure 16). FIGURE 14. Estimated time-series of relative spawning biomass (compared to the unfished condition in each year) based on the median (dark blue line) and approximate 95% credibility interval (blue shaded area). IPHC management procedure reference points (SB30% and SB20%) are shown as dashed and solid lines respectively, with the region of biological concern (
IPHC-2023-SA-01

FIGURE 16. Cumulative distribution of ensemble 2023 spawning biomass estimates relative to
the SB30% reference point. Curve represents the estimated probability that the biomass is less
than or equal to the value on the x-axis. Vertical lines denote the values corresponding to the
fishing intensity threshold in the IPHC’s harvest policy (red; SB30%), and the median (blue;
SB42%).
The IPHC’s current interim management procedure specifies a reference level of fishing intensity
of F43%, based on the Spawning Potential Ratio (SPR). This reference equates to the level of
fishing that would reduce the lifetime spawning output per recruit to 43% of the unfished level
given current biology, fishery characteristics and demographics. For the most recent three years
fishing intensity is estimated to have been below reference levels and projections based on
adopted mortality limits at the time. Prior to 2020, estimates of terminal year fishing intensity in
each stock assessment were generally similar to those from the 2022 assessment (Figure 8).
Based on the 2022 assessment, the 2022 fishing intensity is estimated to correspond to an F51%
(credible interval: 32-64%), much less than projected in the 2021 assessment, slightly higher
than 2020 (when many fisheries did not achieve projected performance), and lower than other
years since the late 1990s (Table 1; Figures 17 and 18). Comparing the relative spawning
biomass and fishing intensity over the recent historical period provides for an evaluation of trends
conditioned on the currently defined reference points via a ‘phase’ plot. The phase plot for Pacific
halibut shows that the relative spawning biomass decreased as fishing intensity increased
through 2010, then increased as the fishing intensity decreased through 2016, and has been
relatively stable since then (Figure 18).

                                           Page 22 of 37
IPHC-2023-SA-01
FIGURE 17. Cumulative distribution of the estimated fishing intensity (based on the Spawning
Potential Ratio) estimated to have occurred in 2022. Curve represents the estimated probability
that the fishing intensity is less than or equal to the value on the x-axis. Vertical lines indicate
the reference (F43%; red) and the median value (F51%; blue).
Long time-series models
The two long time-series models provided different perceptions of current vs. historical stock
sizes, particularly for the lowest points in the series occurring in the 1930s and 1970s (Figure
19). The AAF model estimates that recent stock sizes are below those estimated for the 1970s,
and the coastwide model above. Relatively large differences among models reflect both the
uncertainty in historical dynamics as well as the importance of spatial patterns in the data and
population processes, for which all four of the models represent only simple approximations.
Recent differences are likely attributable to the separation of signals from each Biological Region
(particularly Region 2, with the longest time-series of data), and allowance for different properties
in each region’s fishery and survey in the AAF models. Historical differences appear to be due
to the differing assumptions regarding connectivity between Regions 2-3 and Regions 4-4B
during the early part of the 1900s when there are no data available from Regions 4-4B (Stewart
and Martell 2016).
Page 23 of 37IPHC-2023-SA-01
FIGURE 18. Phase plot showing the time-series of estimated spawning biomass (1993-2023)
and fishing intensity (1992-2022) relative to current reference points. Dashed lines indicate the
F43% (horizontal) reference fishing intensity and linear reduction below the SB30% (vertical)
trigger, the red area indicates levels below the SB20% limit. Each year is denoted by a solid point
(credible intervals by horizontal and vertical whiskers), with the relative fishing intensity in 2022
and spawning biomass at the beginning of 2023 shown as the largest point (purple). Percentages
along the y-axis indicate the probability of being above and below F43% in 2022; percentages on
the x-axis the probabilities of being below SB20%, between SB20% and SB30% and above SB30% at
the beginning of 2023.
FIGURE 19. Spawning biomass estimates from the two long time-series models. Shaded region
indicates the approximate 95% within-model credible interval. The black (upper) series is the
Areas-As-Fleets model and the blue (lower) series is the coastwide model.
Page 24 of 37IPHC-2023-SA-01
MAJOR SOURCES OF UNCERTAINTY
This stock assessment includes uncertainty associated with estimation of model parameters,
treatment of the data sources (e.g. short and long time-series), natural mortality (fixed vs.
estimated), approach to spatial structure in the data, and other differences among the models
included in the ensemble. Although this is an improvement over the use of a single assessment
model, there are important sources of uncertainty that are not included.
The 2022 assessment includes five years (2017-21) of sex-ratio information from the directed
commercial fishery landings. However, uncertainty in historical ratios, and the degree of
variability likely present in those and future fisheries remains unknown. Additional years of data
are likely to further inform selectivity parameters and cumulatively reduce uncertainty in stock
size moving into the future. The treatment of spatial dynamics (and implicitly movement rates)
among Biological Regions, which are represented via the coastwide and AAF approaches, has
large implications for the current stock trend, as evidenced by the different results among the
four models comprising the stock assessment ensemble. Further, movement rates for adult and
younger Pacific halibut (roughly ages 2-6, which were not well-represented in the PIT-tagging
study), particularly to and from Biological Region 4 (and especially to and from the Eastern
Bering Sea), are important and uncertain components in understanding and delineating between
the distribution of recruitment among biological Regions, and other factors influencing stock
distribution and productivity. This assessment also does not include mortality, trends or explicit
demographic linkages with Russian waters, although such linkages may be increasingly
important as warming waters in the Bering Sea allow for potentially important exchange across
the international border. Ongoing research to better understand the stock structure within the
Convention Area as well as connectivity to Western North Pacific waters is ongoing. These
investigations are particularly important for understanding the dynamics in IPHC Regulatory
Area 4B, which is potentially the most demographically isolated of the eight IPHC Regulatory
Areas.
Additional important contributors to assessment uncertainty (and potential bias) include factors
influencing recruitment, size-at-age, and some estimated components of fishery mortality. The
link between Pacific halibut recruitment strengths and environmental conditions remains poorly
understood, and although correlation with the Pacific Decadal Oscillation is currently useful, it
may not remain so in the future. Therefore, recruitment variability remains a substantial source
of uncertainty in current stock estimates due to the lack of mechanistic understanding and the
lag between birth year and direct observation in the fishery (8+ years) and survey data (6+
years). Reduced size-at-age relative to levels observed in the 1970s has been the most
important driver of recent decade’s stock productivity, but its cause also remains unknown. Like
most stock assessments, fishing mortality estimates are assumed to be accurate. Therefore,
uncertainty due to discard mortality estimation (observer sampling and representativeness),
discard mortality rates, and any other unreported sources of mortality in either directed or non-
directed fisheries (e.g. whale depredation) could create bias in this assessment.
Maturation schedules are currently under renewed investigation by the IPHC. Historical values
are based on visual field assessments, and the simple assumption that fecundity is proportional
to spawning biomass and that Pacific halibut do not experience appreciable skip-spawning
(physiologically mature fish which do not actually spawn due to environmental or other
conditions). To the degree that maturity, fecundity or skip spawning may be temporally variable,
the current approach could result in bias in the stock assessment trends and reference points.
Page 25 of 37IPHC-2023-SA-01
New information will be incorporated as it becomes available; however, it may take years to
better understand the spatial and temporal variability inherent in these biological processes.
Since 2012, natural mortality has been an important source of uncertainty that is included in the
stock assessment. In 2012, three fixed levels were used to bracket the plausible range of values.
In 2013, the three models contributing to the ensemble included both fixed and estimated values
of natural mortality. In the current ensemble, the models use both fixed (0.15/year for female
Pacific halibut) and estimated values. The female value estimated in the long AAF model (0.184)
is similar to the values estimated in the short AAF model (0.213) and the long coastwide model
(0.215). These estimates are highly correlated to the relative commercial fishery selectivity of
males and females, which is currently estimated based on five years of available data. Estimates
of these processes contribute to the difference in scale and productivity for the two models which
are not easily reconciled at present. Although this uncertainty is directly incorporated into the
ensemble results, uncertainty in female natural mortality in the coastwide short model is not and
remains an avenue for future investigation.
This stock assessment contains a broad representation of uncertainty in stock levels when
compared to analyses for many other species. This is due to the inclusion of both within-model
(parameter or estimation uncertainty) and among-model (structural) uncertainty. Due to the
many remaining uncertainties in Pacific halibut biology and population dynamics, a high degree
of uncertainty in both stock scale and trend will continue to be an integral part of an annual
management process, which can result in variable mortality limits from year to year. Potential
solutions to reduce the inter-annual variability in mortality limits include management procedures
that utilize multi-year management approaches, which are being tested with the MSE framework.
CONVERGENCE, SENSITIVITY AND RETROSPECTIVE ANALYSES
Basic convergence checks applied to all models included successful calculation of the Hessian
matrix, checks for reasonable uncertainty in and correlations among estimated model
parameters and tracking of results through sequential model or data changes to ensure plausible
results. Further, during model development the two AAF models showed more challenging
likelihood surfaces with occasional local minima. Therefore, final model runs were further
evaluated via running models from a wide range starting values (‘jittering’, using at least 100
different starting points), and ensuring that no model discovered a better likelihood than was
used to produce the final assessment results.
During the preliminary development of the 2022 stock assessment a wide range of bridging and
sensitivity analyses were conducted (IPHC-2022-SRB020-07). These efforts form the primary
basis for the identification of important sources of uncertainty outlined above. The most important
contributors to estimates of both population trend and scale have included: the sex ratio of the
directed commercial fishery landings, the treatment of historical selectivity in the long time-series
models, and natural mortality. Likelihood profiles were used to investigate the sources of
information on natural mortality and the general level of agreement among data sets. In addition,
the preliminary development of the 2022 assessment included extensive evaluation of the
treatment of the PDO as a covariate with average recruitment. Briefly, the way in which the PDO
was linked to recruitment did not have a large effect of estimates of stock trend, nor was a
method identified that better explained the historical variation (IPHC-2022-SRB020-07).
Research priorities closely linked with stock assessment uncertainties have been explored
through specific sensitivity analyses conducted in 2020 and 2021. In addition to those factors
described above, these analyses have included the effects of unobserved whale depredation,
and trends in spawning output (due to skip spawning or changes in maturity schedules) and the
Page 26 of 37IPHC-2023-SA-01
results have supported the prioritization of maturity, fecundity and skip spawning as current and
near-term research foci.
To illustrate the effects of recent data, separate from all other model changes and data updates,
retrospective analyses were performed for each of the individual models contributing to the
assessment. This exercise consists of sequentially removing the terminal year’s data and
rerunning the assessment model. This is commonly done for five or more years; however, the
current models, restructured for the 2019 stock assessment around estimation of commercial
fishery selectivity separately for males and females, rely on sex-ratios-at-age which are only
available from 2017-2021. Therefore, the retrospective for this year’s assessment does not go
beyond five ‘peels’, each cumulatively removing one year of data (2022, 2021-2022, 2020-2022,
2019-2022, and 2018-2022). Estimates for relative male and female selectivity parameters
become less certain with reduced data and required at least one year of data for reliable
estimation and preferably more. As data accumulate since this change in model structure the
retrospective analyses will be more informative of recent data effects rather than being affected
by lack of information to inform selectivity differences.
The retrospective analysis revealed that spawning biomass time series for each of the four stock
assessment models changed very little as the terminal year’s data were removed; with the
highest variance in the results observed for the AAF short and long models where the estimates
of spawning biomass increasing or decreasing with the removal of four and five years of data
(Figures 20-23; upper panels). As noted above, these models were very sensitive to the
estimated values for natural mortality, which were correlated with relative male and female
selectivity in the directed commercial fishery; removing four and five recent years of data left a
paucity of sex ratio information to estimate differences in male and female selectivity. This result
highlights the ongoing need for additional observations of the sex-ratio of commercial fishery
landings, although as more data are collected it may be possible to reduce the frequency at
which sex ratio data are included. The second clear result from the retrospective analysis was
the effect of 2018 to 2021 data on the magnitude of the estimated 2012 year-class. This cohort
is informed by each year of additional data and the estimated magnitude increased strongly
across the model runs (Figures 20-23; lower panels). The addition of the 2022 data resulted in
only a small decrease in the estimate of the 2012 year-class.
Page 27 of 37IPHC-2023-SA-01
FIGURE 20. Spawning biomass (top panel) and recruitment (bottom panel) estimates from a
retrospective analysis sequentially removing terminal years of data from the coastwide short
model. Shaded regions and vertical whiskers indicate approximate 95% within-model credible
intervals.
Page 28 of 37You can also read