Quality Control Impacts on Total Precipitation Gauge Records for Montane Valley and Ridge Sites in SW Alberta, Canada
←
→
Page content transcription
If your browser does not render page correctly, please read the page content below

data
Data Descriptor
Quality Control Impacts on Total Precipitation Gauge Records
for Montane Valley and Ridge Sites in SW Alberta, Canada
Celeste Barnes *            and Chris Hopkinson

                                          Department of Geography & Environment, University of Lethbridge, 4401 University Drive W,
                                          Lethbridge, AB T1H 3M4, Canada; c.hopkinson@uleth.ca
                                          * Correspondence: celeste.barnes@uleth.ca

                                          Abstract: AbstractThis paper presents adjustment routines for Geonor totalizing precipitation gauge
                                          data collected from the headwaters of the Oldman River, within the southwestern Alberta Canadian
                                          Rockies. The gauges are situated at mountain valley and alpine ridge locations with varying degrees
                                          of canopy cover. These data are prone to sensor noise and environment-induced measurement
                                          errors requiring an ordered set of quality control (QC) corrections using nearby weather station data.
                                          Sensor noise at valley sites with single-vibrating wire gauges accounted for the removal of 5% to 8%
                                          (49–76 mm) of annual precipitation. This was compensated for by an increase of 6% to 8% (50–76 mm)
                                          from under-catch. A three-wire ridge gauge did not experience significant sensor noise; however, the
                                          under-catch of snow resulted in 42% to 52% (784–1342 mm) increased precipitation. When all QC
                                          corrections were applied, the annual cumulative precipitation at the ridge demonstrated increases
                                          of 39% to 49% (731–1269 mm), while the valley gauge adjustments were −4% to 1% (−39 mm to
                                          13 mm). Public sector totalizing precipitation gauge records often undergo minimal QC. Care must
                                          be exercised to check the corrections applied to such records when used to estimate watershed water
                                          balance or precipitation orographic enhancement. Systematic errors at open high-elevation sites may
Citation: Barnes, C.; Hopkinson, C.
                                          exceed nearby valley or forest sites.
Quality Control Impacts on Total
Precipitation Gauge Records for
Montane Valley and Ridge Sites in
                                          Dataset: https://doi.org/10.20383/102.0551
SW Alberta, Canada. Data 2022, 7, 73.
https://doi.org/10.3390/                  Dataset License: These data are available under a CC BY 4.0 license https://creativecommons.org/
data7060073                               licenses/by/4.0/.

Academic Editors: Vladimir
                                          Keywords: precipitation; totalizing precipitation gauge; Geonor; time-series adjustment; quality
Sreckovic, Milan S. Dimitrijević and
                                          control; Canadian Rockies; Waterton; Castle
Zoran Mijic

Received: 6 April 2022
Accepted: 25 May 2022
Published: 30 May 2022                    1. Summary
Publisher’s Note: MDPI stays neutral           The Government of Alberta (GoA) introduced the “Water for Life” strategy [1], partly
with regard to jurisdictional claims in   to ensure there will be sufficient provincial water resources available for ecosystem and
published maps and institutional affil-   anthropogenic needs. Mountain headwaters provide a high proportion of the available
iations.                                  downstream runoff [2]; however, accurate measurement of mountain precipitation is a
                                          well-known challenge [3–6].
                                               GoA Alberta Environment and Parks (AEP) and Agriculture and Forestry manage
                                          totalizing precipitation gauges throughout Alberta. On the eastern slopes of the Alberta
Copyright: © 2022 by the authors.
                                          Rocky Mountains, most gauges are sparsely located at valley and mid-mountain sites [7,8].
Licensee MDPI, Basel, Switzerland.
                                          To further investigate mountain headwater precipitation regimes, the University of Leth-
This article is an open access article
                                          bridge Artemis Lab (ULAL) installed three totalizing precipitation gauges at different
distributed under the terms and
                                          elevations and in different landcover types, near to existing public gauges. One gauge was
conditions of the Creative Commons
                                          installed in an open alpine location, while the other two gauges were in valley sites, with
Attribution (CC BY) license (https://
                                          one in a woodland clearing [9] and the other in a recently burnt area [10] of standing dead
creativecommons.org/licenses/by/
4.0/).
                                          tree stems and sparce ground cover vegetation. It was noted in the WMO Fifth Session

Data 2022, 7, 73. https://doi.org/10.3390/data7060073                                                         https://www.mdpi.com/journal/data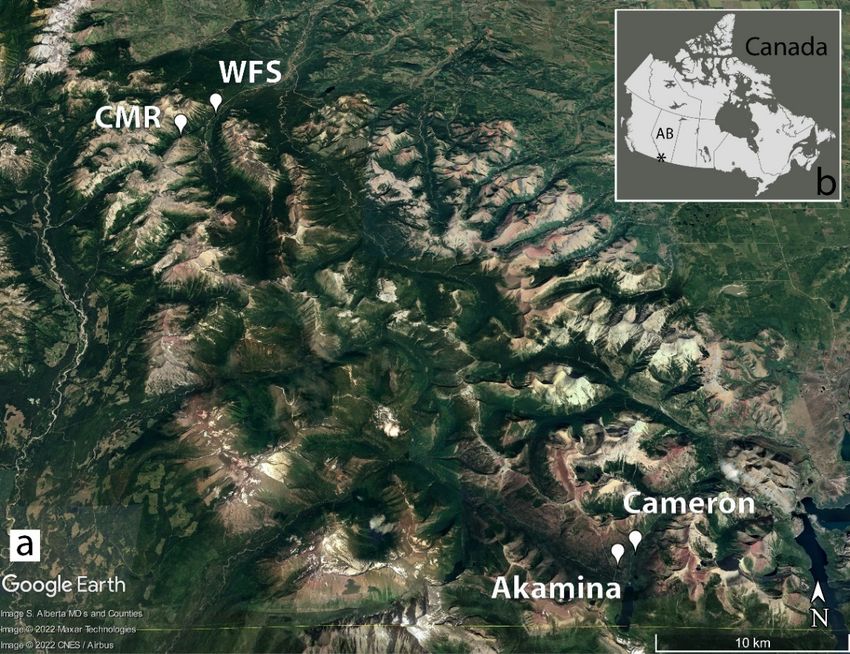
Data 2022, 7, 73                                                                                             2 of 13

                   Final Report, that the Solid Precipitation Intercomparison Experiment (SPICE) gauge
                   management practices should follow the manufacturer’s recommended installation and
                   operational maintenance methodologies [11]. However, data obtained from research sites
                   may not be reliable as a result of improper maintenance activities [12]. ULAL followed the
                   manufacturer’s recommended installation and maintenance routines for each totalizing
                   precipitation gauge.
                        The data collected from the totalizing precipitation gauges are prone to noise and
                   measurement errors [6,13,14], especially from the effects of wind-induced under-catch of
                   snow entering the orifice [13,15]. Site characteristics such as the amount of natural canopy
                   sheltering the gauge [12], as well as the installation of shielding to limit airflow around
                   the gauge [16,17], decrease these errors. Other environmental and sensor configuration
                   factors can result in evaporative losses, snow covering the orifice, or false measurements
                   of precipitation when no event is in progress [11,16,18]. Observation quality control (QC)
                   using data cleaning and filtering must be applied to time-series observations to remove
                   noise and systematic measurement errors. Different techniques have been used to clean and
                   smooth the precipitation datasets [12,14,19]. This paper explains the adjustments applied
                   to the ULAL totalizing precipitation gauges for noise, as well as over- and under-catch, to
                   show the relative proportions of error and potential range in accumulated precipitation in
                   the data records. Two different procedures were used to perform QC adjustments to the
                   precipitation observations collected in this region. The initial data filtering routine applied
                   to the data was developed by the Alberta Climate and Information Service (ACIS) and used
                   to ensure data consistency with publicly available precipitation datasets. Wind-induced
                   bias corrections are not applied by ACIS; therefore, the rest of the QC routines used in this
                   paper were developed by another research group [12]. Pan et al. [12] applied wind-induced
                   bias adjustments to the precipitation data collected with the same sensor and shielding
                   located in a similar Western Canadian region.

                   2. Data Description
                        The following three Geonor totalizing precipitation gauge sites were used: CMR
                   (Castle Mountain Resort), WFS (Westcastle Field Station), and Cameron [20]. Datasets for
                   each site containing variables required for the QC process (shown in Table 1) are available
                   from the Federated Research Data Repository (FRDR) at https://doi.org/10.20383/102.0551
                   (accessed on 4 May 2022).

                   Table 1. Raw and processed data descriptions and units.

                        Variable         Value        Units                        Description
                                                                        Time measurement was recorded
                       Timestamp        recorded
                                                                            (yyyy–mm–dd hh:mm)
                         RH             recorded        %                      Relative humidity
                        Wind            recorded      ms−1                        Wind speed
                       AirTemp          recorded       ◦C                       Air temperature
                        In_SR           recorded     watt/m2               Incoming solar radiation
                      Raw_Precip        recorded      mm                   Raw precipitation record
                      ACIS_Precip      computed       mm          ACIS weighing gauge time-series data filtering
                                                                   Noise removal of positive values during no
                      Noise_Precip     computed        mm
                                                                                 precipitation
                       OC_Precip       computed        mm                    Over-catch subtracted
                       UC_Precip       computed        mm            Under-catch added for snow and rain

                         The CMR Geonor was installed in September 2015; however, the record was not
                   continuous until 2017. The WFS Geonor was installed in the summer of 2017, and both the
                   WFS and CMR records used in this analysis were continuous for four hydrological years,
                   starting from October 2017 through to September 2021. The Cameron Geonor dataset was
                   continuous from the date of installation in October 2018 through to September 2021.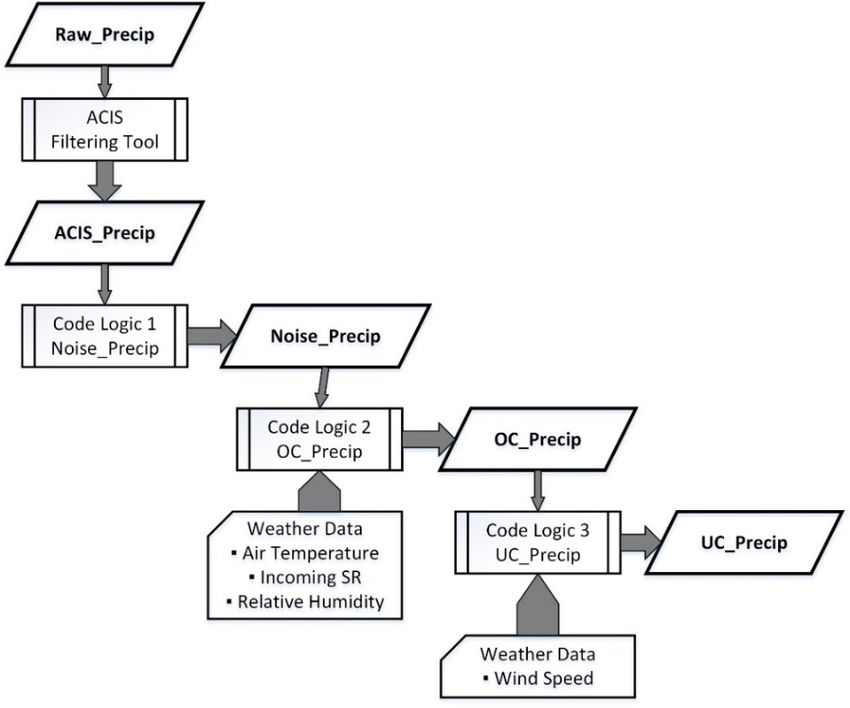
Data2022,
Data 2022,7,7,73x FOR PEER REVIEW 33 of
of13
14
Raw_Precip
The CMR, recorded mm
WFS, and Cameron Raw precipitation
precipitation records record
were set to zero at the beginning
ofACIS_Precip computed
each hydrologic mm to match
year (1 October) ACISthe
weighing
publiclygauge time-series
available data
historical filtering
meteorological
data accessible from the Alberta Climate Noise removal of positive values during Alberta
Information Service’s (ACIS) [7] and no
Noise_Precipand
Environment computed mm“Alberta’s River Forecast Centre: Awareness and Commu-
Park’s (AEP) precipitation
nication” system
OC_Precip [21] datasets.
computed mm The data collection interval for allsubtracted
Over-catch three Geonor gauges was
one measurement every 15 min. Fluid change jumps in the observed gauge level at biennial
UC_Precip computed mm Under-catch added for snow and rain
maintenance intervals were removed from each record.
3.3.Methods
Methods
3.1.Study
3.1. StudyArea
Area
Thestudy
The studyarea
areawaswaswithin
withinthetheeastern
easternslope
slopeheadwaters
headwatersof ofsouthwestern
southwestern Alberta,
Alberta,
Canada (Figure 1). ULAL installed three totalizing precipitation gauges—two
Canada (Figure 1). ULAL installed three totalizing precipitation gauges—two in the West in the West
CastleWatershed
Castle Watershed (WCW)
(WCW) andand
oneone in the
in the Waterton
Waterton LakesLakes National
National Park (WLNP).
Park (WLNP). The CMR The
CMR gauge
gauge is located
is located withinwithin the Castle
the Castle Mountain
Mountain Resort Resort [22] along
[22] along the Gravenstafel
the Gravenstafel ridgeridge
on
on western
the the western
sideside of the
of the WCW,
WCW, at 2130
at 2130 m above
m above seasea level
level (asl).
(asl). TheTheWFS
WFSgauge
gaugeisissituated
situated
atatthe
theUniversity
Universityof ofLethbridge
LethbridgeWestcastle
WestcastleField
FieldStation
Stationwithin
withinthe thevalley
valleybottom
bottomof ofthe
the
WCWatat1400
WCW 1400mmasl,
asl,33km
kmnortheast
northeastof ofCMR.
CMR.TheTheCameron
Camerongauge gaugeisissituated
situatedininthe
thebottom
bottom
ofCameron
of CameronValley
Valleyatat1655
1655mmasl,
asl,within
withinWaterton
WatertonLakesLakesNational
NationalPark,
Park,4545km
kmsoutheast
southeast
ofofWFS.
WFS.
Figure1.1. (a)
Figure (a) Proximal
Proximal locations
locationsofofthe
theCMR,
CMR,WFS,
WFS,and Cameron
and CameronGeonor gauge
Geonor sites.
gauge The The
sites. AEPAEP
Aka-
mina (mid-mountain site at an elevation of 1809 m asl) provides publicly available precipitation
Akamina (mid-mountain site at an elevation of 1809 m asl) provides publicly available precipitation
data. (b) Inset: study area in the Canadian Rockies of southwestern Alberta, Canada.
data. (b) Inset: study area in the Canadian Rockies of southwestern Alberta, Canada.
3.2.Sensor
3.2. SensorSpecifications
Specifications
GeonorT-200B
Geonor T-200B[14,23]
[14,23]precipitation
precipitation gauges
gauges with
with single
single alter
alter wind
wind screens
screens andand sev-
several
eral weather sensors recording incoming shortwave radiation, air temperature,
weather sensors recording incoming shortwave radiation, air temperature, relative humid- relative
humidity,
ity, and windand windwere
speed speed were installed
installed by the University
by the University of Lethbridge
of Lethbridge (Figure(Figure 2)CMR
2) at the at the
CMR(a),
ridge ridge
WFS(a),valley
WFS (b),
valley
and(b), and Cameron
Cameron valley
valley (c) (c) locations.
locations. Glycol (40%)/methanol
Glycol (40%)/methanol (60%)
(60%) antifreeze
antifreeze and a ≥and 500amL
≥ 500 mL mineral
mineral oil surface
oil surface sealant
sealant were weretoadded
added to the gauges
the Geonor Geonor
Data 2022, 7, 73                                                                                             4 of 13

                   using standard Campbell Scientific (CS) specifications [24]. Standard and consistent CS
                   CR1000 [25] datalogger programming was used at all three locations.

                   Figure 2. Site photographs showing the totalizing precipitation gauge terrain and vegetation con-
                   ditions, and adjacent weather stations: (a) CMR, (b) WFS, and (c) Cameron (the weather station is
                   behind the observer, so it is not shown).

                         The CMR precipitation gauge has the largest capacity 1500 mm Geonor bucket, with
                   three vibrating wires to accommodate less frequent site visits and occasional turbulent wind
                   conditions over the ridge. The site was selected for ease of access for maintenance activities,
                   as well as to connect to the tele-communication and power infrastructure provided by the
                   Castle Mountain Resort. The gauge is mounted on a tall pedestal to keep it above snow
                   drifts and low-level blowing snow, but because it is at the upper limit of the tree line, there
                   is minimal surrounding vegetation to shelter the gauge from strong turbulent winds. The
                   CMR weather station is in the field of view (FOV) of a web camera located lower down the
                   mountain side, and another web camera is located adjacent to the gauge site so that the
                   Geonor gauge and sky conditions can be monitored.
                         The CMR windspeed sensor malfunctioned from 1 November 2018 to 14 February
                   2019, resulting in a data gap. The missing CMR windspeed data (15 min averages) were
                   gap filled by regression to a nearby weather station on the resort ~200 m lower down the
                   mountain side (r2 = 0.81).
                         A smaller 600 mm capacity Geonor gauge was installed at the WFS weather station
                   (Table 2) [9], as access is easy from a nearby highway, and site visits are frequent given
                   this is a well-used university research station. This unit has a single vibrating wire, as it is
                   located in a clearing surrounded by mixed deciduous and conifer trees, so wind conditions
                   are more stable than the nearby CMR ridge. The gauge is in the FOV of a web camera
                   located on the cabin of the field station. A 600 mm capacity single-wire Geonor gauge
                   was installed at the Cameron valley research site (Table 2) within an area of mature pine
                   forest that was killed and defoliated in the Kenow wildfire of September 2017 [10]. Publicly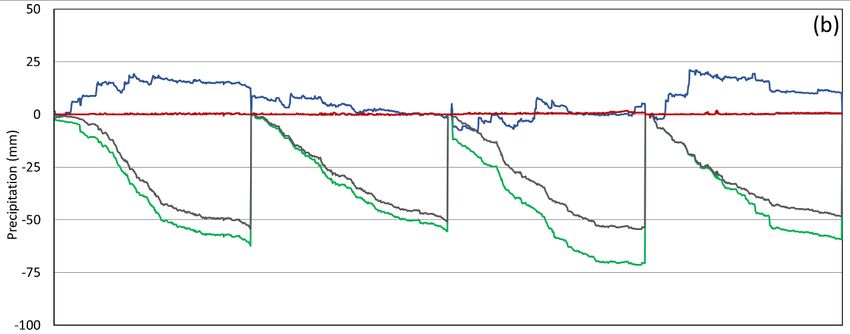
located on the cabin of the field station. A 600 mm capacity single-wire Geonor gauge was
installed at the Cameron valley research site (Table 2) within an area of mature pine forest
that was killed and defoliated in the Kenow wildfire of September 2017 [10]. Publicly
Data 2022, 7, 73 5 of 13
available precipitation data from the AEP Akamina site (Figure 1, located within 1.5 km
of Cameron) were available for comparison.
available
Table 2. precipitation data precipitation
Geonor totalizing from the AEPgauge
Akamina site (Figure
and weather 1, located
sensor withinfor
specifications 1.5the
kmCMR,
of WFS,
Cameron) were available
and Cameron sites. for comparison.
Site
Table 2. Geonor CMRand weather sensor specifications
totalizing precipitation gauge WFS Cameron
for the CMR, WFS,
and CameronElevation
sites. 2130 m asl 1400 m asl 1655 m asl
Latitude 49°19′15.18″ N 49°20′55.17″ N 49°2′3.52″ N
Site CMR WFS Cameron
Longitude 114°26′20.94″ W 114°24′39.01″ W 114°2′17.55″ W
Installation
Elevation date 17 September
2130 m asl 2015 7 September
1400 m asl 2017 1655 27
m October
asl 2018
Latitude 49◦ 190 15.1800 N 49◦ 200 55.1700 N 49◦ 20 3.5200 N
Precipitation gauge GEONOR T-200B-MD ◦GEONOR T-200B GEONOR T-200B
Longitude 114◦ 260 20.9400 W 114 240 39.0100 W 114◦ 20 17.5500 W
Capacity
Installation date 1500 mm
17 September 2015 600
7 September 2017mm 600 mm
27 October 2018
Precision vibrating
Precipitation gauge wire GEONOR T-200B-MD
3 GEONOR T-200B 1 GEONOR T-200B 1
Incoming
Capacityshortwave 1500 mm 600 mm 600 mm
Precision radiation
vibrating wire CS3 CMP3 1CS CNR1 1 CS CNR4
Incoming shortwave
Air temperature CS T109
CS CMP3 CS HC2S3
CS CNR1 CS CNR4 CS HMP45
radiation
Relative humidity
Air temperature CS
CS T109HMP45 CS
CS HC2S3 HC2S3 CS HMP45 CS HMP45
Wind speed
Relative humidity Met
CS HMP45One 013A RM Young
CS HC2S3 05103 RM
CS HMP45 Young 05103
Wind speed Met One 013A RM Young 05103 RM Young 05103
3.3. Data Cleaning and Quality Control
Systematic
3.3. Data measurement
Cleaning and biases are common in totalizing precipitation gauges [6].
Quality Control
Figure 3 shows
Systematic the processing
measurement workflow
biases to clean
are common the raw precipitation
in totalizing data and create each[6].
gauges adjusted
precipitation variable. Evaporative losses, sensor drift [14], and temperature- or wind-in-
Figure 3 shows the processing workflow to clean the raw data and create each adjusted
precipitation variable. Evaporative losses, sensor drift [14], and temperature- or wind-
duced noise can lead to significant deviations in the data (Figure 4; raw measurements are
induced noise can lead to significant deviations in the data (Figure 4; raw measurements
displayed with a black line). Under-catch of snow [15,26] and rain [12] can occur as a result
are displayed with a black line). Under-catch of snow [15,26] and rain [12] can occur
of wind across the gauge orifice. Over-catch of snow [6,16] can occur when there is no
as a result of wind across the gauge orifice. Over-catch of snow [6,16] can occur when
atmospheric precipitation
there is no atmospheric and windand
precipitation mobilizes the snow the
wind mobilizes from the ground
snow from theorground
surrounding
or can-
opy.
surrounding canopy.
Figure3.3. Quality
Figure Quality control
control workflow diagram illustrating
workflow diagram illustrating the
the sequence
sequence of
of steps
steps to
to compute
compute precipi-
tation-adjusted variables, including the weather data used in each code logic block.
precipitation-adjusted variables, including the weather data used in each code logic block.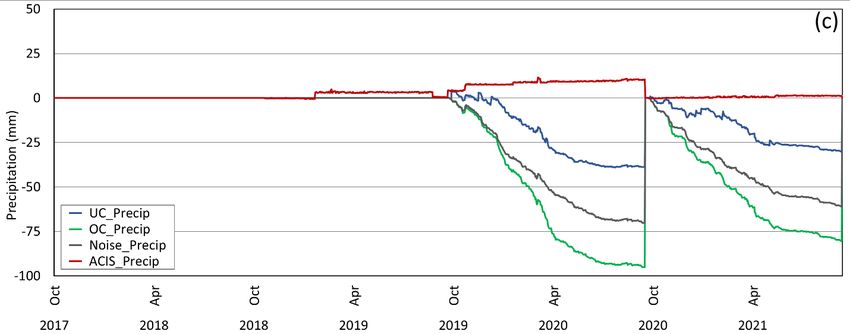
to adjust the 15 min time-series observation values. This tool removes all negative accu-
mulation, and the series is smoothed using a moving range window. The tool does not
adjust for evaporative losses in the gauge. The ACIS filtering tool was run twice for all
three Geonor time series (e.g., Figure 4). Once the tool completed its execution, a visual
inspection was done to verify the filtered output. After several trial runs, the parameter
Data 2022, 7, 73 6 of 13
settings listed in Table 3 were adopted for the ACIS_Precip variable. The second run (blue
line) was used as the baseline for further adjustments.
Figure 4. ACIS
Figure 4. ACIS “weighing
“weighinggauge
gaugetime-series
time-seriesanalysis
analysis and
and noise
noise filtering
filtering tool”
tool” sample.
sample. Black
Black line—
line—raw
raw
data;data; red line—run
red line—run #1; blue
#1; blue line—run
line—run #2. #2.
TableAn ACISweighing
3. ACIS “weighing gauge
gauge time-series
time-series analysisanalysis and
and noise noisetool
filtering filtering tool”settings
parameter [27] was
per
run.
used to adjust the 15 min time-series observation values. This tool removes all negative
accumulation, and the series is smoothed using a moving range window. The tool does
Run #for evaporative
not adjust Range Change losses inFactor Raw Count
the gauge. The ACIS filtering tool Comments
was run twice for all
1 (red
three line) time24
Geonor series (e.g., 0.2
Figure 4). Once3 the tool completed its execution, a visual
inspection was done to verify the filtered output. After several Baseline
trialused
runs,forthe
further
parameter
2 (blue line) 24 0.9 1
settings listed in Table 3 were adopted for the ACIS_Precip variable. adjustments
The second run (blue
line) was used as the baseline for further adjustments.
After the ACIS filtering tool execution was complete, further data cleaning was re-
quired
Table 3. to remove
ACIS weighingadditional noise and
gauge time-series adjustand
analysis thenoise
time seriestool
filtering for parameter
precipitation over-
settings per and
run.
under-catch [12,14]. Three additional cleaning routines were applied sequentially (as seen
Run # Range Change Factor Raw Count Comments
in Figure 3) to correct precipitation measurements. Two routines removed precipitation
1 (red
that did line)
not belong 24 0.2 while the third3 added precipitation that was missed.
in the time series,
Baseline used for further
Adjacent weather station
2 (blue line) 24 sensor data
0.9 (incoming shortwave1 radiation, adjustments
air temperature, rel-
ative humidity, and wind speed) were used as inputs to the correction calculations. Table
4 lists the constants used in each code logic block (below) to compute data values for the
After
removal ofthe ACIS
noise filtering toolover-catch
(Noise_Precip), execution (OC_Precip)
was complete, further
from datasnow,
blowing cleaning
and was re-
under-
quired to remove additional noise and adjust the time series for precipitation
catch (UC_Precip) of precipitation. The code logic blocks are executed sequentially for over- and
under-catch [12,14]. Three additional cleaning routines were applied sequentially (as seen
each 15 min observation (i), starting with the first observation in the data file and contin-
in Figure 3) to correct precipitation measurements. Two routines removed precipitation
uing to the end of the data file.
that did not belong in the time series, while the third added precipitation that was missed.
Adjacent
Table 4. Dataweather
cleaning station sensor
threshold data (incoming
parameter values usedshortwave
for each gaugeradiation,
site. air temperature,
relative humidity, and wind speed) were used as inputs to the correction calculations.
Threshold Table 4 lists the constants used in each code logic block (below) to compute data values
CMR WFS Cameron Comment
Values for the removal of noise (Noise_Precip), over-catch (OC_Precip) from blowing snow, and
NoiseThreshold 0.11 under-catch
0.05 0.05 of precipitation.
(UC_Precip) Threshold Theforcode
small positive
logic blocksprecipitation
are executedchanges
sequentially
In_SRThreshold 300 for 300
each 15 min 300
observation (i), Incoming SR threshold (daylight hours only) file and
starting with the first observation in the data
RHThreshold 75 65
continuing to the end65 of the data RH threshold when SR is greater than In_SRThreshold
file.
AirTempThreshold 0.0 The
0.0 noise (Noise_precip)
0.0 that the ACIS toolthreshold
Temperature did not filter out wassnow/rain
to separate subtracted from
the record. This noise was defined as precipitation less than the NoiseThreshold , with no
recorded measurements either before or after the observation (see Code Logic 1). The CMR
noise threshold value was set to 0.11 mm, as in [12]. As a result of a single vibrating wire
with no averaging [14], the WFS and Cameron gauges were more susceptible to noise than
the CMR Geonor gauge, which had three vibrating wires that were averaged to a single
measurement for each data record. The initial threshold setting was the same as CMR;
however, it was adjusted using trial and error, until the noise signal was mitigated. The
WFS and Cameron thresholds were set to 0.05 mm, which reduced the amount subtracted
from the records.
Data 2022, 7, 73                                                                                                        7 of 13

                          Table 4. Data cleaning threshold parameter values used for each gauge site.

         Threshold
                        CMR       WFS          Cameron                                 Comment
          Values
      NoiseThreshold    0.11       0.05          0.05              Threshold for small positive precipitation changes
      In_SRThreshold    300        300           300                 Incoming SR threshold (daylight hours only)
       RHThreshold       75         65            65              RH threshold when SR is greater than In_SRThreshold
     AirTempThreshold    0.0        0.0           0.0                Temperature threshold to separate snow/rain
         WSLower         1.2        1.2           1.2                 Lower wind speed bounds for under-catch
         WSUpper         6.5        6.5           6.5                 Upper wind speed bounds for under-catch
       Hanemometer      14.0        6.5           3.0                         Height of anemometer (m)
          Hgauge         3.0        2.0          1.75                        Height of Geonor orifice (m)
        Roughness       0.05       0.05          0.05                            Roughness length (m)
          CERain        1.05       1.05          1.05                     Catch efficiency multiplier for rain
          WSgauge               computed                                  Wind speed above the Geonor orifice
          CESnow                computed                                       Catch efficiency for snow

                          Code Logic 1.      Noise_Precip (small positive observations when no apparent precipitation
                          event occurs)
                          For each observation i starting with the first observation to the end of the file:
                               IF ACIS_Precip i < NoiseThreshold
                               Then IF ACIS_Precip i−1 > 0 or ACIS_Precip i+1 > 0
                                    Then Noise_Precip i = ACIS_Precip i
                                    Else Noise_Precip i = 0
                               Else Noise_Precip i = ACIS_Precip i
                          End.

                               The next step was to subtract the over-catch (OC_Precip) due to blowing snow that
                          was unlikely to result from atmospheric precipitation (see Code Logic 2). For CMR and
                          WFS, the presence of over-catch during non-precipitation blowing snow conditions could
                          be manually checked by reviewing the coincident camera imagery. While wind data have
                          potential as a proxy for blowing snow [12] inputs, they were found to be unreliable as
                          an automated data filtering variable because of occasional anemometer riming [16] at
                          temperatures near to 0 ◦ C, and because of the high frequency of winter blizzards where
                          both wind and precipitation display high but uncorrelated values. Therefore, over-catch
                          corrections were limited to precipitation recorded at temperatures below the rain/snow
                          threshold (AirTempThreshold ). As snow pellets can be present in the rain and snow, the
                          AirTempThreshold was set to 0 ◦ C [28]. A relative humidity threshold (RHThreshold ) was
                          used to further selectively subtract the recorded precipitation. An incoming solar radiation
                          threshold (In_SRThreshold ) was used to remove the daytime blowing snow. To calibrate
                          the In_SRThreshold , camera imagery was used to manually verify whether or not blowing
                          snow occurred above or below a certain value. Threshold values for CMR were set to
                          In_SRThreshold (300 watt/m2 ) and RHThreshold (75%) based on expert judgment, combined
                          with blowing snow observations in web cam imagery. The RHThreshold was set to 65% for
                          WFS to prevent precipitation events from being removed from the data record when there
                          was low incoming solar radiation (In_SRThreshold , 300 watt/m2 ) using camera imagery.
                          As the Cameron site does not have a camera, the same In_SRThreshold (300 watt/m2 ) and
                          RHThreshold (65%) threshold values were adopted as WFS owing to the similar gauge height
                          and environmental characteristics.
Data 2022, 7, 73 8 of 13
Code Logic 2. OC_Precip (remove over-catch from blowing snow using air temperature, In_SR,
and RH thresholds)
For each observation i:
IF Noise_Precip i > 0
Then IF AirTemp i > AirTempThreshold
Then OC_Precip i = Noise_Precip i
Else IF RH i < RHThreshold
Then OC_Precip i = 0
Else IF In_SR i > In_SRThreshold
Then OC_Precip i = 0
Else OC_Precip i = Noise_Precip i
Else OC_Precip i = 0
End.
The last QC step was an under-catch (UC_Precip) correction for snow and rain (see
Code Logic 3) using the formula and thresholds developed for a similar Rocky Mountain
site in Western Canada [12]. A lower (WSLower ) and upper (WSUpper ) bound was used to
limit the range for wind speed correction. Wind speed above the Geonor (WSgauge ) was
calculated using the height of the wind speed sensor (Hanemometer ), the height of the gauge
orifice (hgauge ), and a roughness length parameter. The roughness length for all of the
sites was set to 0.05, as each location has low-level vegetation. No further precipitation
adjustment was applied for wind speeds below the lower threshold. Wind speeds above
the upper threshold were set to the upper wind speed threshold value [12,16]. The catch
efficiency for snow (CESnow ) was calculated using the wind speed above the gauge orifice.
The catch efficiency for rain (CERain ) was set to a constant value. Setting the CMR gauge
upper wind speed threshold to 9 ms−1 , as in [12], caused the under-catch to be amplified
by an unreasonable amount during the snow season, so an upper limit of 6.5 ms−1 was
used, as this is typical for Arctic and northern regions [12].
Code Logic 3. UC_Precip (under-catch correction for snow and rain using wind speed at the top
of the gauge)
For each observation i:
WSgauge i = Wind i × (ln(hgauge /Roughness)/ln(Hanenometer /Roughness))
IF WSgauge i > WSUpper
Then WSgauge i = WSUpper
IF OC_Precip i > 0
Then IF WSgauge i > WSLower
Then IF AirTemp i < AirTempThreshold
Then
CESnow = 1.18 e−0.18 × WSgauge
UC_Precip i = OC_Precip i /CESnow
Else UC_Precip i = OC_Precip i × CERain
Else UC_Precip i = OC_Precip i
Else UC_Precip i = OC_Precip i
End.
The CMR, WFS, and Cameron Raw_Precip, ACIS_Precip, Noise_Precip, OC_Precip,
and UC_Precip data were aggregated to daily, monthly, and annual totals. For each year
in the CMR, WFS, and Cameron annual datasets, Code Logic 4 was used to calculate the
amount of precipitation adjustment for each variable in the cleaning workflow.Data 2022, 7, x FOR PEER REVIEW 9 of 14
in the CMR, WFS, and Cameron annual datasets, Code Logic 4 was used to calculate the
Data 2022, 7, 73 9 of 13
amount of precipitation adjustment for each variable in the cleaning workflow.
Code Logic 4. Amount of precipitation adjustment for each variable in the cleaning workflow
Code Logic 4. Amount of precipitation adjustment for each variable in the cleaning workflow
For each
For each year
year in
in the
the dataset:
dataset:
ACIS-filter
ACIS-filter = ACIS_Precip−−Raw_Precip
= ACIS_Precip Raw_Precip
Noise-reduction
Noise-reduction = Noise_Precip−−ACIS_Precip
= Noise_Precip ACIS_Precip
Over-catch
Over-catch==OC_Precip
OC_Precip−−Noise_Precip
Noise_Precip
Under-catch
Under-catch==UC_Precip
UC_Precip−−OC_Precip
OC_Precip
Total
Total Correction ==UC_Precip
Correction UC_Precip −−Raw_Precip
Raw_Precip
End.
End.
□
4. Aggregated
4. Aggregated Precipitation
Precipitation Output
Output Results
Results and
and Discussion
Discussion
For comparison
For comparison purposes,
purposes, Figure
Figure 55 shows
shows the
the cumulative
cumulative ACIS_precip
ACIS_precip time time series
series
for CMR,
for CMR, WFS,
WFS, andand Cameron.
Cameron. It It also
also includes
includes the
the public
public AEP
AEP Akamina
Akamina Pluvio
Pluvio totalizing
totalizing
precipitation gauge
precipitation gauge record,
record, which
which isis 1.5
1.5 km
km away
away andand 154
154 m
m higher
higher in in elevation
elevation than
than the
the
Cameron gauge.
Cameron gauge. Although
Although thethe data
data were
were collected
collected from
from twotwo different
different gauge
gauge types,
types, studies
studies
have shown
have shownGeonor
Geonorand andPluvio
Pluviomeasurements
measurements areare comparable
comparable [16].
[16]. TheTheAEP AEP public
public rec-
records
ords do not have the noise reduction or the under- or over-catch corrections applied [29],
do not have the noise reduction or the under- or over-catch corrections applied [29], so
so the
the Akamina
Akamina record
record is most
is most comparable
comparable to “ACIS_Precip”.
to “ACIS_Precip”. TheThe Akamina
Akamina record
record tends
tends to
to show
show a >10%
a >10% increase
increase overover Cameron
Cameron because
because of itsofhigher
its higher elevation
elevation andshadow
and rain rain shadow
effect
effect
on theon
leethe
sideleeofside
the of the mountain
mountain slopebut
slope [30], [30],
thebut the timing
timing and magnitude
and magnitude of precip-
of precipitation
itation events are visibly synchronous.
events are visibly synchronous.
Figure 5.
Figure 5. Cumulative
Cumulative precipitation
precipitation of
of ACIS_Precip
ACIS_Precip for
for CMR,
CMR, WFS,
WFS, and
and Cameron.
Cameron. The
The Akamina
Akamina
(dotted line) site is in close proximity to Cameron and illustrates a publicly available precipitation
(dotted line) site is in close proximity to Cameron and illustrates a publicly available precipitation
dataset that is comparable to ACIS_Precip.
dataset that is comparable to ACIS_Precip.
For each
For each site,
site,Figure
Figure66presents
presentsthethemagnitude
magnitudeofofeacheach cumulative
cumulative precipitation
precipitation cor-
correc-
rection
tion (ACIS_Precip,
(ACIS_Precip, Noise_Precip,
Noise_Precip, OC_Precip,
OC_Precip, and UC_Precip)
and UC_Precip) relative to relative to the
the Raw_Precip
Raw_Precip baseline through time. The adjustments for CMR (Figure 6a),
baseline through time. The adjustments for CMR (Figure 6a), WFS (Figure 6b), and Cameron WFS (Figure
6b), and6c)
(Figure Cameron (Figure
are plotted 6c) are
for each plotted for
hydrologic each hydrologic year.
year.
The Raw_precip and ACIS_precip daily
The Raw_precip and ACIS_precip daily total total precipitation
precipitationvalues diddid
values not not
deviate sig-
deviate
nificantly. The WFS and Cameron valley-level gauges measured similar
significantly. The WFS and Cameron valley-level gauges measured similar depths of depths of precip-
itation for thefor
precipitation years of comparable
the years data. Similar
of comparable to CMR,
data. Similar both gauges
to CMR, demonstrated
both gauges min-
demonstrated
imal difference between the Raw_Precip measurements and ACIS_Precip
minimal difference between the Raw_Precip measurements and ACIS_Precip filtered data. filtered data.
There was
There was aa small
small amount
amount of of noise
noise (Noise_Precip)
(Noise_Precip) in in the
the CMR
CMR gauge
gauge that
that contributed
contributed
approximately 1 to 2 mm per month. WFS and Cameron were more
approximately 1 to 2 mm per month. WFS and Cameron were more susceptible to susceptible to noise
noise
during the colder winter months when most of the annual Noise_Precip adjustment oc-
curred. Cameron had a higher amount of noise compared with WFS, which was possibly a
function of the different canopy cover or wind turbulence surrounding the gauge sites.from 5 mm to 76 mm, occurring either in October or the spring time frame, presumably
due to warmer temperatures and less mobile snow.
Under-catch (UC_Precip) corrections at all sites were the greatest during snow cover
months from September through to late spring. WFS under-catch corrections were fre-
quent between October to April, while for Cameron, they occurred primarily from Octo-
Data 2022, 7, 73 10 of 13
ber to February and, to a lesser degree, during March to May. The under-catch code logic
was sensitive to high wind speeds, especially during snowfall events.
Data 2022, 7, x FOR PEER REVIEW 11 of 14
Figure 6.
Figure 6. The
The relative
relative ACIS_Precip,
ACIS_Precip, Noise_Precip,
Noise_Precip, OC_Precip,
OC_Precip, and
and UC_Precip
UC_Precip deviations
deviations from
from the
the
Raw_Precip baseline for (a) CMR, (b) WFS, and (c) Cameron.
Raw_Precip baseline for (a) CMR, (b) WFS, and (c) Cameron.
The high-elevation
Over-catch CMRcorrections
(OC_Precip) ridge gauge onrecorded
the CMR the
ridgehighest annual precipitation
were prevalent of all
in the late winter
of the gauges (see Figure 5). The annual CMR ACIS-filtered record (Table
and spring months, accounting for an additional 36 mm to 65 mm per year. The WFS and 5) was within a
few millimeters of the raw precipitation measurements. Of the three sites,
Cameron valley sites demonstrated a blowing snow over-catch correction, ranging from CMR displayed
5the
mmlargest
to 76annual total correction,
mm, occurring either inranging between
October 39.2% time
or the spring to 48.8%, with
frame, under-catch
presumably rep-
due to
resenting the largest correction factor
warmer temperatures and less mobile snow. at up to 51.5% of the annual total for 2017–2018 and
2019–2020. This represents an approximate doubling of the raw precipitation observations
for the alpine ridge location, although this is a plausible amplification of the annual pre-
cipitation, given it is known that the mean winter snow accumulations at these alpine
elevations can exceed valley depths by a factor of four [31]. WFS displayed between −0.1%
to 1.4% precipitation correction, with Cameron showing a −4.2% to −3.6% annual decrease.
The removal of noise and adding an under-catch correction were the most impactful ad-Data 2022, 7, 73 11 of 13
Under-catch (UC_Precip) corrections at all sites were the greatest during snow cover
months from September through to late spring. WFS under-catch corrections were frequent
between October to April, while for Cameron, they occurred primarily from October to
February and, to a lesser degree, during March to May. The under-catch code logic was
sensitive to high wind speeds, especially during snowfall events.
The high-elevation CMR ridge gauge recorded the highest annual precipitation of all
of the gauges (see Figure 5). The annual CMR ACIS-filtered record (Table 5) was within a
few millimeters of the raw precipitation measurements. Of the three sites, CMR displayed
the largest annual total correction, ranging between 39.2% to 48.8%, with under-catch
representing the largest correction factor at up to 51.5% of the annual total for 2017–2018 and
2019–2020. This represents an approximate doubling of the raw precipitation observations
for the alpine ridge location, although this is a plausible amplification of the annual
precipitation, given it is known that the mean winter snow accumulations at these alpine
elevations can exceed valley depths by a factor of four [31]. WFS displayed between
−0.1% to 1.4% precipitation correction, with Cameron showing a −4.2% to −3.6% annual
decrease. The removal of noise and adding an under-catch correction were the most
impactful adjustments for the valley gauges, resulting in an almost net zero annual change
in precipitation measurement.
Table 5. Annual amount of precipitation adjustment for each variable in the cleaning workflow in
millimeters (amount of adjustment as a percentage is listed in the brackets) computed using Code
Logic 4. Weather station data were not complete for Cameron during its first year of operation, so the
complete QC process was only applied to the last two hydrologic years (2019–2021).
2017–2018 2018–2019 2019–2020 2020–2021
Correction
mm (%) mm (%) mm (%) mm (%)
CMR
ACIS filter −2.1 (−0.2%) 1.6 (0.1%) 4.7 (0.4%) 1.4 (0.1%)
Noise reduction −17.5 (−1.3%) −18.6 (−1.6%) −15.9 (−1.2%) −10.2 (−0.8%)
Over-catch −64.6(−5.1%) −36.0 (−3.3%) −60.0 (−4.8%) −54.1 (−4.7%)
Under-catch 1342.0 (51.5%) 783.7 (42.0%) 1340.3 (51.5%) 1189.7 (50.7%)
Total correction 1258.1 (48.3%) 730.7 (39.2%) 1269.1 (48.8%) 1126.9 (48.0%)
WFS
ACIS filter 0.2 (0.0%) 0.1 (0.0%) 0.9 (0.1%) 0.5 (0.1%)
Noise reduction −54.7 (−6.2%) −50.8 (−5.4%) −54.5 (−5.6%) −48.9 (−5.7%)
Over-catch −7.8 (−1.0%) −4.6 (−0.5%) −16.9 (−1.9%) −10.9 (−1.4%)
Under-catch 74.9 (8.4%) 53.9 (5.7%) 75.6 (7.7%) 69.5 (8.0%)
Total correction 12.6 (1.4%) −1.4 (−0.1%) 5.1 (0.5%) 10.2 (1.2%)
Cameron
ACIS filter 6.4 (0.7%) 1.2 (0.1%)
Noise reduction −76.4 (−7.9%) −62.1 (−7.2%)
Over-catch −24.9 (−2.9%) −19.4 (−2.5%)
Under-catch 56.5 (6.1%) 50.2 (6.0%)
Total correction −38.5 (−4.2%) −30.1 (−3.6%)
5. Conclusions
This study applied data cleaning and QC to raw Geonor totalizing precipitation gauge
records for three sites in the Canadian Rockies. The filtered ACIS_Precip and Raw_Precip
data series were tracked closely together for all three gauges at daily and longer time
increments. Despite being in a more severe wind environment, the annual noise in the
CMR ridge record was small (10 mm to 20 mm) compared with the WFS (49 mm to 55 mm)
and Cameron (62 mm to 76 mm) valley gauges as a result of the real-time averaging of the
three vibrating wires relative to the single vibrating wire of the valley sites. The annual
amount of CMR blowing snow over-catch correction was 36 mm to 65 mm; for WFS, it was
5 mm to 17 mm; and for Cameron, it was 19 mm to 25 mm. This correction was applied for
measurements occurring throughout the day. However, using incoming solar radiation,Data 2022, 7, 73 12 of 13
additional corrections were possible during daylight hours. During non-daylight hours,
it was not possible to reliably separate blowing snow from blizzard conditions, which
suggests the total over-catch in the records may be slightly higher than what was estimated.
The CMR record was most sensitive to under-catch corrections (731 mm to 1342 mm) as a
result of high wind speeds in the turbulent ridge environment. This was mostly associated
with the WSUpper threshold value and is therefore sensitive to changes in this parameter
value. The under-catch for WFS and Cameron was significantly less than that of CMR,
ranging from 50 to 76 mm. This study illustrates that, with all QC adjustments applied,
total precipitation records ranged between small corrections of ~−4% to 1% for valley
locations up to ~49% for alpine ridge locations. Therefore, without applying such data
cleaning and QC procedures, significant errors would be propagated into headwater water
balance or precipitation orographic enhancement estimates derived from such records.
Author Contributions: Conceptualization, C.H. and C.B.; methodology, C.B.; software, C.B.; valida-
tion, C.H.; formal analysis, C.B.; investigation, C.B. and C.H.; resources, C.H.; data curation, C.B.;
writing—original draft preparation, C.B.; writing—review and editing, C.B. and C.H.; visualization,
C.B.; supervision, C.H.; project administration, C.H.; funding acquisition, C.H. All authors have read
and agreed to the published version of the manuscript.
Funding: This research was funded via the following grants: Alberta Innovates, Energy, and En-
vironment Solutions, the Water Innovation Program (grant: E323726); Alberta Environment and
Parks (grant: 19GRAEM26); Natural Sciences and Engineering Research Council, Discovery Grant
(2017-04362); and the Alberta Research Capacity Program and Canada Foundation for Innovation
(grant: 32436).
Data Availability Statement: The raw and processed precipitation and supplemental meteorological
datasets are available for download from the Federated Research Data Repository: https://doi.org/
10.20383/102.0551 (accessed on 4 May 2022) under Creative Commons Attribution 4.0 International
(CC BY 4.0) license.
Acknowledgments: We thank Reed Parsons for assistance with the Geonor installation at the CMR
site and Thomas Porter for assistance with the Geonor installation at the WFS and Cameron sites, as
well as maintenance at all sites. Alberta Environment and Parks is thanked for assistance with winter
maintenance at the Cameron site.
Conflicts of Interest: The authors declare no conflict of interest. The funders had no role in the design
of the study; in the collection, analyses, or interpretation of data; in the writing of the manuscript; or
in the decision to publish the results.
References
1. Alberta Environment. Water for Life—Alberta’s Strategy for Sustainability; Government of Alberta: Edmonton, AB, Canada, 2003.
2. Kienzle, S.W. Water Yield and Streamflow Trend Analysis for Alberta Watersheds; Alberta Innovates, Energy and Environment
Solutions: Edmonton, AB, Canada, 2012.
3. Thiessen, A.H. Precipitation Averages for Large Areas. Mon. Weather. Rev. 1911, 39, 1082–1089. [CrossRef]
4. Rasmussen, R.; Baker, B.; Kochendorfer, J.; Meyers, T.; Landolt, S.; Fischer, A.P.; Black, J.; Thériault, J.M.; Kucera, P.; Gochis, D.;
et al. How Well Are We Measuring Snow: The NOAA/FAA/NCAR Winter Precipitation Test Bed. Bull. Am. Meteorol. Soc. 2012,
93, 811–829. [CrossRef]
5. Avanzi, F.; Ercolani, G.; Gabellani, S.; Cremonese, E.; Pogliotti, P.; Filippa, G.; Morra di Cella, U.; Ratto, S.; Stevenin, H.; Cauduro,
M. Learning about precipitation lapse rates from snow course data improves water balance modeling. Hydrol. Earth Syst. Sci.
2021, 25, 2109–2131. [CrossRef]
6. Goodison, B.E.; Louie, P.Y.; Yang, D. WMO Solid Precipitation Measurement Intercomparison; World Meteorological Organization:
Geneva, Switzerland, 1998.
7. Wright, R. Current and Historical Alberta Weather Station Data; Alberta Climate Information Service (ACIS): Edmonton, AB,
Canada, 2021.
8. Newton, B.W.; Farjad, B.; Orwin, J.F. Spatial and Temporal Shifts in Historic and Future Temperature and Precipitation Patterns
Related to Snow Accumulation and Melt Regimes in Alberta, Canada. Water 2021, 13, 1013. [CrossRef]
9. Barnes, C.; Hopkinson, C.; Porter, T.; Xi, Z. In-Situ LED-Based Observation of Snow Surface and Depth Transects. Sensors 2020,
20, 2292. [CrossRef] [PubMed]
10. Waterton Lakes National Park. Kenow Fire: Burn Severity Map; Parks Canada: Gatineau, QC, Canada, 2017; p. 1.Data 2022, 7, 73 13 of 13
11. Earle, M.; Reverdin, A.; Wolff, M.; Smith, C.; Morin, S.; Rodica, N. Data Processing and Quality Control Methodology for the
Derivation of Reference Datasets. In Project Team and (Reduced) International Organizing Committee for the WMO Solid Precipitation
Intercomparison Experiment Final Report 2014, Fifth Session; WMO: Sodankylä, Finland, 2014; p. 77.
12. Pan, X.; Yang, D.; Li, Y.; Barr, A.; Helgason, W.; Hayashi, M.; Marsh, P.; Pomeroy, J.; Janowicz, R.J. Bias corrections of precipitation
measurements across experimental sites in different ecoclimatic regions of western Canada. Cryosphere 2016, 10, 2347–2360.
[CrossRef]
13. Peck, E.L. Snow measurement predicament. Water Resour. Res. 1972, 8, 244–248. [CrossRef]
14. Leeper, R.D.; Palecki, M.A.; Davis, E. Methods to Calculate Precipitation from Weighing-Bucket Gauges with Redundant Depth
Measurements. J. Atmos. Ocean. Technol. 2015, 32, 1179–1190. [CrossRef]
15. Wolff, M.; Isaksen, K.; Petersen-Øverleir, A.; Ødemark, K.; Reitan, T.; Brækkan, R. Derivation of a new continuous adjustment
function for correcting wind-induced loss of solid precipitation: Results of a Norwegian field study. Hydrol. Earth Syst. Sci. 2015,
19, 951–967. [CrossRef]
16. Kochendorfer, J.; Nitu, R.; Wolff, M.; Mekis, E.; Rasmussen, R.; Baker, B.; Earle, M.E.; Reverdin, A.; Wong, K.; Smith, C.D. Analysis
of single-Alter-shielded and unshielded measurements of mixed and solid precipitation from WMO-SPICE. Hydrol. Earth Syst.
Sci. 2017, 21, 3525–3542. [CrossRef]
17. Baghapour, B.; Wei, C.; Sullivan, P.E. Numerical simulation of wind-induced turbulence over precipitation gauges. Atmos. Res.
2017, 189, 82–98. [CrossRef]
18. Kochendorfer, J.; Rasmussen, R.; Wolff, M.; Baker, B.; Hall, M.E.; Meyers, T.; Landolt, S.; Jachcik, A.; Isaksen, K.; Brækkan, R. The
quantification and correction of wind-induced precipitation measurement errors. Hydrol. Earth Syst. Sci. 2017, 21, 1973–1989.
[CrossRef]
19. Kochendorfer, J.; Nitu, R.; Wolff, M.; Mekis, E.; Rasmussen, R.; Baker, B.; Earle, M.E.; Reverdin, A.; Wong, K.; Smith, C.D.
Testing and development of transfer functions for weighing precipitation gauges in WMO-SPICE. Hydrol. Earth Syst. Sci. 2018,
22, 1437–1452. [CrossRef]
20. Hopkinson, C.; Barnes, C. Precipitation Gauge and Supplemental Weather Station Data for Three Oldman River Headwater Locations in
SW Alberta; Federated Research Data Repository: Toronto, ON, Canada, 2022.
21. Alberta Environment and Parks. Alberta’s River Forecast Centre: Awareness and Communication; Alberta Environment and Parks:
Edmonton, AB, Canada, 2019.
22. CMR Board. Castle Mountain Resort Area Structure Plan; CMR Board, Castle Mountain Resort: Pincher Creek, AB, Canada,
2002; p. 61.
23. Campbell Scientific (Canada) Corp. GEONOR T-200B Series Precipitation Gauge; Campbell Scientific (Canada) Corp.: Edmonton,
AB, Canada, 2011; p. 64.
24. Lang-Gorman, J. Protocols for Geonor Operation; Alberta Forestry, Ed.; Alberta Environment and Parks: Edmonton, AB, Canada,
2018; p. 10.
25. Campbell Scientific (Canada) Corp. CR1000 Datalogger Operator’s Manual; Campbell Scientific (Canada) Corp.: Edmonton, AB,
Canada, 2020; p. 628.
26. Zhang, L.; Zhao, L.; Xie, C.; Liu, G.; Gao, L.; Xiao, Y.; Shi, J.; Qiao, Y. Intercomparison of Solid Precipitation Derived from the
Weighting Rain Gauge and Optical Instruments in the Interior Qinghai-Tibetan Plateau. Adv. Meteorol. 2015, 2015, 11. [CrossRef]
27. Wright, R. Weighing Gauge Time Series Analysis and Noise Filtering Tool; Alberta Agriculture and Forestry: Edmonton, AB,
Canada, 2021.
28. Meteorological Service of Canada. MANOBS-Manual of Surface Weather Observation Standards, 8th ed.; Meteorological Service of
Canada: Gatineau, QC, Canada, 2021; p. 204.
29. Nitu, R.; Wong, K. CIMO Survey on National Summaries of Methods and Instruments for Solid Precipitation Measurement at Automatic
Weather Stations, IOM 102, TD1544; WMO: Geneva, Switzerland, 2010.
30. Smith, R.B. 100 years of progress on mountain meteorology research. Meteorol. Monogr. 2019, 59, 20.21–20.73. [CrossRef]
31. Cartwright, K.; Hopkinson, C.; Kienzle, S.; Rood, S.B. Evaluation of temporal consistency of snow depth drivers of a Rocky
Mountain watershed in southern Alberta. Hydrol. Processes 2020, 34. [CrossRef]You can also read


