Guide to FTSE Sustainable Investment Data used in FTSE Indexes - v1.1 Methodology
←
→
Page content transcription
If your browser does not render page correctly, please read the page content below

Methodology

Guide to FTSE Sustainable
Investment Data used in FTSE
Indexes
v1.1

ftserussell.com   An LSEG Business   June 2021
Contents
1.0     Introduction ....................................................................3

2.0     Overview .........................................................................4

3.0     ESG Data Sources ....................................................... 15

4.0     FTSE ESG Ratings Quality Control ............................ 20

5.0     Transition Pathway Initiative Management Quality
        Score ............................................................................. 21

6.0     The FTSE Green Revenues Data Model ..................... 22

7.0     The FTSE Carbon Reserves Data Model .................... 25

8.0     The FTSE Carbon Emissions Data Model .................. 27

Appendix A: Further Information ......................................... 30

FTSE Russell An LSEG Business | Guide to FTSE Sustainable Investment Data used in FTSE           2 of 30
Indexes, v1.1, June 2021
Section 1
Introduction
1.0 Introduction
1.1 This document provides details of the sustainable investment data used in the construction and
maintenance of FTSE sustainable investment indexes which has been sourced by FTSE Russell.
1.2 FTSE Russell
FTSE Russell is a trading name of FTSE International Limited, Frank Russell Company, FTSE
Global Debt Capital Markets Limited (and its subsidiaries FTSE Global Debt Capital Markets Inc.
and MTSNext Limited), Mergent, Inc., FTSE Fixed Income LLC, The Yield Book Inc and Beyond
Ratings.
1.3 No liability whether as a result of negligence or otherwise is accepted by FTSE Russell (or any
person concerned with the preparation or publication of this Guide) for any losses, damages, claims
and expenses suffered by any person as a result of:
• any reliance on this Guide, and/or
• any errors or inaccuracies in this Guide, and/or
• any non-application or misapplication of the policies or procedures described in this Guide.
FTSE Russell An LSEG Business | Guide to FTSE Sustainable Investment Data used in FTSE Indexes, 3 of 30
v1.1, June 2021Section 2
FTSE ESG Ratings Calculation
2.0 Overview
FTSE Russell’s ESG Data Model produces ratings that are an objective measure of ESG exposure
and performance in multiple dimensions (the FTSE ESG Ratings).
The FTSE ESG Ratings are used in certain FTSE sustainable investment indexes to determine the
eligibility of index constituents.
2.1 Key Features
Materiality: Exposure relative scoring at Theme level: It is important that companies that are
more exposed to particular Themes such as Climate Change, Corporate Governance, and Labor
Standards are doing more to address them. Therefore, higher exposure companies are assessed
using higher thresholds than lower exposure companies.
Materiality: Exposure relative scoring at Pillar and Overall level: The Pillar Score is calculated
as a weighted average of the Theme Scores. Each Theme Score is weighted by its Exposure Level;
Low Exposure has a weight of 1, Medium Exposure a weight of 2, and High Exposure a weight of 3.
This principle is also applied to calculate the overall FTSE ESG Rating where the weight for each
Pillar is based on the average Exposure Level of the Themes within it.
Industry Relative ESG Ratings and Scores: In addition to the “absolute” Scores and Ratings
described above, peer relative Scores and ESG Ratings are also provided. These are calculated by
comparing a company’s Score or ESG Rating to others within the same FTSE Industry Classification
Benchmark (ICB) Supersector. The overall FTSE ESG Rating is represented as a percentile where a
“1” indicates that a company is in the bottom 1% and “100” indicates a company is in the top 1%.
FTSE Russell An LSEG Business | Guide to FTSE Sustainable Investment Data used in FTSE Indexes, 4 of 30
v1.1, June 20212.2 FTSE ESG Ratings Model
The FTSE ESG Ratings use a company’s Theme Exposure and Theme Score assessment to
calculate a range of assessments that allow investors to understand a company’s ESG practices in
multiple dimensions.
FTSE Russell An LSEG Business | Guide to FTSE Sustainable Investment Data used in FTSE Indexes, 5 of 30
v1.1, June 20212.3 ESG Data Model
Hierarchy Description Methodology Output
ESG Rating (1) Measure of the overall quality Calculated as the Pillar 0-5 to 1 decimal point
of a company’s management Exposure-weighted (where 5 is highest Rating)
of ESG issues average of all three Pillar
Scores ICB Supersector relative
Rating: 1-100 percentile
(where 100 is highest
percentile)
Pillars (3) Scores. Measure of the quality Calculated as the Theme 0-5 to 1 decimal point
of a company’s respective Exposure-weighted (where 5 is highest Rating)
Environmental management of ESG issues average of all applicable ICB Supersector relative
Social Theme Scores score: 1-10 decile (where
Governance 10 is highest decile)
Exposure. Measure of the Calculated by averaging 1-3 to 1 decimal point
relevance for a company of the Exposure for all (where 3 is highest
respective ESG issues applicable Themes within Exposure, i.e. relevance)
that Pillar
Themes (14) Scores. Measure of the quality Calculated based on the 0-5 as an integer (where 5
of a company’s management percentage of total is highest Rating)
5 Environmental of the issues related to each available Indicator Points
5 Social Theme that a company has “met”
4 Governance in each Theme, except for
the Climate Change
Theme which uses TPI
MQ Score (see section 5).
Exposure. Measure of the Determined largely on 0-3 as an integer (where 3
relevance for a company of industrial activity and is highest Exposure, i.e.
each Theme operational presence relevance, and 0 indicates
that the Theme is not
relevant)
Indicators (+300) Over 300 Indicators in the (i) qualitative Indicators Points are assigned and
model with each Theme assessing quality of are generally 0, 1, or 2 per
containing 10 to 35. An management and Indicator. However, for
average of 125 Indicators are approach highly significant Indicators,
applied per company. (ii) quantitative Indicators the scoring can be greater.
measuring corporate data
disclosure
(iii) sector specific
Indicators tailored for
different industrial sectors
(iv) geography specific
Indicators tailored for
different countries
(v) performance Indicators
that use the quantitative
data to make performance
judgements
FTSE Russell An LSEG Business | Guide to FTSE Sustainable Investment Data used in FTSE Indexes, 6 of 30
v1.1, June 20212.4 Calculation Step 1: Determining Theme Exposures
For each Theme a company’s Exposure is identified as High, Medium, Low, or Negligible/Not
Applicable (N/A).
The Exposure identification is carried out for each company in each applicable Theme applying a
rules-based methodology that uses certain aspects tailored to that Theme. 1 These aspects include:
• Subsector: The FTSE Industry Classification Benchmark (ICB) Subsector definitions are used to
identify the relevance of a Theme for a company.2 Note that a company will be identified for
multiple Subsectors if it has a significant operations in more than one; hence there is “one to
many” Subsector mapping. Subsectors are categorized as Primary, Secondary, or Tertiary
Impact according to the relevance of the Theme to companies in the Subsector. For companies
involved in multiple Subsectors, the Subsector with the highest relevance (e.g. Primary Impact
Subsector) will be used for Theme Exposure assessments.3
• Primary, Secondary, or Tertiary Impact Subsectors: Subsectors are categorized as
Primary, Second, or Tertiary Impact according to the relevance of the Theme to the
Subsector.
• Geography: This assesses whether the company has operations in countries that are defined as
being most relevant to the Theme and hence where the associated impacts are considered
greatest.4
• Primary Impact Countries: those countries where associated impacts are greatest,
according to a rules-based methodology which uses publicly available data.
• Multinational: This assesses whether a company has over 30% of its revenues derived from
outside their domestic region.5
• Other Theme Exposures: For the Risk Management Theme consideration is given to the
company’s cumulative Exposures in the other 13 Themes.
1
The methodology for the Exposure classification methodology is developed in consultation with external experts and the FTSE Russell
ESG Advisory Committee.
2
The Industry Classification Benchmark (ICB) is a definitive system categorising over 70,000 companies and 75,000 securities
worldwide. A company is allocated to the Subsector of ICB whose definition most closely fits the business that accounts for the primary
source of the company’s revenue. See the Appendix and http://www.icbenchmark.com/
3
ICB Subsector 2791 Business Support Services: this Subsector is divided into micro-sectors for the purposes of this methodology:
Consultancy Services/White-Collar Activities; On-site services; Security Systems Services; Help Supply Services; Cleaning Services
4
A wide range of publicly available databases, statistics, indexes, listings and Ratings are used depending on the issue.
5
This draws from the FTSE Multinationals Index Series definition. Multinationals are defined as companies that derive 30% or more of
their revenue from outside of the domestic region in which they are incorporated.
www.ftserussell.com/products/indices/multinationals
FTSE Russell An LSEG Business | Guide to FTSE Sustainable Investment Data used in FTSE Indexes, 7 of 30
v1.1, June 2021Tailored for each company in each Theme: Exposure Classification is applied in a unique manner
for each company in each Theme as summarised below:
Exposure
Theme Measures* Subsector Geography Other
Biodiversity H/M ✓ ✓ Subsector Filter
Climate Change H/M/L ✓
Pollution & Resources H/M ✓
Supply Chain: Environmental H ✓ Subsector Filter
Water Security H/M ✓ ✓ Subsector Filter
Customer Responsibility H ✓ Subsector Filter
Health & Safety H/M ✓ ✓
Human Rights & Community H/M/L ✓ ✓
Labor Standards H/M/L ✓ ✓
Supply Chain: Social H ✓ Subsector Filter
Anti-corruption H/M ✓ ✓ Multinational
Corporate Governance M All
Risk Management H ✓ Other Theme Exposures
Tax Transparency M ✓ Multinational
*High (H), Medium (M), Low (L)
FTSE Russell An LSEG Business | Guide to FTSE Sustainable Investment Data used in FTSE Indexes, 8 of 30
v1.1, June 2021Case Study Example Company X
In each step, to demonstrate the methodology, we build on a case study example.
Company X is an automobile company that designs, builds and sells cars, trucks and automobile parts globally. In addition to the
products it sells to its dealers for consumer retail sales, it also sells cars and trucks to fleet customers, including daily rental car
companies, commercial fleet customers, leasing companies and governments. Based in the US, it has operations in more than 40
Primary Impact countries. It is categorized in ICB Subsector 3353 Automobiles and is mapped to ICB Subsector 3355 Auto Parts.
Case Study Example Company X
Theme
Exposure
Theme Legend (H/M/L) Rationale
Biodiversity EBD N/A The company does not operate in any Subsector that is
applicable to this Theme.
Climate Change ECC Medium ICB 3353 Automobiles is categorized as Secondary Impact
for this Theme, and some sector specific indicators apply.
Pollution & Resources EPR High ICB 3353 Automobiles is categorized as Primary Impact
for this Theme.
Supply Chain: ESC High ICB 3353 Automobiles is categorized as Primary Impact
Environmental for this Theme, and the Subsector Filter confirms it
sources physical inputs from third parties that form part of
a final product.
Water Security EWT Medium ICB 3353 Automobiles is categorized as Secondary Impact
for this Theme, the Subsector Filter confirms that the
company uses water in its industrial processes, and it
operates in Primary Impact countries such as India.
Customer Responsibility SCR N/A The company does not operate in any Subsector that is
applicable to this Theme.
Health & Safety SHS Medium ICB 3353 Automobiles is categorized as Secondary Impact
for this Theme.
Human rights & Community SHR Medium ICB 3353 Automobiles is categorized as Secondary Impact
for this Theme, and the company operates in Primary
Impact Countries such as China.
Labor Standards SLS High ICB 3353 Automobiles is categorized as Primary Impact
for this Theme, and the company operates in Primary
Impact Countries e.g. Brazil, China, Colombia, Mexico.
Supply Chain: Social SSC High ICB 3353 Automobiles is categorized as Primary Impact
for this Theme, and the Subsector Filter confirms it
sources physical inputs from third parties that form part of
a final product
Anti-corruption GAC High ICB 3353 Automobiles is categorized as Primary Impact
for this Theme, and the company operates in Primary
Impact Countries such as China, Haiti and Egypt, and is
classified as a Multinational.
Corporate Governance GCG Medium ICB 3353 Automobiles is categorized as Secondary Impact
for this Theme.
Risk Management GRM High ICB 3353 Automobiles is categorized as Primary Impact
for this Theme.
Tax Transparency GTX Medium The company is operating in Primary Impact Countries
such as the Cayman Islands and Switzerland, and is
classified as a Multinational.
FTSE Russell An LSEG Business | Guide to FTSE Sustainable Investment Data used in FTSE Indexes, 9 of 30
v1.1, June 20212.5 Calculation Step 2: Indicator Assessment & Scoring
Once the Exposure has been set for each Theme the Theme Indicators are assessed and scored.
Companies with higher Exposure are assessed using higher standards than those with lower
Exposure, for example by being assessed against more Indicators as part of the Theme scoring.
Here is a summary of the way Indicators are assessed and scored.
Indicator Points: Points are awarded for each Indicator met in a particular Theme.
Indicator Weights: In addition to the Points awarded for each Indicator, each Indicator has a
weight. Some Indicators, such as sector-specific and performance Indicators, are given additional
weight.
Percentage of Total Indicator Points: The total number of Points awarded is divided by the
maximum number of Points possible to give a percentage. This is done for all Themes.
Case Study Example Company X
Theme Exposure % Indicator Points
Theme Legend (H/M/L) Scored
Biodiversity EBD N/A N/A
Climate Change ECC Medium NAP6
Pollution & Resources EPR High 37%
Supply Chain: Environmental ESC High 28%
Water Security EWT Medium 56%
Customer Responsibility SCR N/A N/A
Health & Safety SHS Medium 7%
Human Rights & Community SHR Medium 23%
Labor Standards SLS High 10%
Supply Chain: Social SSC High 33%
Anti-corruption GAC High 13%
Corporate Governance GCG Medium 89%
Risk Management GRM High 30%
Tax Transparency GTX Medium 7%
6
The Climate Change Theme Score is derived from a combination of the TPI MQ Score (see section 5) and carbon emissions relative
to peers.
FTSE Russell An LSEG Business | Guide to FTSE Sustainable Investment Data used in FTSE Indexes, 10 of 30
v1.1, June 20212.6 Calculation Step 3: Calculating Theme Scores
To determine a company’s Score in any Theme:
The Exposure and the percentage of Indicator Points scored in that Theme is required to determine
a Theme score.
For each Theme the number of Indicator “Points” a company meets is calculated as a percentage of
total applicable Points and a Theme Score is given based on threshold bands. The threshold bands
are higher for companies with a High Exposure than the bands for a company with Low Exposure.
The percentage of Points awarded is applied to the framework below to assign a Theme Score from
0-5, with 5 being the highest. This is repeated for all applicable Themes.
Theme Exposure
Low Medium High
0 N/A 0% 0%
1 0–5% 1–5% 1–10%
Theme Score
Percentage of
2 6–10% 6–20% 11–30%
Indicator Points
3 11–30% 21–40% 31–50% scored
4 31–50% 41–60% 51–70%
5 51–100% 61–100% 71–100%
FTSE Russell An LSEG Business | Guide to FTSE Sustainable Investment Data used in FTSE Indexes, 11 of 30
v1.1, June 2021Case Study Example Company X
The table below builds on the previous example by converting the percentage of Indicator Points Scores to
the Theme Score.
% Theme Theme Score
Indicator (0 to 5)
Theme Exposure Points
Theme Legend (H/M/L) Scored
Biodiversity EBD N/A N/A N/A
Climate Change ECC Medium NAP7 4
Pollution & Resources EPR High 37% 3
Supply Chain: Environmental ESC High 28% 2
Water Security EWT Medium 56% 4
Customer Responsibility SCR N/A N/A N/A
Health & Safety SHS Medium 7% 2
Human Rights & Community SHR Medium 23% 3
Labor Standards SLS High 10% 1
Supply Chain: Social SSC High 33% 3
Anti-corruption GAC High 13% 2
Corporate Governance GCG Medium 89% 5
Risk Management GRM High 30% 2
Tax Transparency GTX Medium 5% 1
7
The Climate Change Theme Score is derived from a combination of the TPI MQ Score (see section 5) and carbon emissions relative
to peers.
FTSE Russell An LSEG Business | Guide to FTSE Sustainable Investment Data used in FTSE Indexes, 12 of 30
v1.1, June 20212.7 Calculation Step 4: Calculating Pillar Exposures and Pillar Scores
Once the Theme Exposures and Theme Scores are calculated it is possible to calculate the Pillar
Exposures and Pillar Scores.
2.7.1 Pillar Exposure
Pillar Exposure is calculated as a weighted average of the applicable Theme Exposures; Themes
that are “High Exposure” have a weight of 3, “Medium Exposure” have a weight of 2, and “Low
Exposure” have a weight of 1.
Case Study Example Company X: Pillar Exposure
Environmental Pillar Exposure (ECC Exp 2) + (EWT Exp 2) + (EBD Exp 0) + (EPR Exp 3) + (ESC Exp 3) 2.5
(Number of applicable Environmental Themes 4)
Social (SHS Exp 2) + (SLS Exp 3) + (SHR Exp 2) + (SCR Exp 0) + (SSC Exp 3) 2.5
Pillar Exposure (Number of applicable Social Themes 4)
Governance Pillar Exposure (GAC Exp 3) + (GCG Exp 2) + (GRM Exp 3) + (GTX Exp 2) 2.5
(Number of applicable Governance Themes 4)
NB: For Company X the Pillar Exposures happen to be equal as a result of the calculation.
2.7.2 Pillar Scores
Pillar Scores are calculated as Exposure weighted averages of the Theme Scores such that the
higher Exposure Themes for a particular company have a greater weight. This results in Pillar
Scores of 0-5 to one decimal place.
2.7.3 Pillar Supersector Relative Scores
The Pillar Supersector Relative Score is then calculated in deciles (1-10) where 1 equates to the
bottom decile of the ESG Ratings within the Supersector, and 10 equates to the top decile.
FTSE Russell An LSEG Business | Guide to FTSE Sustainable Investment Data used in FTSE Indexes, 13 of 30
v1.1, June 2021Case Study Example Company X: Pillar Score
(ECC Score 4)(ECC Exp 2) + (EWT Score 4)(EWT Exp 2) + (EBD Score 0)(EBD Exp 0) +
Environmental (EPR Score 3)(EPR Exp 3) + (ESC Score 2)(ESC Exp 3) 3.1
Pillar Score
(ECC Exp 2) + (EWT Exp 2) + (EBD Exp 0) + (EPR Exp 3) + (ESC Exp 3)
(SHS Score 2)(SHS Exp 2) + (SLS Score 1)(SLS Exp 3) + (SHR Score 2)(SHR Exp 3) +
Social (SCR Score 0)(SCR Exp 0) + (SSC Score 3)(SSC Exp 3) 2.2
Pillar Score
(SHS Exp 2) + (SLS Exp 3) + (SHR Exp 3) + (SCR Exp 0) + (SSC Exp 3)
(GAC Score 2)(GAC Exp 3) + (GCG Score 5) (GCG Exp 2) +
Governance (GRM Score 2)(GRM Exp 3) + (GTX Score 1) (GTX Exp 2) 2.4
Pillar Score
(GAC Exp 3) + (GCG Exp 2)+ (GRM Exp 3) + (GTX Exp 2)
2.8 Calculation Step 5: Calculating the Overall Rating
ESG Ratings: The overall ESG Rating is calculated as an Exposure-weighted average of the Pillar
Scores. These are calculated to one decimal place.
ESG Rating Supersector Relative Score: The ESG Rating Supersector Relative Score is then
identified as a percentile, where “1” indicates that a company is in the bottom 1% and “100” indicates
a company is in the top 1%.
Case Study Example Company X
(Env Exp 2.5)(Env Score 3.1) + (Soc Exp 2.5)(Soc Score 2.2) +
(Gov Exp 2.5)(Gov Score 2.4) 2.6
(Env Exp 2.5) + (Soc Exp 2.5) + (Gov Exp 2.5)
FTSE Russell An LSEG Business | Guide to FTSE Sustainable Investment Data used in FTSE Indexes, 14 of 30
v1.1, June 2021Section 3
ESG Data Sources
3.0 ESG Data Sources
3.1 The following is a list of data sources used in the construction of the FTSE ESG Ratings and
underlying data.
Source (abbreviation) Source Organisation Source Report/Article Name Main
Pillar /
Theme
Action Aid Action Aid Tax Responsibility and Investor Guide GTX
ATMI ATMI Access to Medicine Index SCR
ATNI ATNI Access To Nutrition Index SCR
B-BBEE South African Government Broad-Based Black Economic Empowerment SLS
BBEnv Bloomberg Environmental data fields EPR
BBRC Business & Biodiversity Resource Business & Biodiversity Resource Centre EBD
Centre Supporting External Initiatives
BITC Business In The Community Five Key Principles of Community Investment SHR
BITC Mkt Resp Business In The Community Marketplace Responsibility Principles SCR
BREEAM Buildings Research Establishment BREEAM International New Construction ECC
Manual
CBD Convention on Biological Diversity [International] Convention on Biological EBD
Diversity
CDP CDP CDP Information Request Reporting Guidance ECC
CDPWater CDP Research CDP Global Water Report 2018 EWT
CERESWater CERES Murky Waters? Corporate Reporting on Water EWT
Risk
CFA (Consumer Finance Consumer Finance Association Consumer Finance Association: Lending Code SCR
Association) for Small Cash Advances
FTSE Russell An LSEG Business | Guide to FTSE Sustainable Investment Data used in FTSE Indexes, 15 of 30
v1.1, June 2021Source (abbreviation) Source Organisation Source Report/Article Name Main
Pillar /
Theme
Children's Rights BP Unicef, Global Compact, Save the Children's Rights and Business Principles SHR
Children
CHRB Corporate Human Rights Benchmark 2019 Methodology for the Agricultural Products, SHR
Apparel and Extractive industries
Christian Aid Christian Aid Tax and Sustainability: A framework for GTX
businesses
and socially responsible investors
Cranfield Cranfield University Collaboration in the Supply Chain SSC
DB Beyond Numbers Deutsche Bank Beyond the Numbers - Corporate Governance: GCG
Implication for Investors
DEFRA Green Claims Dept of Environment, Food and Rural Green Claims Guidance SCR
Affairs
EC-HR-Article 10 European Convention European Convention on Human Rights - SHR
Article 10
Equator Principles Equator Principles Financial The Equator Principles III June 2013 SSC, SCR
Institutions
ETI Ethical Trading Initiative ETI Base Code SSC, ESC
EU European Union Emissions Standards ECC
FRC CG Financial Reporting Council The UK Corporate Governance Code GCG
GRI Global Reporting Initiative G4 Sustainability Reporting Guidelines E/S/G
GRI FS Global Reporting Initiative G4 Sector Disclosures : Financial Services E/S/G
GRI Global Reporting Initiative G4 Sustainability Reporting Guidelines SHR
HM 42 HM Revenue & Customs ERSM 140070 Reporting Requirements Form GCG
42
HSE - risks Health & Safety Executive Health & Safety Made Simple: Risk assessment SHS
(web-site)
HSE benchmarking tool Health & Safety Executive Health & Safety Benchmarking - Improving SHS
Together
HSE polity template Health & Safety Executive HSE Prepare a health and safety policy SHS
IAEA International Atomic and Energy Environmental impact assessment for uranium SHS
Agency mine, mill and in-situ leach projects
IBE Institute of Business Ethics Communicating Ethical Standards SLS
ICGN International Corporate Governance ICGN Global Stewardship Principles GCG
Network
FTSE Russell An LSEG Business | Guide to FTSE Sustainable Investment Data used in FTSE Indexes, 16 of 30
v1.1, June 2021Source (abbreviation) Source Organisation Source Report/Article Name Main
Pillar /
Theme
ICMM International Council on Mining and ICMM Sustainable Development Framework 10 EBD
Metals Principles
IFC International Finance Corporation The Risk Management Balancing Act GCG
IIA The Institute of Internal Auditors The Three Lines of Defense in Effective Risk GRM
Management and Control
ILO C100 International Labour Organisation ILO Equal Remuneration Convention SLS
ILO C105 International Labour Organisation ILO Abolition of Forced Labor Convention SLS
ILO C107 International Labour Organisation ILO Indigenous and Tribal Populations SHR
Convention 1957
ILO C111 International Labour Organisation ILO Convention concerning Discrimination in SLS
Respect of Employment and Occupation
ILO C131 International Labour Organisation ILO Minimum Wage Convention SLS
ILO C138 International Labour Organisation ILO Minimum Age Convention SLS
ILO C169 International Labour Organisation ILO Indigenous and Tribal Populations SHR
Convention 1991
ILO C173 International Labour Organisation ILO Protection of Worker's Claims (Employer's SLS
Insolvency) Convention
ILO C182 International Labour Organisation Worst Forms of Child Labor SLS
ILO C29 International Labour Organisation ILO Forced Labor Convention SLS
ILO C30 International Labour Organisation ILO Hours of Work Convention SLS
ILO C87 International Labour Organisation ILO Freedom of Association and Protection of SLS
the Right to Organise Convention
ILO C94 International Labour Organisation ILO Labor Clauses (Public Contracts) SLS
Convention
ILO C95 International Labour Organisation ILO Protection of Wages Convention SLS
ILO C98 International Labour Organisation ILO Right to Organise and Collective SLS
Bargaining Convention
ILO-OSH 2001 International Labour Organisation ILO-OSH 2001 Guidelines on Occupational SHS
Safety and Health Management Systems
IoD and HSE Institute of Directors and the Health IoD and HSE Leading Health and Safety at SHS
and Safety Executive Work
IOSCO International Organization of IOSCO Principles for Auditor Oversight GCG
Securities Regulators (“IOSCO”)
FTSE Russell An LSEG Business | Guide to FTSE Sustainable Investment Data used in FTSE Indexes, 17 of 30
v1.1, June 2021Source (abbreviation) Source Organisation Source Report/Article Name Main
Pillar /
Theme
IPIECA KPIs IPIECA the global oil and gas Section 5. Health & Safety Indicators SHS
industry association for
environmental and social issues
IRM Institute of Risk Management Risk Management Standard GRM
ISO 14001 International Organisation for Environmental Management Systems EPR
Standardisation
ISO 26000 International Organisation for International Standard: Guidance on Social E/S/G
Standardisation Responsibility
LBG Making a Difference London Benchmarking Group Making a Difference: Corporate Community SHR
Investment: a whole programme approach to
measuring results
Nat Step Natural Step Canada Towards a Gold-Standard Benchmark for a EPR
Sustainable Business
Natural Value Natural Value Initiative NVI Toolkit - Ecosystem Services Benchmark EBD
VI (excel)
OECD CG OECD OECD Principles of Corporate Governance GCG
OSHAS 18001 British Standards Institute Occupational health and safety management SHS
systems. Requirements
PRI UNEP FI (United Nations Principles for Responsible Investment: The Six SSC
Environment Program for Financial Principles
Institutions)
PRI-Integ-Analysis Principles for Responsible Investment Integrated Analysis: How Investors are SSC
Addressing Environmental, Social and
Governance Factors in Fundamental Equity
Valuation
PRI Principles for Responsible Investment Engagement Guidance on Corporate Tax GTX
Responsibility
PSI UNEP FI (United Nations Principles for Sustainable Insurance SSC
Environment Program for Financial
Institutions
Salz Salz Review Salz Review: An Independent Review of GCG
Barclays Business Practices
SASB Sustainability Accounting Standards SASB Standards SHR
Board
SEC Securities Exchange Commission SEC Rules for Reserves Reporting ECG
FTSE Russell An LSEG Business | Guide to FTSE Sustainable Investment Data used in FTSE Indexes, 18 of 30
v1.1, June 2021Source (abbreviation) Source Organisation Source Report/Article Name Main
Pillar /
Theme
SEDEX SEDEX SEDEX Supplier Workbook SSC
Soc Gen Societe Generale SRI: Beyond Integration, research note E/S/G
SSEI UN Sustainable Stock Exchange 2016 SSE Report on Progress Overview SSC
Initiative
Stoxx/Dr Axel Dr. Axel Hesse for SD-KPI Standard 2010 – 2014 E/S/G
German Federal Env Ministry
TEEB TEEB The Economics of Ecosystems Mainstreaming the Economics of Nature EBD
& Biodiversity
TI Transparency International Business Principles for Countering Bribery GAC
UN Code Enforcement United Nations UN Code of Conduct for Law Enforcement SHR
Officials
UN Force & Firearms United Nations UN Basic Principles on the Use of Force and SHR
Firearms
UN OHCR GP United Nations High Commission for United Nations High Commission for Human SHR
Human Rights Rights Guiding Principles
UNDR Indigenous United Nations United Nations Declaration of the Rights of SHR
Indigenous Peoples
UNEP FI HR Toolkit UNEP FI (United Nations Human Rights Guidance Tool for the Financial SHR
Environment Program for Financial Sector
Institutions
UNEP-Translating UNEP FI (United Nations Translating ESG into Sustainable Business EBD
Environment Program for Financial Value UNEP FI and WBCSD
Institutions
UNGC UN Global Compact UN Global Compact Principle 10 GAC
UNGP UN Guiding Principles UN Guiding Principles Reporting Framework SHR
World Bank World Bank Towards Sustainable Decommissioning and SHR
Closure of Oil Fields and Mines: A Toolkit to
Assist Government Agencies
FTSE Russell An LSEG Business | Guide to FTSE Sustainable Investment Data used in FTSE Indexes, 19 of 30
v1.1, June 2021Section 4
FTSE ESG Ratings Quality Control
4.0 FTSE ESG Ratings Quality Control
To construct the FTSE ESG Dataset, FTSE Russell analysts collect publicly available data from
sources including corporate reports, websites and press releases.
Throughout the data collection and calculation process FTSE Russell applies several layers of
quality control to ensure data accuracy. These checks are applied at the company level and at the
overall dataset level.
At the company level, a combination of automated checks, senior analyst review and key indicator
checks are applied.
At the dataset level further automated checks are applied, supplemented by the analysis of trends
and targeted review by senior analysts.
Additionally, companies are offered the opportunity to provide feedback on the data sources
captured, to ensure that the most suitable have been used; this feedback is reviewed by analysts
and incorporated into the assessment where relevant.
FTSE Russell An LSEG Business | Guide to FTSE Sustainable Investment Data used in FTSE Indexes, 20 of 30
v1.1, June 2021Section 5
Transition Pathway Initiative Management
Quality Score
5.0 Transition Pathway Initiative Management Quality Score
5.1 FTSE Russell uses the methodology developed by the Grantham Institute at the London School of
Economics to calculate Management Quality (MQ) Scores used by the Transition Pathway Initiative
(TPI).
5.1.1 These scores use datapoints incorporated within the ESG Ratings Model and as such the same
quality control processes apply in their calculation.
5.2 Further information regarding the construction of the TPI MQ Scores can be found here:
https://www.transitionpathwayinitiative.org/
FTSE Russell An LSEG Business | Guide to FTSE Sustainable Investment Data used in FTSE Indexes, 21 of 30
v1.1, June 2021Section 6
Green Revenues
6.0 The FTSE Green Revenues Data Model
6.1 The FTSE Green Revenues data model helps investors understand the global industrial transition to
a green and low carbon economy with consistent, transparent data and indexes.
Companies are analyzed and categorized using the unique Green Revenues Classification System
(GRCS) on green products and services that covers 10 sectors, 64 subsectors and 133 micro
sectors. The tiering system under the GRCS identifies the level of “greenness”, or net environmental
benefits of companies’ business activities and revenues. Each micro sector is allocated to a tier (tier
1, 2 or 3) based on its overall environmental impacts.
For each company with green products or services identified, the Model provides data points on
company green revenue percentages (including minimum, maximum and point estimate) and micro
sector green revenue percentages for each green product or service offered by the company.
The FTSE Green Revenues data model does not currently utilize international standards in its
construction but can be used to determine the degree to which companies are exposed to
sustainable activities.
6.2 FTSE Green Revenues Dataset Construction
Information is collected from publicly available reports by FTSE Russell analysts. Companies are
also invited to provide more detailed information where the subsegmental revenue breakdown in
their annual reports is not granular enough to facilitate the assessment of green revenues.
6.3 FTSE Green Revenues Ratio Construction
The FTSE Green Revenues ratio for a company is:
The ratio of green revenues as classified by the FTSE Green Revenues Classification
System to total revenue;
Where an index utilizes a variant of the Green Revenues ratio in their construction, this will
be described in that Index’s Ground Rules. In general, green revenues from Tier 3 micro
sectors are excluded for index construction.
All constituent securities are assigned an FTSE Green Revenues ratio value. The FTSE Green
Revenues ratio can be:
Zero if a constituent company has no exposure to the Green Economy;
FTSE Russell An LSEG Business | Guide to FTSE Sustainable Investment Data used in FTSE Indexes, 22 of 30
v1.1, June 2021A non-zero value, when exact Green Revenues were disclosed by a constituent company;
The minimum of the stated range of possible Green Revenues, when a company discloses
insufficient information for a precise determination of the FTSE Green Revenues ratio;
The company-specific estimate or sector-specific estimate of the Green Revenues, when a
company discloses insufficient information for a precise determination of the FTSE Green
Revenues ratio and estimation methodology is used to produce a point estimate for the
company
6.4 Collection Method and Delivery
6.4.1 The data is collected by an analyst who will typically manually extract (e.g. copy and paste) the
wording from the data source and apply tags.
6.5 Quality Measures
6.6 Quality measures occur in four stages
A. Stage 1 Analyst Level Quality Controls - an automated quality check using rules in the system
that immediately can be used by the analyst on the data entry screen.
B. Stage 2 Advanced Quality Controls (conducted during research cycle) - more experienced
quality control analyst carries out a further review which includes checking for accuracy of data
assessed, and consistency in comparison with companies in the same ICB subsector; this
check can also include checks on previous stage 1 checks undertaken.
C. Stage 3 Company Review of research - all companies are contacted and given the opportunity
to comment on the accuracy and completeness of the company’s data. Where companies
identify pertinent information (i.e. information relevant to its assessment), such as revenues or
product-specific attributes which was not included in the assessment, then the analyst
incorporates the applicable company changes and the assessment is updated. FTSE contact
every company and allow them to respond within a four-week timeframe.
D. Stage 4 FTSE Quality Monitoring of research (conducted bi-annually during research cycle)-
FTSE Russell Sustainability experts conduct quality monitoring checks on quantitative data
consistency regarding units, green activity and or revenue gaps, outliers and peer
comparisons.
E. All data is looked over, defended or remedied before being delivered for market consumption.
6.7 FTSE Green Revenues and International Standards
The FTSE Green Revenues Data Model measures the “greenness” of products based on product-
based international standards that align to each of the micro sector and subsector classifications.
6.7.1 Certifications are considered if the certification is issued by an independent third party and the
environmental performance of the product is better than incumbent products’ efforts to adapt,
mitigate and/or remediate: environmental erosion, resource depletion and/or climate change.
FTSE Russell An LSEG Business | Guide to FTSE Sustainable Investment Data used in FTSE Indexes, 23 of 30
v1.1, June 20216.7.2 These standards include, but are not limited to:
• LEED (full suite) • BOMA 360
• BREEAM • BOMA BEST
• EnergyStar • CASBEE
• RSPO • DGNB
• Marine Stewardship Council • GPR Gebouw
• Forest Stewardship Council • Green Globes
• Organic • Green Mark
• FairTrade • Green Star
• Life Cycle Assessment • Green Star NZ
• Sustainable Forestry Initiative • Green Star SA
• EcoLabel • HQE
• Green Seal • Miljöbyggnad
• Nuclear Grade Certifications • SKA Rating
(i.e. ASME, QSC-597, QSD-665)
FTSE Russell An LSEG Business | Guide to FTSE Sustainable Investment Data used in FTSE Indexes, 24 of 30
v1.1, June 2021Section 7
Carbon Reserves
7.0 The FTSE Carbon Reserves Data Model
7.1 The FTSE Global Carbon Reserves data model provides granular coverage of fossil fuel reserve
ownership among publicly listed companies in developed markets and emerging economies. High
levels of reserves and associated future emissions indicate potential ‘stranded assets’ on the
balance sheets of fossil fuel companies, a key component of climate transition risk.
The dataset includes not only company-level data of oil, gas, and coal reserves, but also projections
of potential GHG emissions released, if these reserves are extracted and combusted. Fossil fuel
potential emissions are calculated by applying standardized emissions factors to each reserve type
to adjust for non-energy uses of reserves, to capture carbon emissions from combustion, and to
calculate additional operation emissions, such as from leakage and flaring.
The primary goal is to capture companies that own a majority stake in fossil fuel reserves. Only
those reserves in which the company owns at least a 50% stake are captured.
7.2 FTSE Carbon Reserves Dataset Construction
Information is collected from publicly available reports by FTSE Russell analysts. The collection
methodology captures both Proved (1P) and Proved and Probable (2P) reserves, which reflect the
probability of economic extraction. Revenues, production and sales figures, and reserves quantities
are captured with no minimum threshold. The raw data can be utilized to create custom and flexible
models to suit individual needs.
7.3 Collection Method and Delivery
The data is collected by an analyst who will typically manually extract (e.g. copy and paste) the
wording from the data source and apply tags. This process usually takes roughly 5 hours for each
company depending on the type of data that is being reviewed, and 1 year for the universe of
companies on which data is being collected.
7.4 Quality Measures
To ensure data quality new assessments are reviewed by senior analysts and automated checks are
applied.
FTSE Russell An LSEG Business | Guide to FTSE Sustainable Investment Data used in FTSE Indexes, 25 of 30
v1.1, June 20217.5 Quality measures occur in three stages
A. Stage 1 Analyst Level Quality Controls - an automated quality check using rules in the system
that immediately can be used by the analyst on the data entry screen.
B. Stage 2 Advanced Quality Controls (conducted during research cycle) - more experienced
quality control analyst carries out a further review which includes checking for accuracy of data
assessed, and consistency in comparison with companies in the same subsector; this check
can also include checks on previous stage 1 checks undertaken.
C. Stage 3 FTSE Quality Monitoring of research (conducted bi-annually during research cycle)-
FTSE Russell Sustainability experts conduct quality monitoring checks on quantitative data
consistency regarding units, green activity and or revenue gaps, outliers and peer
comparisons.
D. All data is looked over, defended or remedied before being delivered for market consumption.
7.6 FTSE Carbon Reserves and International Standards
The FTSE Carbon Reserves model does not make use of any international standards.
FTSE Russell An LSEG Business | Guide to FTSE Sustainable Investment Data used in FTSE Indexes, 26 of 30
v1.1, June 2021Section 8
Carbon Emissions
8.0 The FTSE Carbon Emissions Data Model
8.1 FTSE Carbon Emissions Dataset Construction
The FTSE Carbon Emissions Data model provides reported and estimated Scope 1 and Scope 2
emissions data on the assets and activities controlled by global publicly listed companies. High
levels of emissions relative to revenues for a specific industry reflect carbon intensive processes or
an overreliance on fossil fuels. This indicates that a company’s assets could be rendered obsolete or
are simply unattractive to investors seeking to incorporate a rapid decarbonization pathway into their
investment portfolio.
Coverage extends from 2012 through present day, with reported emissions data covering the
majority of global market capitalization as represented by the FTSE Global All Cap with estimated
and extrapolated data filling in lacks in company level disclosure.
8.2 FTSE Carbon Emissions Dataset Construction
Disclosed corporate carbon emissions data is collected from publicly available reports by FTSE
Russell analysts. Additional Scope 1 and Scope 2 carbon emissions data from CDP (Carbon
Disclosure Project) is also used in the dataset construction.
8.3 FTSE Carbon Emissions Dataset Construction
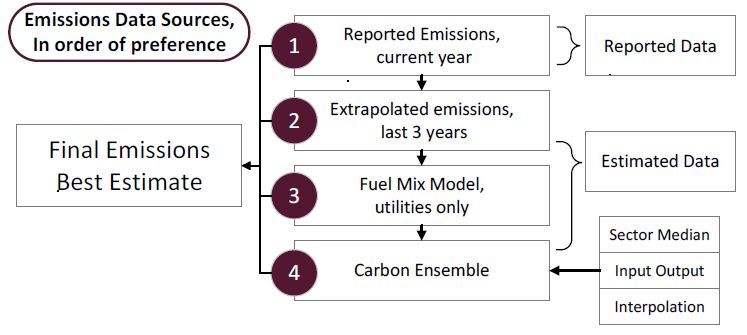
To fill in the gaps left by reported data, we have designed a hierarchical framework which estimates
emissions if disclosed data is unavailable. The source of the emissions estimation is an ensemble
median of three estimation models:
Sector Median
• Assigns each company to a single sector and region. Takes the median carbon intensity of all
the companies reporting carbon emissions for each sector. If enough companies disclose, our
implementation utilizes a higher resolution (e.g. Waste Management companies in North
America).
Input Output (IO)
• Uses Environmentally Extended Input Output Models to determine the carbon intensity of
multiple economic activities a company is involved in. Offers an economy-wide perspective
FTSE Russell An LSEG Business | Guide to FTSE Sustainable Investment Data used in FTSE Indexes, 27 of 30
v1.1, June 2021accounting for production flows within and between sectors and countries, independent of
disclosed emissions. Generates more nuanced estimates of carbon emissions for complex
firms with multiple business lines.
Inverse Distance Weight Interpolation (IDWI)
• Estimates carbon intensity for each economic activity based on all the companies reporting
carbon emissions for each activity, with a weighting towards pure play companies. This
approach uses company-level emissions disclosures to estimate the emissions intensity on an
activity level. Since a typical company is involved in multiple activities, companies which
specialize in a single activity represent the best estimate of that activity’s carbon intensity.
Since each strategy has well-documented biases and sources of volatility, we have elected to use an
ensemble estimate as our best substitute for disclosed emissions.
Carbon Estimation Median
• Scope 1 and Scope 2 emissions estimates are calculated through the median of the Sector
Median, Inverse Distance Weight Interpolation and Input/Output estimates, for any given year
of interest.
The multimodel estimation strategy is supplemented with two other estimation techniques in limited
situations.
Energy
• Estimates carbon emissions based reported power generation by fuel type (coal, gas, solar
etc.) for power utilities.
Extrapolation
• Fills discrete missing data points where a company has reported carbon emissions for earlier
years.
Hierarchical Model
8.4 Collection Method and Delivery
The data is collected by an analyst who manually extract data from the data source and apply tags.
FTSE Russell An LSEG Business | Guide to FTSE Sustainable Investment Data used in FTSE Indexes, 28 of 30
v1.1, June 20218.5 Quality Measures
FTSE Russell applies several layers of quality control throughout the data collection and calculation
process to ensure data accuracy. These checks are aligned to other FTSE Russell data models and
are in four stages:
A. Stage 1 Analyst Level Quality Controls - an automated quality check using rules in the system
that immediately can be used by the analyst on the data entry screen.
B. Stage 2 Advanced Quality Controls (conducted during research cycle) - more experienced
quality control analyst carries out a further review which includes checking for accuracy of data
assessed, and consistency in comparison with companies in the same ICB subsector; this
check can also include checks on previous stage 1 checks undertaken.
C. Stage 3 Company Review of research - all companies are contacted and given the opportunity
to comment on the accuracy and completeness of the company’s data. Where companies
identify pertinent information (i.e. information relevant to its assessment), such as revenues or
product-specific attributes which was not included in the assessment, then the analyst
incorporates the applicable company changes and the assessment is updated. FTSE contact
every company and allow them to respond within a four-week timeframe.
D. Stage 4 FTSE Quality Monitoring of research (conducted bi-annually during research cycle)-
FTSE Russell Sustainability experts conduct quality monitoring checks on quantitative data
consistency regarding units, green activity and or revenue gaps, outliers and peer
comparisons.
To control for extreme numbers while training carbon estimation models, outliers are automatically
truncated at a percentile cut off carbon intensity, relative to each ICB Supersector.
8.6 FTSE Carbon Emissions and International Standards
The FTSE Carbon Emissions model does not make use of any international standards
FTSE Russell An LSEG Business | Guide to FTSE Sustainable Investment Data used in FTSE Indexes, 29 of 30
v1.1, June 2021Appendix A: Further Information A Glossary of Terms used in FTSE Russell’s Ground Rule documents can be found using the following link: Glossary.pdf For contact details please visit the FTSE Russell website or contact FTSE Russell client services at info@ftserussell.com. Website: www.ftserussell.com © 2021 London Stock Exchange Group plc and its applicable group undertakings (the “LSE Group”). The LSE Group includes (1) FTSE International Limited (“FTSE”), (2) Frank Russell Company (“Russell”), (3) FTSE Global Debt Capital Markets Inc. and FTSE Global Debt Capital Markets Limited (together, “FTSE Canada”), (4) MTSNext Limited (“MTSNext”), (5) Mergent, Inc. (“Mergent”), (6) FTSE Fixed Income LLC (“FTSE FI”), (7) The Yield Book Inc (“YB”) and (8) Beyond Ratings S.A.S. (“BR”). All rights reserved. FTSE International Limited is authorised and regulated by the Financial Conduct Authority as a benchmark administrator. FTSE Russell® is a trading name of FTSE, Russell, FTSE Canada, MTSNext, Mergent, FTSE FI, YB and BR. “FTSE®”, “Russell®”, “FTSE Russell®” “MTS®”, “FTSE4Good®”, “ICB®”, “Mergent®”, “The Yield Book®”, “Beyond Ratings®” and all other trademarks and service marks used herein (whether registered or unregistered) are trade marks and/or service marks owned or licensed by the applicable member of the LSE Group or their respective licensors and are owned, or used under licence, by FTSE, Russell, MTSNext, or FTSE Canada, Mergent, FTSE FI, YB or BR. All information is provided for information purposes only. Every effort is made to ensure that all information given in this publication is accurate, but no responsibility or liability can be accepted by any member of the LSE Group nor their respective directors, officers, employees, partners or licensors for any errors or for any loss from use of this publication or any of the information or data contained herein. No member of the LSE Group nor their respective directors, officers, employees, partners or licensors provide investment advice and nothing in this document should be taken as constituting financial or investment advice. No member of the LSE Group nor their respective directors, officers, employees, partners or licensors make any representation regarding the advisability of investing in any asset. A decision to invest in any such asset should not be made in reliance on any information herein. Indexes cannot be invested in directly. Inclusion of an asset in an index is not a recommendation to buy, sell or hold that asset. The general information contained in this publication should not be acted upon without obtaining specific legal, tax, and investment advice from a licensed professional. No part of this information may be reproduced, stored in a retrieval system or transmitted in any form or by any means, electronic, mechanical, photocopying, recording or otherwise, without prior written permission of the applicable member of the LSE Group. Use and distribution of the LSE Group index data and the use of their data to create financial products require a licence with FTSE, Russell, FTSE Canada, MTSNext, Mergent, FTSE FI, YB, BR and/or their respective licensors. FTSE Russell An LSEG Business | Guide to FTSE Sustainable Investment Data used in FTSE Indexes, 30 of 30 v1.1, June 2021
You can also read