Astro2020 Science White Paper Tracing the formation history of galaxy clusters into the epoch of reionization
←
→
Page content transcription
If your browser does not render page correctly, please read the page content below
Astro2020 Science White Paper
Tracing the formation history of galaxy
clusters into the epoch of reionization
Thematic Areas:                 Galaxy Evolution  Cosmology and Fundamental Physics

Principal Author:
Name: Roderik Overzier1,2 and Nobunari Kashikawa3

Institution:
1
  Observatório Nacional, Rua José Cristino, 77. CEP 20921-400, São Cristóvão, Rio de
Janeiro-RJ, Brazil.
2
  Institute of Astronomy, Geophysics and Atmospheric Sciences, University of São Paulo, São
Paulo-SP, Brazil.
3
  Department of Astronomy, Graduate School of Science, The University of Tokyo, 7-3-1 Hongo,
Bunkyo, Tokyo 113-0033, Japan
Email: roderikoverzier@gmail.com and n.kashikawa@astron.s.u-tokyo.ac.jp

Abstract: The large-scale overdensities of galaxies at z ' 2 − 7 known as “protoclusters” are
believed to be the sites of cluster formation, and deep, wide survey projects such as the Large
Synoptic Survey Telescope (LSST) and the Wide Field Infrared Survey Telescope (WFIRST)
will deliver significant numbers of these interesting structures. Spectroscopic confirmation
and interpretation of these targets, however, is still challenging, and will require wide-field
multi-plexed spectroscopy on >20 m-class telescopes in the optical and near-infrared. In the
coming decade, detailed studies of protoclusters will enable us, for the first time, to systemat-
ically connect these cluster progenitors in the early universe to their virialized counterparts
at lower redshifts. This will allow us to address observationally the formation of brightest
cluster galaxies and other cluster galaxy populations, the buildup of the intra-cluster light,
the chemical enrichment history of the intra-cluster medium, and the formation and trig-
gering of supermassive black holes in dense environments, all of which are currently almost
exclusively approached either through the fossil record in clusters or through numerical sim-
ulations. Furthermore, at the highest redshifts (z ' 5 − 10), these large extended overden-
sities of star-forming galaxies are believed to have played an important role in the reioniza-
tion of the universe, which needs to be tested by upcoming experiments. Theory and recent
simulations also suggest important links between these overdensities and the formation of
supermassive black holes, but observational evidence is still lacking. In this white paper we
review our current understanding of this important phase of galaxy cluster history that will
be explored by the next generation of large aperture groundbased telescopes GMT and TMT.

                                               1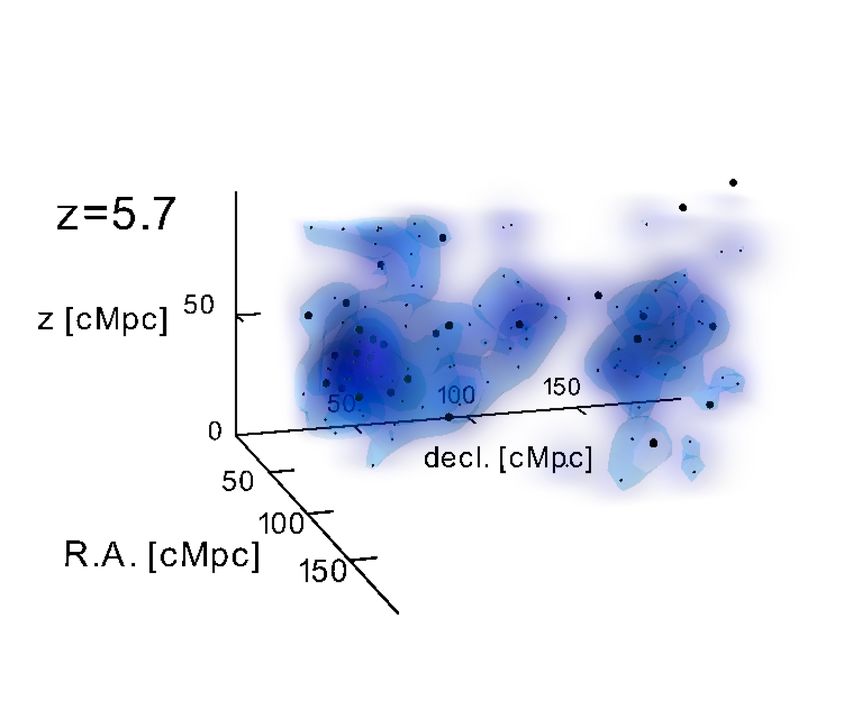
1    Introduction
The study of cluster formation, and the properties of galaxies as a function of environment in
general, is a largely unexplored area of research at high redshifts and a key science driver for many
new instruments and surveys. The period between cosmic dawn and cosmic noon, in particular,
was fundamental for the formation of massive galaxy clusters, a process about which still very little
is known from direct empirical evidence. Simulations show that cluster forming regions at z & 2
are characterized by large complexes of infalling dark matter halos with associated overdensities
of gas and galaxies that can offer important constraints on the various processes relevant to galaxy
clusters, including the infall of matter and galaxies along cosmic filaments, galaxy interactions
and mergers in dense regions, co-evolution of supermassive black holes and massive galaxies, the
build-up of the brightest cluster galaxy (BCG) and its intra-cluster light envelope, the roles of star
formation, outflows and quenching, and the origin and its metal enrichment of the intra-cluster
medium (ICM). Despite the enormous parameter space left to be explored, these dense regions in
the early universe are rare and still a challenge to study observationally (Overzier, 2016).
    Our current knowledge on the formation history of galaxy clusters mainly comes from two
areas of research. In principle, galaxy clusters in the local universe up to about cosmic noon contain
a detailed fossil record of their entire formation history. This information mainly comes in the form
of the properties of their galaxy populations (e.g., morphologies and stellar populations), properties
of the intra-cluster gas (e.g., temperature, luminosity and metal abundances) and the properties
of their dark matter (sub)structure (e.g., mass and density profile). However, interpretation of
this fossil record is not straightforward, as the massive galaxy population that dominates galaxy
clusters formed long before they became part of the cluster, and because the cluster virialization
process largely removes information about the initial conditions of structure before and during the
collapse. Therefore, we have mainly relied on cosmological numerical simulations that reproduce
the properties of clusters in observations as a way to understand and test our models of cluster
formation and evolution. While examples of massive, virialized or nearly virialized clusters have
been found up to z ≈ 2, these systems often show properties that are remarkably similar to those
of massive clusters at lower redshifts in a way that obfuscates their origin (e.g. Newman et al.,
2014; Brodwin et al., 2016). A complementary approach is to search for large-scale, pre-virialized
overdense regions in the distribution of galaxies or gas at high redshifts (often at z & 2) that
are good candidates of clusters-in-formation. These regions should be both sufficiently large and
overdense in order to make sure that they will collapse into a cluster-sized, virialized object by
the present-day. Such objects are now being found in relatively large numbers, which is providing
direct empirical evidence on the earlier phase during which the clusters and their galaxies were
actually forming.

2    A census of cluster formation: from butterfly collecting to
     evolutionary biology
After two decades of finding unique examples of cluster progenitors (“protoclusters”) rather spo-
radically through a variety of methods and at a wide range of redshifts (about ∼40 were known at
z ' 2 − 6 until recently), this area of research is reaching maturity. Deep, wide multi-wavelength
sky surveys are starting to reach both the necessary depth and areas large enough to detect statis-

                                                  2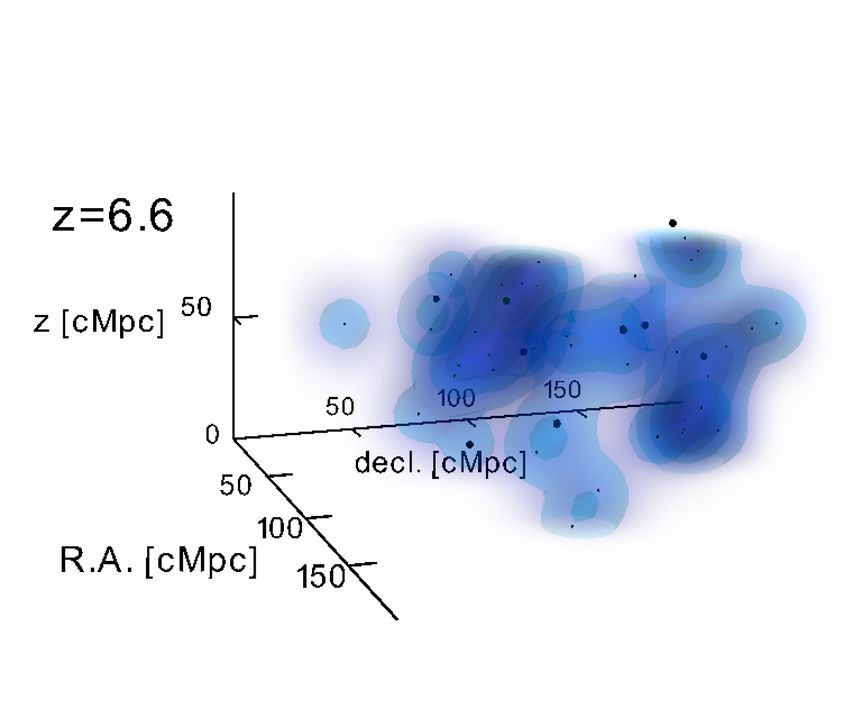
Figure 1: Overview of protoclusters found to date. Horizontal shaded regions show the ap-
proximate redshift ranges probed by the large numbers of (candidate) clusters and protoclus-
ters from the Clusters Around Radio Loud AGN (CARLA) project (Wylezalek et al., 2013),
the Planck-detected protocluster candidates (Planck Collaboration et al., 2015) and the HSC
selected protoclusters at z ∼ 4 (Toshikawa et al., 2018). Vertical shaded regions indicate the
approximate redshift ranges probed by the Lyα narrowbands of the HSC SSP at z ≈ 5.7
and z ≈ 6.6 (e.g. Higuchi et al., 2018; Harikane et al., 2019). Data on low redshift clusters
selected in X-ray, Planck and SPT was taken from Bleem et al. (2015). The vertical axis does
not contain any information.
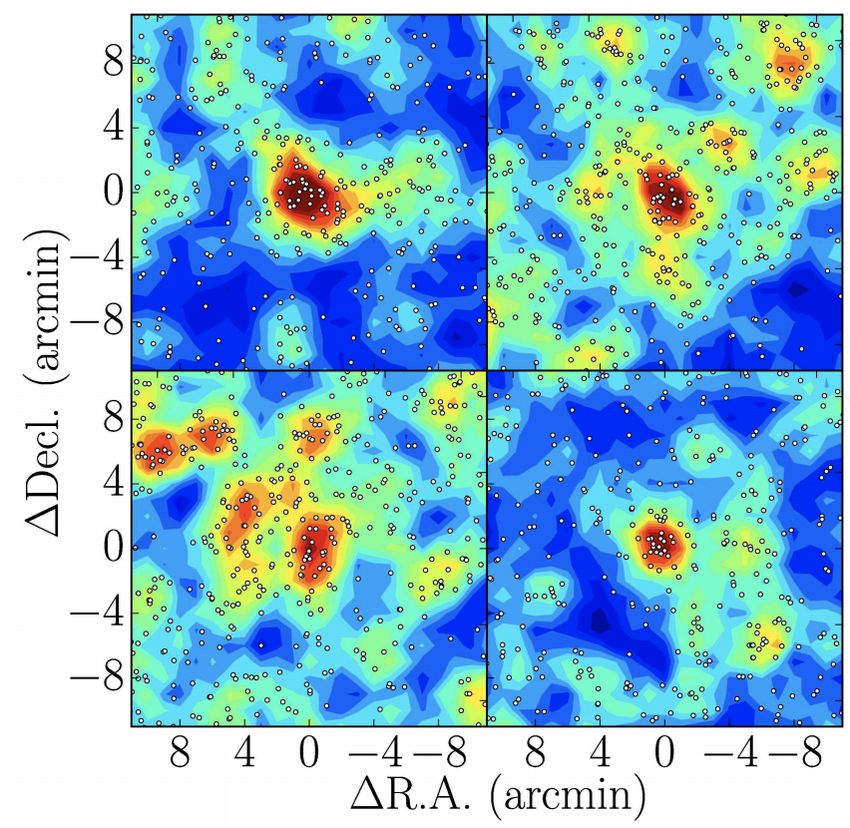
tical numbers of the rare protoclusters in a more uniform and systematic manner (see Figure 1).
Data from the HyperSuprimeCam (HSC) Subaru Systematic Program (SSP) was recently used to
select ∼ 200 protoclusters at z ∼ 3.8 based on high density peaks in the sky distribution of g-band
dropout galaxies (Figure 2; Toshikawa et al., 2018), exceeding the total number of protoclusters
known in this redshift range prior to this study by more than a factor of 10. HSC SSP narrow-band
filters sensitive to redshifted Lyα furthermore resulted in a large number of new candidate systems
at z ∼ 6, several of which were confirmed spectroscopically (Higuchi et al., 2018; Harikane et al.,
2019). Other sources of statistical samples of protoclusters are the Clusters Around Radio-Loud
AGN (CARLA) survey, which has shown that many powerful radio-loud AGN are surrounded by
galaxy excesses (Wylezalek et al., 2013), the Planck survey which has revealed a large number of
unresolved “cold” sources associated with large overdensities of dust-obscured star-forming galax-
ies at high redshift (Planck Collaboration et al., 2015), the VIMOS Ultra Deep Survey (VUDS)
which has found several bonafide protoclusters owing to its dense spectroscopic sampling of the
cosmic web (Cucciati et al., 2014, 2018; Lemaux et al., 2014, 2018). Other recent examples of
protoclusters include several systems identified as highly clustered regions of dusty star-forming
galaxies in data from the Herschel Space Observatory and the South Pole Telescope (e.g. Miller et
al., 2018; Gómez-Guijarro et al., 2019), and large protocluster systems detected in hydrogen gas
absorption studies (e.g. Lee et al., 2016; Cai et al., 2017; Hayashino et al., 2019). The data on all
these targets span a wide range in redshift and likely include progenitors of present-day clusters
with a range of cluster mass and evolutionary states. During the next decade, systematic multi-
wavelength followup of these systems and comparison with simulations will provide a detailed
picture of cluster formation from z = 0 to the epoch of reioniation (EoR).
3a b
z57OD
z66OD
Figure 2: Examples of recently discovered protoclusters at z ∼ 4 (panel (a); from Toshikawa
et al., 2018) and at z ∼ 6 − 7 (panel (b), from Harikane et al., 2019).
3 Protoclusters and the epoch of reionization
The epoch of reionization is a focus area of cosmology and galaxy evolution. Because the values
of the cosmological parameters together with structure formation set the growth rate of the first
stars and galaxies that ionized the intergalactic medium, studying the process of reionization is
analogous to studying the formation of the first structures. There is mounting evidence that proto-
clusters have played an important role in this process. Protoclusters represent significant density
fluctuations of dark matter, gas and galaxies up to very large scales (tens of Mpc; Chiang et al.,
2013). Because galaxy formation in these dense regions preceeded that in lower density regions
and because they contained higher densities of ionizing-photon producing objects per unit volume,
the contribution from protoclusters to the total ionizing-photon rate during the EoR may have been
substantial. Chiang et al. (2017) showed using simulations that at z ∼ 6 − 10, protocluster galaxies
are responsible for around 30–50 % of the cosmic star formation rate density even though they oc-
cupy only ∼6 % of the cosmic volume. Although the exact contribution from these objects to the
cosmic ionized fraction and the ionized bubble sizes around protoclusters as a function of redshift
remain to be determined, these numbers suggest that their contribution could be substantial.
Several examples of such objects have already been discovered at z ' 6 − 8 (e.g., see Figure
2; Ouchi et al., 2005; Trenti et al., 2012; Toshikawa et al., 2014; Ishigaki et al., 2016; Higuchi et
al., 2018; Jiang et al., 2018; Harikane et al., 2019). Recently, a large systematic survey of proto-
clusters in the EoR was performed by Higuchi et al. (2018), who selected several tens of candidate
structures at z = 5.7 and z = 6.6 based on overdensities of LAEs in data from the HSC SSP.
These structures could be used to study their impact on reionization in various ways. It is expected
that high density regions contain star-forming galaxies with larger-than-average equivalent widths
of Lyα because the escape of Lyα photons is facilitated by the large ionized bubbles around the
4protoclusters (Inoue et al., 2018; Higuchi et al., 2018). Likewise, the shape of the typical Lyα
profiles as a function of redshift and/or overdensity can be used to probe any changes in the IGM
opacity (e.g. Kashikawa et al., 2011). Because the Lyα emission is often offset with respect to the
systemic velocity of the galaxies, it is important to determine accurate redshifts based on the fainter
interstellar absorption lines in the rest-frame UV or strong nebular emission lines in the rest-frame
optical. Protoclusters can furthermore be used as highly efficient probes of the process of Lyman
continuum (LyC) leakage that is crucial to the EoR. Because protoclusters have high surface den-
sities of galaxies at a known redshift, a single pointing with a multi-plexed spectrograph will result
in multiple high signal-to-noise spectra that can be searched for LyC emission (e.g. Mostardi et al.,
2013). By studying the measured escape fractions as a function of the physical properties of the
galaxies, the physics that allowed LyC escape to occur can be probed (e.g. Borthakur et al., 2014).
By determining the star formation histories of galaxies in protoclusters directly after or during the
end of the EoR, it may even be possible to infer their contribution to the ionizing photon budget
at earlier times. The spatial distribution of galaxies in protoclusters combined with maps of the
neutral hydrogen distribution from the Square Kilometer Array (SKA) will determine the topology
of these structures during the EoR.
Finally, there may exist important links between the first overdense regions and the forma-
tion of supermassive black holes (SMBHs). During the past decade, many authors have searched
for structures of galaxies near luminous quasars at z & 5 with a wide range in outcomes (e.g.
Kashikawa et al., 2007; Overzier et al., 2009; Mazzucchelli et al., 2017; Balmaverde et al., 2017;
Champagne et al., 2018; Ota et al., 2018). The strongest evidence to date that suggests that quasars
at z & 6 are located in the densest regions of the cosmic web comes from models and simulations,
but the empirical evidence is still lacking. Recent simulations have suggested that the presence
of dense star-forming regions, such as protoclusters, may even be required in order to facilitate
the direct collapse of massive SMBH seeds during the EoR, in part through the enhanced Lyman-
Werner background generated by these dense regions (Wise et al., 2019). On the other hand, the
strong photoionization effects from luminous quasars may suppress gas cooling in surrounding
halos, which can be tested by comparing the luminosity functions of young star-forming objects in
their vicinity with those in the field (e.g. Uchiyama et al., 2019). There are thus strong additional
motivations to search in and around these dense regions for early SMBH activity, and vice versa.
The ongoing discovery and detailed study of dense protocluster regions on one hand and luminous
or massive galaxies and black holes in the EoR should be able to shed light on the relation between
SMBH formation and the densest regions in the early universe.
4 Open questions and recommendations
How the aforementioned protoclusters exactly relate to the galaxy clusters at lower redshifts still
remains an open question in most cases. Likewise, their contribution to the cosmic star forma-
tion rate and reionization needs to be determined through observations. Observations of galaxies
in galaxy clusters and theoretical models have demonstrated that galaxy evolution depends on, or
correlates with, the environment (e.g., De Lucia & Blaizot, 2007; Thomas et al., 2010; Behroozi
et al., 2013; Contini et al., 2016; Laigle et al., 2018). Most of the stars in massive cluster galaxies
formed long before cluster virialization, and especially BCGs may have formed nearly half of their
stars by z ∼ 5. Some authors have found differences in the stellar mass distributions, ages of the
5stellar populations and/or AGN fractions in protoclusters compared to the field (e.g., Steidel et al.,
2005; Cooke et al., 2014; Macuga et al., 2018). The overdense environments could also lead to
differences in the gas-phase metal abundances of the galaxies, for example due to the accretion
of gas that is metal-enhanced compared to lower density regions, more efficient stripping of gas
in dense environments, or dilution of metallicities due to efficient inflows of gas (e.g. Shimakawa
et al., 2015; Valentino et al., 2015; Overzier, 2016). Outflows from starburst galaxies during the
protocluster phase were important for the enrichment of the present-day ICM (Biffi et al., 2018).
Some protoclusters contain particularly massive central galaxies or dense concentrations of galax-
ies that are good candidates of proto-BCGs (e.g. Pentericci et al., 1997; Kubo et al., 2016; Miller
et al., 2018), but a clear picture of BCG assembly has yet to emerge. For massive clusters, many of
these important events took place at z & 2, making the protocluster phase in principle one of most
informative phases about cluster formation.
Current studies of protoclusters are hampered by at least three important factors: limited spec-
troscopic determinations of membership, limited multi-wavelength coverage, and small number
statistics. The combination of optical/near-infrared observations with the Giant Magellan Tele-
scope (GMT) and the Thirty Meter Telescope (GMT), mid-infrared observations with the James
Webb Space Telescopes (JWST), and the Atacama Large Millimeter Array (ALMA) will be par-
ticularly powerful to constrain the physical properties of protocluster galaxies and the mass and
dynamical states of selected systems. Protocluster galaxies, which are more strongly clustered
than field galaxies, are good targets for planned multi-object spectrographs on >20 meter class
telescopes as they can take full advantage of the multiplexity. The large collecting area of these
telescopes will furthermore increase the speed at which protocluster candidates can be confirmed,
increasing the sample size and allowing basic structural properties to be determined (e.g., redshift,
overdensity, velocity dispersion and mass). The main diagnostic features in the rest-frame UV
from the Lyman limit to [MgII]λλ2796,2803 fall in the observed optical/near-infrared for targets
between z ∼ 3 and z ∼ 7. The main optical emission lines up to the [SII]λλ6717,6731 doublet
will be accessible for protoclusters at z . 2.6, and the spectral range around the Balmer break
at z . 5. Combined with other multi-wavelength data, this will allow the measurement of stellar
populations, stellar mass and age, LyC and Lyα escape fractions, extinction, outflows, metallicity
and interstellar medium properties. Estimates for the velocity dispersions and current and final
masses of the protoclusters can then be used to place them on different evolutionary tracks appro-
priate for their mass scale (e.g., Chiang et al., 2013; Miller et al., 2018; Toshikawa et al., 2018).
This will allow us to compare the properties of their galaxies with those of their field counterparts
at the same redshift in order to study environmental trends or look for evidence of assembly bias.
Typical protoclusters measure several to about ten arcminutes in diameter (see Figure 2), mak-
ing them particularly convenient targets for medium-resolution optical multi-object spectrographs
such as GMACS (possibly extended to larger areas with MANIFEST) on the GMT and WFOS on
the TMT. These telescopes will also allow a dense sampling of the gas distribution associated with
protoclusters through cross-correlation with Lyα absorption features detected in the continuum
spectra of faint background galaxies. Diffraction-limited images and multi-object or integral field
spectroscopy of selected high density regions or particular individual objects in the near-infrared
can be studied with GMT (GMTIFS) and TMT (IRIS, IRMS and IRMOS). If any quasar activity
is present in or near protoclusters, virial masses of their SMBHs can be estimated from the MgII
line and the continuum flux at 3000 Å. The properties of Lyα will inform us about the ionization
state of the densest environments, which are believed to be major ionizing sources during the EoR.
6References
Balmaverde, B., Gilli, R., Mignoli, M., et al. 2017, A&A, 606, A23
Behroozi, P. S., Wechsler, R. H., & Conroy, C. 2013, ApJ, 770, 57
Biffi, V., Planelles, S., Borgani, S., et al. 2018, MNRAS, 476, 2689
Bleem, L. E., Stalder, B., de Haan, T., et al. 2015, ApJS, 216, 27
Borthakur, S., Heckman, T. M., Leitherer, C., & Overzier, R. A. 2014, Science, 346, 216
Brodwin, M., McDonald, M., Gonzalez, A. H., et al. 2016, ApJ, 817, 122
Cai, Z., Fan, X., Bian, F., et al. 2017, ApJ, 839, 131
Champagne, J. B., Decarli, R., Casey, C. M., et al. 2018, ApJ, 867, 153
Chiang, Y.-K., Overzier, R., & Gebhardt, K. 2013, ApJ, 779, 127
Chiang, Y.-K., Overzier, R. A., Gebhardt, K., & Henriques, B. 2017, ApJ, 844, L23
Contini, E., De Lucia, G., Hatch, N., Borgani, S., & Kang, X. 2016, MNRAS, 456, 1924
Cooke, E. A., Hatch, N. A., Muldrew, S. I., Rigby, E. E., Kurk, J. D. 2014, A&A, 570, A16
Cucciati, O., Zamorani, G., Lemaux, B. C., et al. 2014, A&A, 570, A16
Cucciati, O., Lemaux, B. C., Zamorani, G., et al. 2018, A&A, 619, A49
De Lucia, G., & Blaizot, J. 2007, MNRAS, 375, 2
Gómez-Guijarro, C., Riechers, D. A., Pavesi, R., et al. 2019, ApJ, 872, 117
Harikane, Y., Ouchi, M., Ono, Y., et al. 2019, arXiv:1902.09555
Hayashino, T., Inoue, A. K., Kousai, K., et al. 2019, MNRAS, 484, 5868
Higuchi, R., Ouchi, M., Ono, Y., et al. 2018, arXiv:1801.00531
Inoue, A. K., Hasegawa, K., Ishiyama, T., et al. 2018, PASJ, 70, 55
Ishigaki, M., Ouchi, M., & Harikane, Y. 2016, ApJ, 822, 5
Jiang, L., Wu, J., Bian, F., et al. 2018, Nature Astronomy, 2, 962
Kashikawa, N., Kitayama, T., Doi, M., et al. 2007, ApJ, 663, 765
Kashikawa, N., Shimasaku, K., Matsuda, Y., et al. 2011, ApJ, 734, 119
Kubo, M., Yamada, T., Ichikawa, T., et al. 2016, MNRAS, 455, 3333
Lee, K.-G., Hennawi, J. F., White, M., et al. 2016, ApJ, 817, 160
7Laigle, C., Pichon, C., Arnouts, S., et al. 2018, MNRAS, 474, 5437
Lemaux, B. C., Cucciati, O., Tasca, L. A. M., et al. 2014, A&A, 572, A41
Lemaux, B. C., Le Fèvre, O., Cucciati, O., et al. 2018, A&A, 615, A77
Macuga, M., Martini, P., Miller, E. D., et al. 2018, arXiv:1805.06569
Madau, P., & Dickinson, M. 2014, ARA&A, 52, 415
Mazzucchelli, C., Bañados, E., Decarli, R., et al. 2017, ApJ, 834, 83
Miller, T. B., Chapman, S. C., Aravena, M., et al. 2018, Nature, 556, 469
Mostardi, R. E., Shapley, A. E., Nestor, D. B., et al. 2013, ApJ, 779, 65
Newman, A. B., Ellis, R. S., Andreon, S., et al. 2014, ApJ, 788, 51
Ota, K., Venemans, B. P., Taniguchi, Y., et al. 2018, ApJ, 856, 109
Ouchi, M., Shimasaku, K., Akiyama, M., et al. 2005, ApJ, 620, L1
Overzier, R. A., Guo, Q., Kauffmann, G., et al. 2009, MNRAS, 394, 577
Overzier, R. A. 2016, A&A Rev., 24, 14
Pentericci, L., Roettgering, H. J. A., Miley, G. K., Carilli, C. L., & McCarthy, P. 1997, A&A, 326,
580
Planck Collaboration, Aghanim, N., Altieri, B., et al. 2015, A&A, 582, A30
Shimakawa, R., Kodama, T., Tadaki, K.-i., et al. 2015, MNRAS, 448, 666
Steidel, C. C., Adelberger, K. L., Shapley, A. E., Erb, D. K., Reddy, N. A., Pettini, M. 2005, ApJ,
626, 44
Thomas, D., Maraston, C., Schawinski, K., Sarzi, M., & Silk, J. 2010, MNRAS, 404, 1775
Toshikawa, J., Kashikawa, N., Overzier, R., et al. 2014, ApJ, 792, 15
Toshikawa, J., Uchiyama, H., Kashikawa, N., et al. 2018, PASJ, 70, S12
Trenti, M., Bradley, L. D., Stiavelli, M., et al. 2012, ApJ, 746, 55
Uchiyama, H., Kashikawa, N., Overzier, R., et al. 2019, ApJ, 870, 45
Valentino, F., Daddi, E., Strazzullo, V., et al. 2015, ApJ, 801, 132
Wise, J. H., Regan, J. A., O’Shea, B. W., et al. 2019, Nature, 566, 85
Wylezalek, D., Galametz, A., Stern, D., et al. 2013, ApJ, 769, 79
8You can also read