Auctions for the support of renewable energy: Lessons learnt from international experiences
←
→
Page content transcription
If your browser does not render page correctly, please read the page content below
D2.3, December 2020

Auctions for the
support of renewable
energy:
Lessons learnt from
international
experiences
Synthesis report of the AURES II case studies

          AURES II has received funding from the European Union's Horizon 2020 research and innovation programme under grant agreement No 817619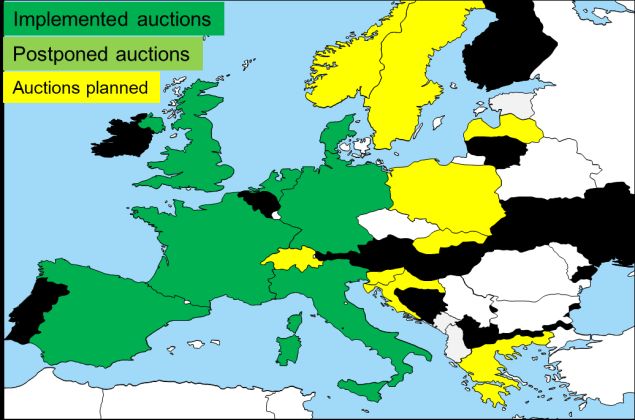
D2.2, December 2020, Auctions for the support of renewable energy:
Lessons learnt from international experiences – Synthesis report of the
AURES II case studies
Authors: László Szabó, Mária Bartek-Lesi, Bettina Dézsi, Alfa Diallo, András Mezősi (REKK), with contributions
from Lena Kitzing (DTU), Bridget Woodman, Oscar Fitch-Roy (Exeter), Pablo del Rio (CSIC), Gustav Resch (TU
Wien), Felix von Blücher, Fabian Wigand (Guidehouse), Craig James Menzies (Factor), Vasilios Anatolitis
(Fraunhofer ISI)

Reviewed by: Fabian Wigand (Guidehouse), Vasilios Anatolitis (Fraunhofer ISI), Pablo del Rio (CSIC)
Submission date: December 2020 (M26)
Project start date: 01 November 2018
Work Package: WP2
Work Package leader: REKK
Dissemination level: PU (Public)

Any dissemination of results reflects only the authors’ view and the European Commission Horizon 2020 is
not responsible for any use that may be made of the information Deliverable D2.3 contains.

                                                      2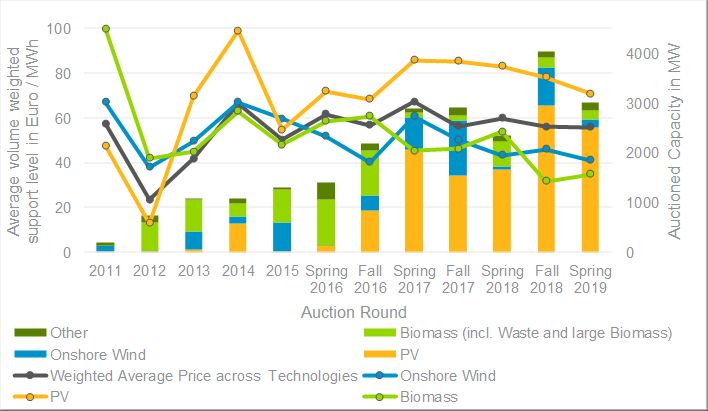
Contents
Executive summary ............................................................................................................................................................5
1       Introduction .................................................................................................................................................................6
2       Summary of case studies ........................................................................................................................................7
    2.1         Denmark .............................................................................................................................................................7
    2.2         Design of the upcoming offshore wind tender Thor in Denmark ............................................................8
    2.3         Germany .............................................................................................................................................................8
    2.4         Greece .................................................................................................................................................................9
    2.5         Hungary ........................................................................................................................................................... 10
    2.6         Netherlands .................................................................................................................................................... 10
    2.7         Poland .............................................................................................................................................................. 11
    2.8         Portugal ........................................................................................................................................................... 12
    2.9         Slovakia ........................................................................................................................................................... 13
    2.10        United Kingdom ............................................................................................................................................. 13
    2.11        Argentina ......................................................................................................................................................... 14
    2.12        Alberta (Canada) ............................................................................................................................................ 15
    2.13        Mexico ............................................................................................................................................................. 15
    2.14        Chile.................................................................................................................................................................. 16
    2.15        Austria .............................................................................................................................................................. 16
    2.16        CSP ................................................................................................................................................................... 17
3       Trends in auction design across the selected case studies ........................................................................... 19
    3.1         Characterisation of auctions in the analysed countries ......................................................................... 19
        3.1.1       EU countries ............................................................................................................................................... 19
        3.1.2       Non-EU countries analysed ..................................................................................................................... 22
    3.2         Design elements defining how bids are awarded .................................................................................... 24
        3.2.1       EU case studies ......................................................................................................................................... 24
        3.2.2       Non-EU case studies ................................................................................................................................ 26

                                                                                           3
3.3 Design elements facilitating project realisation ....................................................................................... 26
4 Assessment of the European auctions............................................................................................................... 32
4.1 Policy effectiveness ...................................................................................................................................... 32
4.2 Static efficiency .............................................................................................................................................. 34
4.3 Actor diversity ................................................................................................................................................. 35
4.4 Dynamic efficiency ........................................................................................................................................ 36
5 Lessons learned from international experiences .............................................................................................. 37
5.1 New developments ........................................................................................................................................ 38
5.2 New directions ............................................................................................................................................... 39
6 Summary .................................................................................................................................................................. 40
References ........................................................................................................................................................................ 41
4Executive summary
This paper is a comprehensive summary of world-wide renewable auctions, based on the in-depth case
studies of several EU and non-EU countries in the AURES II project.
As a result of the European competition and renewable energy regulation, progress is being made towards
competitive auction-based support schemes from the feed-in tariff or green certificate subsidy systems. This
is also happening in the non-European countries but at a slower pace. The main aim of this report is to
evaluate the core design elements, the efficiency and effectiveness of the analysed auctions, and, through
comparative analysis, highlight some general trends.
Among European auction schemes there are several common design elements as well as a mixture of
variations, however, similar to the conclusions of the first AURES project, no single ‘best’ design solution can
be concluded. The differences are more accentuated in non-European countries where the deviations of the
auction designs are even greater. Based on the findings of the AURES II case studies, this report finds mostly
pay-as-bid, static, multi-unit auctions providing support for 15-20 years on average, with price being the main
determining factor of winner selection. Another common feature worth highlighting here is the application of
a one or two stage bid bond to achieve higher realisation rates.
On the other hand, there is a clear divergence in several important elements of renewable tender design. First,
the technology focus of the auctions varies greatly. Some older tender schemes, for example in Germany,
still operate technology-specific auctions, but this setup also applies in other countries like Portugal. New
auctions tend to be multi-technology auctions, where different technologies compete against each other. It
is important to note that multi-technology auctions can be organised in several different ways, without any
technology restrictions or by creating several technology baskets. In some non-EU countries, conventional
technologies participated in the auctions along with renewable technologies, e.g. Mexico, Chile. In terms of
support payments there are also differences both in EU and non-EU countries. In general, the two-sided
sliding feed- in premium schemes (CfD) are most common. Some countries, like Germany, apply one-sided
sliding premium systems, while others, like Denmark, introduce a fixed premium. Material and financial
guarantees are widely used to varying degrees. Lower levels of financial guarantees are usually associated
with more demanding material prequalification criteria and vice versa, albeit some countries (like Germany,
Greece and Argentina) set relatively strict material and financial prequalification requirements.
Beyond the most important design elements this report also analyses the effectiveness and efficiency of the
applied schemes. In most countries the desired decline in prices is observable, however due to the many
exceptions and very different auction designs, it is difficult to draw precise conclusions without more
sophisticated in-depth analysis. However, in most of the countries the introduction of auctions resulted in
lower support requirements than the previous feed-in-tariff system, verifying that renewable tenders indeed
serve as a more efficient tool for allocating support. In terms of effectiveness, most auctions are
oversubscribed, except for some cases such as onshore wind tenders in Germany, or biofuels/biomass
auctions in Poland. It is more difficult to draw conclusions about the realisation rates because data from past
auctions is limited. This is a clear caveat that has to be reconciled to draw proper conclusions as to the
effectiveness of future renewable auctions.
The case studies also provided some new insights. In some countries low auction prices can partially be
explained by the accumulation of numerous projects ‘in the pipeline’. This can either be the result of long
waiting periods without opportunity for developers to access support, like in Portugal, or the upcoming
introduction of restrictive measures limiting the chances for specific technologies to participate in the
auctions, like in Poland. In some recent auctions, the scope of auctions has become broader, for example in
case of the Dutch SDE++ system, where support is provided for projects that can mitigate GHG emission at
the lowest cost, or Germany’s innovation auction where mainly joint storage and PV projects won. These new
directions may gain momentum in future tender development. Portugal is also unique because with PV
technology costs already below wholesale prices, producers compete for grid connection capacities instead
of RES-E support. With the expectation that securing proper sites and network connection points might prove
to be increasingly challenging in many regions, countries may follow suit and use similar styled auctions to
allocate scarce network connection opportunities.
51 Introduction
Many more EU Member States (MS) have introduced auctions since the last AURES assessment in 2016.
(See the project website for more details: https://www.auresproject.eu/publications) Amongst other factors
this process is driven by the EU State Aid Guidelines (2017) obliging Member States (MSs) to switch to RES
auctions to grant support for new installations generating electricity from renewable energy sources (RES).
Similarly, the Energy Community Contracting Parties have also started to introduce auctions to align their
support schemes. Their experience showed that auctions are efficient instruments to follow the cost
reductions of RES-E technologies compared to administrative procedures (e.g. Feed-in Tariff schemes). The
examples of many countries (e.g. Denmark, Hungary, UK) show significant cost reductions after switching
from the former, more administrative support schemes, The flexible nature of the design process also allows
policy makers to adapt auctions to adapt to country specific circumstances.
We can observe convergence of many design elements in European countries already applying RES-E
auctions. Only seven MSs have not yet introduced RES-E auctions up till 2020, out of which two are in a more
advanced planning phase. Slovakia cancelled its planned auction due to the COVID pandemic. In the growing
number of RES-E auctions we can observe heterogeneity in some auction design elements, but at the same
time we can also detect some harmonisation of other elements due to the observable learning effects taking
place in the last years. These differences will be analysed in this synthesis report.
Figure 1: Auctions implemented till 2016 (Aures I synthesis report) and till first quarter of 2020
The report synthesises the findings of Work Package 2 (WP2) of the AURES II project. WP2 assessed 10
ongoing RES auctions (six EU countries and four outside) and also assessed 4 planned auctions (three in the
EU and one outside), of which one (Hungary) already started the auction in 2019. WP2 of AURES II also
assessed technology focused case studies on off-shore wind development in Denmark and the concentrated
solar plant (CSP) technology auctions in various countries. The case studies together with the database
constructed in WP3 serve as inputs to other WPs, research communities and policymakers. WP2 applied the
methodology used in the previous AURES project: open source literature research was complemented by
expert interviews from industry, responsible Ministries and regulatory authorities. The case studies can be
consulted on the AURES II website: http://aures2project.eu/case-studies/.
We have structured this report into 5 chapters. This introduction is followed by a short overview of each on-
going and planned case study. The third chapter analyses the trends in auction design across the selected
case studies. It characterises the auction types and assesses the main design elements for awarding bids
facilitating project realisation. The next chapter looks at the policy effectiveness and static efficiency of the
various RES-E auctions realised in the EU and non-EU countries and examines the elements that help to
increase actor diversity. The last chapter summarises the main lessons from the case studies while reflecting
on upcoming innovations, e.g. the innovation auctions in Germany and the planned GHG auctions of the
Netherlands.
62 Summary of case studies
This chapter includes short summaries of the 16 auction case studies of the AURES II project. The planned
Ukraine auction could not be included as a case study as it was finalised later, but it is available on the AURES
II website. The following summaries highlight the main characteristics of the case studies, the most
important elements are described in more detail in later chapters.
It is important to note, that in some cases, different terminology refer to the same characteristics of auctions,
due to different practices in the covered countries. For example, the study uses the expression ‘basket’ when
competing projects are divided according to their size or technology to compete separately, but ‘pot’,
‘brackets’ or ‘category’ share the same meaning in the original case studies. Similarly, two-sided sliding feed-
in-premium and contract for differences (CfD) are the same rewarding method (see details later). Technology
differentiation of eligible renewable technologies is described as technology neutral in some cases, although
in practice full technology neutrality was not achieved in these auctions as level of playing field cannot be
guaranteed. According to our evaluation every auction design favours some technologies against others, so
we found ‘multi-technology’ a more appropriate term in these cases.
2.1 Denmark
Denmark is one of the leading countries in the world in terms of deployment of new (non-hydro) RES; 8 GW
of the 15 GW total installed electricity, including 6 GW wind energy and 1 GW solar PV. Wind energy covered
47% of the electricity consumed in 2019.
Until now, 11 RES-E auctions have been held, including the multi-technology tenders for wind and solar in
2018 and 2019 and PV solar tender for projects with a capacity less than 1 MW in 2018.
There has been significant reduction of support levels considerably undercutting the ceiling prices set in the
tenders. There are only few players that have won in the auctions with a citizen-based consortium failing to
pre-qualify for the Nearshore Tender.
All renewable energy auctions are static sealed bid auctions with pay-as-bid pricing. All past offshore wind
auctions have been single-item, technology specific auctions for projects with predefined size and location,
providing sliding premium tariffs for a fixed amount of produced electricity over 12-15 years. For the
nearshore areas, a multi-site tender was introduced, with a maximum capacity of 350 MW distributed over 5
predefined areas.
With the introduction of the multi-technology tender in 2018, the Danish government has for the first time
taken a technology-agnostic approach with a fixed premium per generated kWh added on top of the
electricity price for 20 years. The first round of the multi-technology auctions had shown strong competition,
with winning and losing bids from both wind onshore and solar PV, resulting in the procurement of 165 MW
onshore wind and 101 MW solar PV. In the second multi-technology auction the following year, bids
combining onshore wind and solar capacity in hybrid projects successfully applied for. It resulted in
procurement of 135 MW onshore wind and 117 MW solar PV. The 2019 auction was the first auction in
Denmark that was undersubscribed, leaving 39% of the support budget unallocated, while also resulting in
the lowest prices to date.
Most auction volumes were based on a capacity limit except for multi-technology and small-scale solar PV
tenders. The multi-technology tenders have a total financial support budget.
So far, all energy auctions except for the first offshore wind farm tender Rødsand 2 were realised in time.
Also, Power Purchase Agreements (PPAs) are increasingly being concluded in parallel to the obtained
support.
A right given to local citizens to purchase shares of installed onshore wind projects was only partially
successful in terms of shares sold. Project owners have ambiguous incentives towards the offering, and
results are very much divergent between projects.
72.2 Design of the upcoming offshore wind tender Thor in Denmark
As part of the Energy Agreement of 2018, Denmark decided to establish three offshore wind farms before
2030. The first of these wind farms is the Thor Offshore Wind Farm. With a capacity between 800 and 1000
MW, it will be the largest offshore wind farm in Denmark. The upcoming tender design for the Thor offshore
wind farm carries two important distinctions, a wider scope that includes the full offshore grid infrastructure
and a new design for the remuneration scheme.
During 2019 the Danish Energy Agency (serving as auctioneer) held a conference and bilateral meetings with
interested market players as part of a stakeholder dialogue. The market dialogue was conducted to collect
input and reactions to the proposed elements of the tender; to clarify a range of issues, and to make valuable
adjustments to the tender.
The Danish tender procedure is a competitive procedure with a pre-qualification and a negotiation phase. To
be pre-qualified, candidates must prove economic and financial capacity, as well as technical and
professional ability. The pre-qualification phase closes in January 2021. The final tender material is expected
to be published in Q3 2021 with final bids expected in Q4 2021. The auction will be conducted as a static
sealed bid auction whereby the concession is awarded to the tenderer quoting the lowest price if the expected
subsidy cost over the 20-year period is below 3.7 billion DKK. However, in the event that no bids fall within
the budget evaluation threshold, there is a chance that a bid can still be accepted by the political parties t o
the Energy Agreement of 2018. If there are two or more bids with the exact same bidding price, the highest
capacity (MW) bid will be chosen. The grid connection window for the winning bidder for the Thor wind farm
is 2024 to 2027.
The remuneration scheme is a Contract-for-Difference mechanism over 20 years based on a reference price
calculated as the average spot price from the previous year. Compared to the ‘traditional’ hourly based
system, this increases the short-term risk of price fluctuations for the concession owner. The purpose behind
this change is to incentivize the concession owner to maximise the market value of production rather than
simply maximise output. The total net value of the remuneration payments has been capped for both the
state and the concession owner.
2.3 Germany
Renewable energy auctions have become the new 1,490 MW 1,610 MW
standard for determining subsidy levels for
renewable energy sources (RES) in Germany. From 1000
900
2015 to 2019, a total of 17.25 GW of renewable 800
energy capacity has been added in 40 auction 700
rounds. However, significant undersubscription in the
600
500
recent onshore wind auctions threatens their 400
expansion trajectory. 300
200
The German auction schemes include wide ranging
100
0
auction formats, rounds and volumes. Now the focus
Jun 17
Jun 18
Jun 19
Oct 17
Oct 18
Oct 18
Oct 19
Oct 19
Apr 15
Apr 16
Apr 17
May 17
Apr 18
May 18
May 19
Apr 18
Apr 19
Apr 19
Aug 15
Aug 16
Aug 17
Sep 17
Aug 18
Sep 18
Aug 19
Sep 19
Nov 17
Nov 18
Dec 15
Dec 16
Mar 19
Nov 19
Nov 19
Feb 17
Feb 18
Feb 18
Feb 19
Feb 19
is on auctions for onshore and offshore wind and Solar PV Pilot Solar PV Wind Onshore
solar PV, which are at the core of the German Joint Auction Wind & Solar PV Biomass Wind Offshore
renewable support scheme. Specific design
elements reflect the characteristics of the German
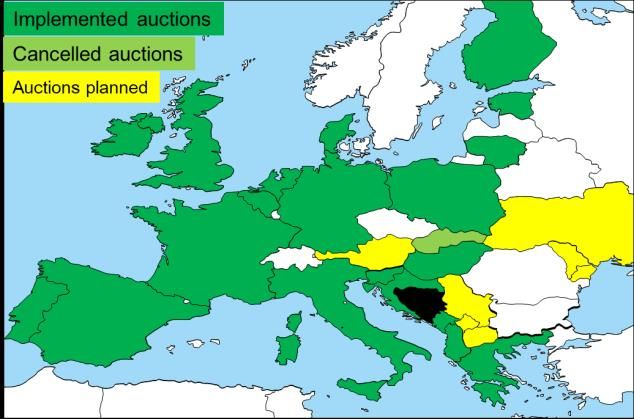
Figure 2: German RES-E auction rounds and volumes
power system. One example is the maximum quota
for the yearly capacity addition of onshore wind in the so-called grid expansion area (Netzausbaugebiet) that
is applied in the auction to account for regional capacity limitations of the transmission grid.
The results of German RES-E auctions demonstrate that competition is a key success factor for renewable
auctions. While the auctions for solar PV and offshore wind had sufficient competition and provided
satisfying auction results, the auctions for onshore wind and biomass suffer, for different reasons, from a
lack of bid volume.
8Solar PV Onshore wind
12 600% 8 400%
Level of competition [bid/auction volume]
Level of competition [bid/auction volume]
7 350%
10 500%
6 300%
8 400%
Price [ct/kWh]
Price [ct/kWh]
5 250%
6 300% 4 200%
4 200% 3 150%
2 100%
2 100%
1 50%
0 0%
Apr Aug Dez Apr Aug Dez Feb Jun Okt Feb Jun Okt Feb Mrz Jun Okt 0 0%
15 15 15 16 16 16 17 17 17 18 18 18 19 19 19 19 May Aug Nov Feb May Aug Oct Feb May Aug Sep Oct
Auction round 17* 17* 17* 18 18 18 18 19 19 19 19 19
Auction round
Level of competition Lowest successful bid
[* Auction rounds with preferential rules for citizen energy (Bürgerenergie)]
Highest successful bid Average price of successful bids
Ceiling price Level of competition Lowest successful bid
Highest successful bid Average price of successful bids
Ceiling price
Figure 3: Price levels of the German solar PV and onshore wind auctions
Since the introduction of the auction scheme for solar PV, the weighted average price of successful bids went
down substantially. Starting from 91.7 EUR/MWh in the first auction in April 2015, this fell 47% to 49
EUR/MWh in the latest auction in October 2019.
The first onshore wind rounds were highly competitive with declining prices. The weighted average price of
a successful bid, 57.1 EUR/MWh in May 2017, fell to 42.8 EUR/MWh in August 2017 and 38.2 EUR/MWh in
November 2017. However, since the preferential rules for community energy projects had been put on hold
for 2018 and onwards, the bid volume in the onshore wind auction volume decreased and prices increased
steadily, getting close to the ceiling price from August 2018 onwards and reaching it in August 2019.
The experiences made with renewable auctions in Germany are mixed. The case of solar PV has proven that
auctions can be an effective tool to award support in a competitive manner, drive down support costs and at
the same time ensure steady RES-E development with high realisation rates. On the other hand, the case of
the onshore wind auctions shows that designs aiming to support particular types of bidders, as a preferential
rule for energy community projects in 2017 that did not need to show an advanced project predevelopment
status to submit a bid, can have adverse effects on the project realisation timeframe. A lack of available sites
and project pipeline also reduced competition in wind onshore auctions, resulting in high prices.
2.4 Greece
In 2010, Greece committed itself to achieve 20% RES in its gross final energy consumption and at least 40%
in its gross final electricity consumption by 2020. After retroactive feed-in tariff cuts and the subsequent
turmoil in the Greek RES sector, Greece introduced an auction-based support scheme in June 2016 for
onshore wind and PV – with both technology-specific and multi-technology auctions.
According to the Greek auction design, the government defines the maximum volume to be auctioned in each
year. Afterwards, RAE, the auctioneer, announces the specific auction volume for each round and interested
bidders can apply with their projects to participate in the actual auction. Qualified bidders are then invited to
submit their bid prices in a dynamic auction procedure – after the auction volume is adjusted based on the
total capacity of submitted bids.
There are two distinctive features of the Greek auction scheme: the volume adjustment mechanism and the
segmentation of PV auctions.
The volume adjustment is meant to ensure sufficient competition in the auctions. If the total bid capacity (by
qualified bidder) does not surpass the initial auction volume by a certain threshold (e.g. 40%), the auction
volume for the dynamic auction is adjusted downwards, until the threshold is reached. Indeed, the
mechanism might have led to relatively low awarded prices – at least in the short-term. Nevertheless, in at
least one auction round bidders participated with "fake projects" in order to circumvent the volume
adjustment. Furthermore, almost 500 MW of onshore wind and PV projects could have been additionally
9awarded based on the initial auction volumes without the adjustment.
In the first PV auctions two different segments existed, small-scale projects below or equal 1 MW and
projects above 1 MW up to 10 MW/20 MW. After the auction of the smaller segment resulted in similar prices
to larger projects, RAE decided to pool both into one category. This significantly curtailed small-scale winning
projects, indicating that small-scale projects were not as competitive and project developers might have split
up their large-scale projects in the first auction rounds to secure an award with a higher bid price in the small-
scale segment.
Greece has completed 13 auctions successively pushing down the strike prices well below the
administratively set feed-in tariffs in place before. By the end of 2019 prices fell to 60 EUR/MWh for PV and
58 EUR/MWh for onshore wind. Furthermore, Greece has been able to attract a rising number of international
investors and project developers, which shows that the auction scheme is perceived as a stable and
financially sustainable mechanism.
2.5 Hungary
Hungary reached its overall 2020 renewable target (13%) in 2011 owing to a revision of biomass accounting.
Indeed, renewable energy in Hungary is predominately biomass utilised for in heating, and yet RES share fell
below 13% in 2018 because of weather conditions and other economic factors.
After joining the EU in 2004, Hungary set its 2010 renewable electricity (RES-E) target to 3.6%. It exceeded
this with a feed-in tariff subsidy system launched in 2002 that was in operation until 2017. The scheme mainly
incentivised coal and biomass co-firing in existing power plants, and with wind capacities capped at 330 MW
in 2006 by the Hungarian Energy Regulator further expansion of RES-E is mainly expected for solar PVs.
The Renewable Energy Support Scheme (METÁR) launched in 2017 was developed according to EU
guidelines. The new system kept the mandatory FIT system exclusively for units below 0.5 MW and for
demonstration projects of any size (METÁR-KÁT). Installations from 0.5 to 1 MW were able to apply for a
feed-in-premium over the market price and those above 1 MW had the obligation to enter competitive
auctions. In November 2019, Hungary executed its first pilot auction for renewable energy support and
announced the results in March 2020. The auction was successful in providing information on current
technology prices and driving down support costs, born exclusively by non-household consumers in Hungary.
This was technology-neutral by name but in practice all awarded projects were PV except for one small-scale
landfill gas power plant.
The auction volume was set at 200 GWh/year with a budget of EUR 2.9 million divided into two baskets: small
installations with a capacity between 0.3 MW and 1 MW and large installations between 1 MW and 20 MW.
The ceiling price was the same for all technologies in both baskets, 26.08 HUF/kWh (78 EUR/MWh).
Altogether, 168 bids totalling 349 MW capacity were submitted, 269.4 MW of which qualified. The pilot
auction revealed that the actual costs of PV generation are well below the previous feed-in tariff level, creating
substantial savings in support costs.
Although volatility in the electricity and foreign exchange markets caused by the COVID-19 pandemic might
affect the implementation of the winning projects, the national regulatory authority expects to meet its
objective by connecting 131.84 MW renewable capacity to the grid.
2.6 Netherlands
The SDE+ was the main renewable energy support scheme in the Netherlands during the 2010s and is soon
to be replaced by SDE++ in 2020. It was one of the first large technology neutral support schemes in Europe,
which allowed for large fluctuation in the type of capacity contracted, as well as the auctioning of budget
instead of capacity.
The SDE+ combines all technologies except offshore wind energy under a single budget. Technologies
compete against each other but are restricted by technology specific ceiling prices. Until the auction round
in spring 2019, the SDE+ succeeded in auctioning support for over 25,6 GW of renewable energy capacity, 18
10GW of which are still under construction. However, it failed to achieve significant reductions in overall support
levels. Offshore-wind tenders, which have been implemented under a separate budget, are an exception to
this as resulted in subsidy free bids in 2017. Especially in the earlier years of the SDE+ it occurred that projects
bid at considerably lower costs to be able to receive support at all. More often cheaper technologies bid at
higher prices because another, more expensive, technology was setting the price. Overall, it can be said that
the technology-specific ceiling prices were important and relevant for the small price decline in recent years.
Figure 1 below provides an overview of contracted volumes per round and volume weighted strike prices.
Figure 4: Maximum SDE+ support level (average per technology) and contracted capacity
The overhaul and development of the SDE+ towards the SDE++ changed it from a renewables support
scheme to a CO2 emission reduction support scheme, aiming mainly to reach national GHG targets rather
than renewables targets. The introduction of new industrial technologies and a methodology based on Euros
per ton of CO2 avoided poses several challenges such as setting correct base levels (ceiling prices).
The experience from SDE+ are mixed. While it succeeded in contracting large amounts of renewable capacity,
non-realisation rates in the early rounds showed how important proper pre-qualification requirements are.
Furthermore, the price and capacity fluctuations characterising the early auctions highlights how difficult it
is to design and implement a truly technology neutral auction.
2.7 Poland
With its share of renewable energy of only 11% in 2016, Poland had to make a strong late push to reach its
2020 target of 15%. In fact, the country voluntarily increased its renewable electricity target to 19.3% for 2020
(Ministry of Economy, 2009). Furthermore, RES-E support should be shaped with a long-term vision since the
country’s electricity system today relies heavily on coal and lignite inputs.
In 2017, Poland generated more than 170 TWh (NECP, 2019) of electricity, 86% from fossil fuels (hard coal,
lignite, natural gas) compared to only 24 TWh from renewable sources. Onshore wind is the dominant
renewable technology accounting for 9% of total generation, compared to 3% biomass and small amounts
of hydro, biogas and PV.
Poland has been operating a hybrid support scheme since 2016. New renewable power plants can receive
support in an auction-based feed-in premium (FIP) system, while old power plants are part of a green
certificate system. It is possible, however, to migrate from the green certificate system to FIP through
auctions. The auction system in Poland is highly fragmented compared to other European countries with
baskets separated according to three main features: technology, size (separate auctions for power plants
with less and with more than 1 MW capacity), and whether the power plant is new or existing with the aim of
shifting from the green certificate system to the FIP system.
In three rounds (2016, 2017 and 2018) Poland organised 18 auctions with varying baskets of technologies.
Some included only single technologies and others multiple technology baskets. A second dimension divided
the auction by size, below and above 1MW. The Polish government is attempting to achieve several
11objectives simultaneously under the new scheme. On the one hand it wants to move RES production away
from the green certificate scheme to reduce the support needed for the expansion of renewable generation.
On the other hand, it wants to help advance RES capacities that would not be able to compete with large-
sized wind or PV installations (e.g. small-sized biogas and biomass-based generation) to expand market
participation and increase actor diversity. However, support for small-scale producers is inherently more
costly and their participation erodes cost efficiency. Data shows that for a technology basket containing
onshore wind and PV, support for smaller installation can be twice as high as larger plants, resulting in about
40 EUR/MWh price difference. Therefore, a trade-off between these two objectives should be discussed. It is
also evident that the ceiling prices of the small-scale mixed PV and onshore wind auction rounds favour PV
technologies.
The auctions were more successful in the case of hydro technology, where auctions had high participation
rates and resulted in relatively moderate prices. Nevertheless, biomass and biogas producers performed
poorly, and in many auction baskets there were no participants (6 out of 9 auctions), while in others only very
few. In these categories, only hydro installation investors were targeted (above 40 participants), albeit only
around 30% of the total budget was allocated. Biogas and biomass producers likely refrained from
participation probably due to the rising certificate prices and the changing regulation defining the RES
markets. It is not clear either how the transferred amount of RES production from the certificate market is
managed in the system, or how it impacts the supply/demand relation of Poland’s remaining certificate
market.
The tender for mixed wind-photovoltaic above 1 MW resulted in the most competitive prices (45.93
EUR/MWh average price), even below the 2018 German price levels. However, the competitive pressure was
not a result of the auction design itself. Onshore wind connection license owners in Poland must realise their
projects before July 2021, which encourages participation in competitive bidding. At the same time the Polish
energy policy precludes onshore wind from further expansion in the future. This poses a serious question to
the auction design: which technology should be promoted if the low-cost onshore wind is excluded from the
technology mix? This creates an advantage for PV technology in the short term and offshore wind in the
longer term.
2.8 Portugal
The deployment of RES-E capacities has experienced considerable momentum over the last two decades,
positioning Portugal as one of the leaders in the EU. Both RES-E installed capacity and generation have
doubled between 2005 and 2016, following a 6-7% average annual growth rate. With additional capacity of
5124 MW, wind energy has experienced the largest gain over the period (five-fold), before starting to plateau
in the last few years. Solar has also been stagnant at much lower deployment levels.
The Portuguese government outlined a path of diversification through sustainable endogenous RES aiming
for 47% of gross final energy consumption in 2030, up from 28.5% in 2016 and 31% in 2020 (the target for
that year) in the National Energy and Climate Plan. The government aims to increase the RES share in
electricity generation from 68% in 2020 to 80% in 2030 and to 100% by 2050.
The evolution of the Portuguese RES-E regulation and support schemes have a long history with several
different regimes Between 2006-2008 Portugal’s renewable auction support scheme was one of the first in
Europe. According to the government, with scarce grid capacities auctions are the best way to satisfy
demand for production licenses.
Portuguese auctions can be labelled as “2nd generation auction", completely different from renewable
auctions across Europe usually organised to assign price support for renewable power plants. In Portugal,
however, producers compete for the opportunity to connect to the grid.
The Portugal PV auction is a dynamic auction which incorporates several rounds of bids. The process is an
“ascending clock” type of auction (increasing NPV) and the number of rounds is not fixed but dependent on
the bidding behaviour of the participants. The tender offers bidders the choice between a “guaranteed
remuneration” or a “general remuneration”. Under the guaranteed remuneration, participants bid for a
discount (%) from a given tariff level (at around 45 EUR/MWh) to receive a two-sided sliding premium (CfD)
for 15 years. Under the general remuneration, bidders receive the market remuneration for 15 years but they
12offer payments to the electricity system operator.
For the offered 1.4 GW capacity, more than 10 GW of offers were made, however only 1.15 GW were awarded
because of the location specific nature of the auction. The winning investors have three years to commission
their power plants and will pay the network contribution fee or receive the feed-in premium depending on the
selected scheme for a period of 15 years. Out of the 1.15 GW, 862 MW were assigned under the guaranteed
and 288 MW in the general remuneration scheme. A single company won 32% of the awarded capacity but
the remaining capacity was distributed more evenly between 12 other firms. Incumbents of the Portuguese
electricity market did not make any winning bids in the auction.
Competition achieved low auction prices, with the average winning price of the guaranteed remuneration
scheme a premium of 20 EUR/MWh and the lowest bid of 14.46 EUR/MWh, the lowest feed-in premium for
PV ever in Europe. In the general remuneration scheme winners paid an average of 21 EUR/MWh for every
MWh sold to the system operator. We can conclude that these prices are drastically lower than the wholesale
market price.
As renewable technologies become more and more competitive, auction results may fall below the wholesale
price across Europe, similarly to Portugal. This should shift the objective of auctions from providing financial
operational support to the allocation of scarce network connection capacities.
2.9 Slovakia
More than half of electricity generated in Slovakia comes from nuclear power and fossil fuels are falling with
the phase out of coal and the declining role of natural gas and oil. RES-E was composed entirely from
hydroelectricity until 2005, when gaseous and liquid biofuels and renewable municipal waste were first
introduced. Solar and solid biofuels entered the Slovakian power system in 2010 and has since generated
significant volumes of electricity.
Growth in RES-E production in Slovakia has plateaued since 2014 when it reached 22.9%, falling to 21.5% in
2018 (Eurostat, 2020). The overall renewable energy share peaked at 12.8% in 2015 and fell back to 11.9% in
2018, well below Slovakia’s 2020 target of 14%. The main reason for this drop was that new RES-E
installations since 2015 have not kept pace with growing energy consumption in transport and heating and
cooling of buildings. In an effort to address this gap, the Slovakian government introduced legislative changes
in 2018-2019 to support larger sized RES-E capacities by making them eligible for auctioned feed-in premium.
However, the first auction planned for spring 2020 was cancelled 10 days after the new government took
office due to the COVID-19 pandemic. The fact that it was cancelled rather than postponed suggests that it
might be redesigned before relaunching. It was planned as a multi-technology auction with some technology
specific conditions where relatively small solar PV power plants would have been eligible (0.1 - 2 MW) while
other technologies could be larger (0.5 - 10 MW).
The auction design presented relatively high cost and risk to potential to investors compared to other
European auctions, from the high bid bond to short realisation times and high fees for delays. These design
elements can potentially decrease participation rate, in the Slovakian auction, although they can improve the
realisation rate of the winning projects. The grid connection process puts project promoters at a further
disadvantage by making them wait until the announcement of the winning bids to present detailed
connection planning rather than acquiring a concrete pre-agreement with the relevant DSO in advance.
2.10 United Kingdom
The UK conducted its third Allocation Round (AR3) for Contracts for Difference (CFDs) between May and
September 2019. There was £65 million pounds of support available for projects coming online in 2023/24
and 2024/25, and the auction was open only to Pot 2 (less mature) technologies. The definition of Pot 2
technologies differed slightly from previous ARs, with the most significant change being the inclusion of
remote island onshore wind projects >5MW in AR3.
13The contracts awarded in each Allocation Round auction are limited by a budgetary cap which limits the total
overall spending on successful projects in each year (i.e. £65 million for AR3 projects, DBIES (2019a)). In
addition, AR3 introduced an overall capacity cap of 6GW for projects which could be awarded a contract.
The contracts awarded in AR3 demonstrate the strong downward pressure on price created by competition
between bidders. The contract prices offered after AR3 were in many cases below the projected electricity
market references prices which are used to calculate the budgetary impact. CFDs require generators to pay
back any difference between their contracted price and the market price if the market price is the lower of
the two. This has resulted in a strongly negative projection of the costs of AR3 – in other words, net revenue
for generators is lower than the projected wholesale price of electricity (DBIES 2019b). This appears to
demonstrate that the developers value the certainty given by a CFD as well as the price paid for contracted
generation. In addition, given that the £65 million budgetary cap for AR3 was not exceeded, the 6GW capacity
cap limited the contracts awarded, rather than the cost of the support scheme.
As with ARs 1 and 2, AR3 was dominated by offshore wind, with 5.466 MW contracted. In total, offshore wind
has received 87% of the CFDs awarded in the three ARs. This reflects the strategic priority that the UK
Government has given to developing an offshore wind industry as well as the rapidly declining cost of the
technology. However, it does raise concerns about the lack of diversity emerging in the UK’s renewable
generating sector. This issue may be addressed through the potential inclusion of onshore wind and solar
in the fourth AR which is due to take place in 2021 (DBIES 2020).
It is too early to speculate on the success rate of AR4 contracts. Given the low prices awarded in the
contracts, for offshore wind in particular, the deployment rate depends on the costs of the technology
declining rapidly before the delivery years (i.e. 2023/24 and 2024/25).
2.11 Argentina
Argentina is aiming to meet 20% of national electricity demand from renewable sources by 2025, with interim
targets of 8% for 2018 and 16% for 2021. In order to raise the share of renewables in the electricity mix, the
country launched the RenovAr programme in 2016. RenovAr features an open call for tenders in several
rounds, with eligible projects comprising those based on wind power, solar PV, mini hydro, biomass and
biogas power generation. A decisive feature of Argentina’s RenovAr support programme is a multi-level
safety net of payment and solvency guarantees designed to support competitive bid prices. On the first level,
in addition to entering into a PPA with the country’s Electricity Wholesale Market Administrator (CAMESA),
the successful bidder joins a Trust Adhesion Agreement (“FODER”). A second level guarantee is provided in
the form of a put option mechanism, which allows developers to transfer project assets to FODER in case
CAMMESA fails to pay for the supplied energy. Furthermore, the World Bank acts as a backstop guarantor
(through the International Bank for Reconstruction and Development) to FODER. The World Bank guarantee
comprises an optional third level that seeks to further secure against the risk that the Government of
Argentina cannot back up the repayment guarantees established through FODER.
The RenovAr programme has held four renewable technology-specific auction rounds to date. These have
resulted in PPAs for combined generation capacities of more than 2.2 GW of wind, 1.5 GW of solar, 30 MW
of small-scale hydro, as well as almost 190 MW of biogas and biomass power generation capacity. Three of
the four RenovAr rounds have attracted considerable interest from the private sector and have been
significantly oversubscribed, at least for solar PV and wind power. Moreover, they have yielded competitive
prices in comparison to other countries in the region. Wind power is the most cost-competitive technology
in Argentina according to the RenovAr programme, with prices as low as USD 37.3 per MWh. Overall, given
the limited experience (and levels of installed RE generation capacity) in Argentina prior to the introduction
of renewable auctions in that country, the RenovAr programme has so far proven to be an effective way to
quickly scale up installed generation capacity and continue progressing towards meeting the national 2025
RE target.
142.12 Alberta (Canada)
Alberta’s Renewable Electricity Programme (REP) was launched in 2016, reaching three auction rounds to
date, with the aim of incentivising the deployment of renewable energy capacity in Alberta to 2030.
The REP auction rounds were designed to feature three stages. The initial Request for Expression of Interest
(REOI) stage is intended to attract and assess the level of interest in the support mechanism, including
information sessions for potential bidders to address the Alberta Electric System Operator (AESO) with
questions and concerns. During the subsequent Request for Qualifications stage, bidders submit project
proposals and required documentation, but only as evidence of eligibility for qualification. In the final Request
for Proposals stage, bidders are asked to confirm their project proposals and submit a final bid for support.
A key feature of the REP is the Indexed Renewable Energy Credit (Indexed REC) payment mechanism. With
the Indexed REC payment mechanism, which is essentially a two-sided sliding FIP (Contract for Differences)
scheme, the AESO pays the successful bidder the difference between the strike price and the pool price if the
former is above the latter, or vice versa (i.e. the generators pay the difference to AESO). The three technology-
neutral capacity auction rounds have awarded a total volume of approximately 1360 MW of wind power
capacity.
Alberta’s REP has been successful in the three years since its initiation. All three REP auction rounds were
oversubscribed, yielding record low strike prices for Canada. The overall success of the auctions, in terms of
the high participation and competitive awarded prices, is understood to have stemmed from the considerable
preparation that was undertaken before the auctions were held, as well as from the choice of payment
mechanism. It is, however, too early to make definite claims about the overall effectiveness of the scheme
as only successful projects from REP Round 1 have very recently reached the stage of commercial operation.
Nevertheless, it is encouraging that three of the four projects began operating without delays.
2.13 Mexico
In Mexico, 98.7% of the growing population has access to electricity and the challenge is to connect the
remaining remote areas (IEA 2019). Retail electricity prices are relatively high (25% higher than in the United
States) for both residential and commercial buyers. Currently, the fuel-mix is dominated by thermal sources,
with fossil fuels accounting for 75.8% of the electricity generation. On the other hand, Mexico has ambitious
renewable energy targets: 30% RES by 2021 and 35% by 2024 as obliged under the Energy Transition Law
issued in 2015. Furthermore, the Transition Strategy to Promote the Use of Cleaner Technologies and Fuels
(2016) envisions 37.7% RES by 2030 and 50% by 2050. Mexico has abundant and high-quality RES-E,
especially onshore wind and PV though shares are low (3.6% and 0.7% in 2018, respectively). The main
renewable generation comes from large hydro with 10.3%.
Since 2013 Mexico has worked to reform its electricity sector, beginning with unbundling and restructuring
the public Comisión Federal de Electricidad (CFE) to facilitate private sector participation and increase the
competitiveness of the electricity and energy markets. In 2014 the Electricity Industry Law provided a new
regulatory framework including auctions, renewable energy quota obligations and Clean Energy Certificates.
The new Centro Nacional de Control de Energía (CENACE) is responsible for system operations and IPPs can
build and operate power plants and sell the electricity under long-term power purchase agreements to CFE.
In 2015, 2016 and 2017, three long-term power auctions (LTPAs) were organised, resulting in PPAs between
renewable energy generators and retailers (CFE being the main retailer). The LTPAs are designed to help
generators avoid the risks of volatile short-term prices and to benefit from stable revenues in order to finance
their investments. To briefly summarise, the auctions work as follows: retailers announce their demand for
energy (MWh); capacity (MW) and Clean Energy Certificates (CELs) are auctioned by CENACE; generators
bid for them separately or in packages.
The last auction (2017) introduced some novelties compared to earlier ones (2015 and 2016). Private off-
takers/buyers were allowed to participate alongside CFE. An independent clearinghouse executes separate
contracts between developers and off-takers, assessing financial credibility and socialising risk of default.
The nodal price signal was reduced. Bidders cannot bid separately for different products using the same
plant. The role of CELs is also relevant for additional financial support. CELs are expected to be slightly
15adjusted and increased in importance for the next auction round in Mexico.
The auction was successful in achieving lower prices that were much lower than in previous auctions in
Mexico as well as comparable auctions elsewhere. One of several reasons behind the success was the high
competition rate. Others were experienced bidders, favourable finance and macroeconomic conditions,
project economies of scale, guarantees and contract condition, etc. The average bid price for the whole
package was 20 USD/MWh compared to 47USD/MWh in the first and 33USD/MWh in the second auctions.
2.14 Chile
Chile experienced a very significant growth (42%) in electricity demand from 2006 to 2016. The country
consists of four (now somewhat interconnected) separate electricity systems and very few cross-border
interconnections. The mining industry is the single most important consumer (37%) of electricity, with a
profile of considerable night consumption. Currently, the mix consists of coal (33.6%), gas (13.4%), large
hydro (24.7%), PV (10.5%), onshore wind (8.3%) and small hydro (2.1%). In addition, Chile has excellent RE
sources available.
Chile’s main objectives were to lower electricity retail prices, increase competition in the market, reduce
outages, increase intra-Chilean connectivity, and reduce CO2 emissions. The RES quota for electricity
generation is 60% by 2035 and 70% by 2050. The auctions in Chile are technology-neutral and include fossil-
fuels with some special features: hourly supply blocks and a price revision mechanism are included so the
price may be modified in the event of significant and unexpected legal, regulatory, or fiscal changes. Also,
indexation factors are considered when assessing the bids (levelised price).
The latest auction (2017) innovates with some criteria: seasonal (quarterly) blocks (in addition to hourly
blocks) were introduced. The goal of the hourly blocks is to arrive at the lowest price possible for every 24-
hour period. The goal of the quarterly block is to lower annual prices. In this case, seasonal renewables may
have an advantage. Bid restrictions could be stated by auction participants (realisation contingent on multiple
awards). Auctions were awarded through first hourly then quarterly blocks. Also, the financial prequalification
requirements were stricter than in earlier auctions.
In achieving the very low weighed average price of 32.5 USD/MWh, the competition and efficiency of the
auctions appears strong, both with respect to international experiences and previous auctions in Chile (47.6
USD/MWh). The hourly blocks were more competitive than the quarterly blocks.
Some experts are concerned that the time allotment for project completion is too generous. Projects must
start producing electricity only until 2024, 6 years after being priced, in October 2017.
The case of Chile shows that renewables can successfully compete with fossil-fuel technologies in
technology-neutral auctions, especially if designed in a way which takes into account their dispatch profiles.
Consequently, RES projects can be built without subsidies in Chile.
2.15 Austria1
In the final version of the Austrian National Energy and Climate Plan (BMNT, 2019), the Austrian Federal
Government set an ambitious target for the domestic expansion of RES-E to fully cover the total electricity
consumption (at a yearly balance)2. Furthermore, full climate neutrality of the whole economy shall be
reached by 2040.
1 Although it was planned as a case study, due to delayed planning a finalised case study on Austria could not be included
in the AURES II project. This summary is given to summarize latest developments concerning its auction design.
2 Considering exceptions from the definition of demand this translates into a RES share of approx. 92% in gross electricity
demand (following commonly applied statistical definitions of that). More precisely, as postulated in BMNT (2019), the
calculation of the 100% renewable electricity supply should not include balancing needs as well as industrial auto-
production for reasons of resource efficiency. Both together are estimated to be in the range of 5.5 to 6.5 TWh,
corresponding to a demand share of ca. 8%.
16You can also read