Australian Real Estate Quarterly Review - Q1 2022 - Dexus
←
→
Page content transcription
If your browser does not render page correctly, please read the page content below
Australian
Real Estate
Quarterly
Review
Q1 2022
Australian Real Estate Quarterly Review | Q1 2021 Page 1 of
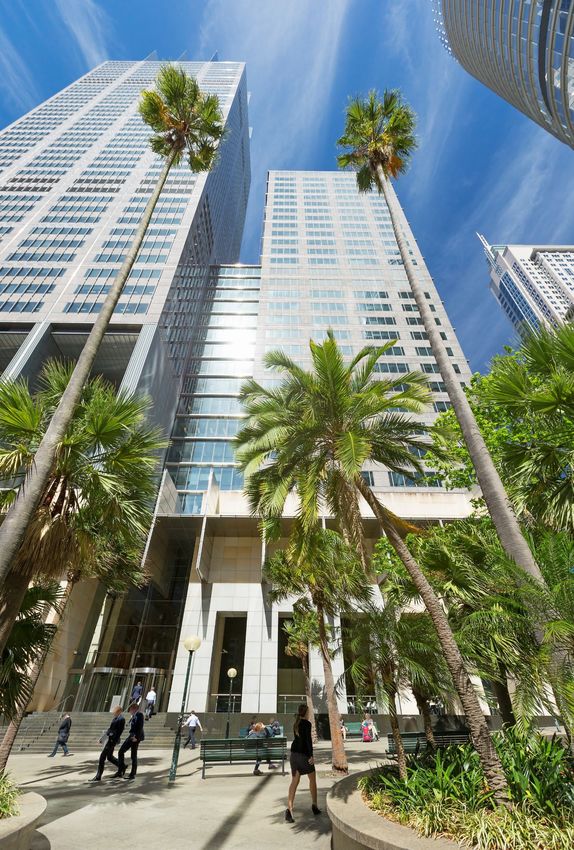
13 One Farrer Place, Sydney
Inside

Page 3                  Investment climate

Page 4                  Inflation and interest rates

Page 5                  Performance and transactions

Page 6                  Office

Page 7                  Office market wrap

Page 8                  Industrial

Page 9                  Industrial by region

Page 10                 Retail

Page 11                 Healthcare

Australian Real Estate Quarterly Review | Q1 2022      Page 2 of 13

Investment climate
Figure 1. Positive business confidence should help leasing
Twists and turns on the road to recovery markets, however consumer sentiment may dip
Conditions for real estate are expected to remain
Business Confidence Consumer Confidence (RHS)
positive over the next year despite the uncertainty Index
30
caused by the outbreak of the Omicron variant of 120
COVID-19. The current surge in COVID-19 cases is 10
expected to reduce economic growth expectations for 100
Q1 2022 and have some effect on the forecasted -10
FY22 full year growth, but experience implies that any 80
lost growth will be quickly recovered in FY23. The -30
60
outlook depends on the degree to which
hospitalisations lead to new restrictions. However, -50 40
authorities seem committed to ‘living with COVID’ so
further harsh lockdowns appear unlikely, which is -70 20
supported by the Australian population being highly Dec-16 Dec-17 Dec-18 Dec-19 Dec-20 Dec-21
vaccinated. Source: Bloomberg, NAB, Westpac
Our key assumptions are:
Infrastructure investment and non-residential Figure 2. Employment growth is improving with white collar
building activity will contribute to economic growth employment back in positive territory
despite a softening in residential construction % per annum All industries Whitecollar industries Professional services
The labour market remains strong and will support 10%
an increase in consumption in FY23 (Figure 2) 8%
Retail spending will continue to benefit from low 6%
6.6%
interest rates and accumulated savings
4% 3.7%
Inflation is likely to remain at or above 3% per 2% 3.4%
annum in 2022 but subside after that
0%
Short-term interest rates will remain low this
-2%
calendar year but rise by circa 1% in 2023
-4%
The key themes for investors to consider are: Nov-15 Nov-16 Nov-17 Nov-18 Nov-19 Nov-20 Nov-21
Leasing markets are expected to improve in all Source: ABS
sectors, helped by positive business conditions
Improving occupier demand and low interest rates Figure 3. Yield relativities are changing with industrial and
are usually good for property values healthcare yields pushing below retail
Capital flows into property are likely to remain solid 10%
given the low interest rate environment
Yield relativities are changing with industrial and 8%
healthcare yields pushing below office and retail,
reflecting confidence in the growth outlook
6%
Table 1. Australian economic forecasts
Retail
Jun-21 Jun-22 Jun-23 Office
4% Healthcare
Real GDP %pa 9.5% 2.8% 2.9% Industrial
Final demand %pa 12.0% 3.7% 2.2%
Employment %pa 6.5% 1.1% 1.4% 2%
Dec-11 Dec-13 Dec-15 Dec-17 Dec-19 Dec-21
Goods imports %pa 17.7% 2.4% 2.2%
Retail sales %pa (real) 8.8% 0.8% 1.3% Source: JLL Research, MSCI
CPI %pa 3.8% 3.0% 2.5%
90 Day bill % 0.0% 0.1% 0.8%
10yr Bond % 1.2% 2.0% 2.0%
AUD/USD 0.73 0.71 0.71
Source: Deloitte Access Economics, December 2021
Australian Real Estate Quarterly Review | Q1 2022 Page 3 of 13
Inflation and interest rates

What are the implications of inflation?                       Figure 4. Supply chain effects apparent in household and
                                                              transport components of inflation
Pandemic-induced increases in government spending
and stimulus combined with pressure on global supply
chains have had impacts on inflation via both ‘push           Clothing and Footwear

and pull’. The possibility of a sustained period of                   Communication
                                                                            Insurance
higher inflation has raised questions about interest                             F&B
rates and asset prices.                                                       Housing

Our base case view is that inflation fears for Australia                    Education
                                                                            Recreation
are overstated with impacts temporary. This view is             Alcohol and tobacco
based on the expectation that supply chain pressures                            Health
will ease over the next two years and oil prices will                       Household
settle down as demand and supply adjust. The view is                         Transport
also consistent with most economists’ forecasts                                    All

(Figure 5).                                                                          -6%   -4%   -2%    0%      2%       4%     6%        8%    10%     12%

However, there is a potential scenario that would see         Source: ABS (Q3 2021)
inflationary pressures become entrenched over a
longer period. Much depends on the pandemic and the
actions of central banks. The risk for real estate is that    Figure 5. Consensus forecasts for Australian CPI have it
if central banks lift interest rates more aggressively or     returning to the target band, but risks are to the upside
higher inflation expectations get priced into bond                                                         Forecaster range          Target range
yields.                                                       4.0%

                                                              3.5%
While higher interest rates/bond yields can be a              3.0%
headwind for real estate valuations by increasing the         2.5%
cost of capital, there is a weak relationship between         2.0%
asset pricing and interest rates due to the feedback          1.5%
loop with economic growth. Expected inflation is linked       1.0%
to rising bond yields, however, it can also lead to faster    0.5%
rent growth through stronger occupier markets, by             0.0%
pushing up development costs, or via inflation clauses        -0.5%
or turnover clauses in leases (where these exist). For        -1.0%
this reason, inflation caused by strong economic                   Jun-16         Jun-17    Jun-18     Jun-19        Jun-20      Jun-21        Jun-22

growth (demand-pull) will see better outcomes for real
                                                              Source: ABS, Bloomberg
estate than one caused by supply chain constraints
(cost-push). There is evidence of both demand-pull
and cost-push inflation in the current environment.           Figure 6. Relationship between Sydney office capital growth,
In real estate, it is growth in market rent that is the key   effective rental growth and government bond yields
driver of performance rather than the structure of rent
reviews in leases. Figure 6 highlights how real estate
performance has benefited during past periods of
rising bond yields because of the market rent effect.
There are some other mitigating factors. During the
ultra-low-interest rate environment of recent years,
discount rates have typically not fallen as far as bond
yields. The widening of the implied market risk
premium may act as a shock absorber if bond yields
increase. It is also possible that interest rates will not
need to rise much to reach ‘neutral’ levels given the
sensitivity of the Australian household sector to
mortgage rates.
It is true that generally low interest rates may make
                                                              Source: JLL, MSCI, RBA, Dexus Research
real estate yields more sensitive to interest rates.
However, strong investor demand and high levels of
unallocated capital should help support real estate
asset values.

Australian Real Estate Quarterly Review | Q1 2022                                                                             Page 4 of 13
Performance and transactions

Real estate performed well in 2021                                    Figure 7. Divergence between indexes as the A-REIT index
                                                                      soars
Both listed and unlisted real estate performed well in
2021. Australian listed real estate finished the year                                                  ASX S&P 200 A-REIT Index                 ASX S&P 200 Index

strongly with the ASX 200 A-REIT index (+8.9%)                         Index: 100= Dec 10

outperforming the ASX S&P 200 index (+1.5%) in the                     220

latter half of the year, as equities felt the effects of               200

Omicron and a slide in the mining sector. REITs                        180
outperformed due to the strong performance by                          160
industrial REITs and fund managers. Retail REITs also
                                                                       140
saw an improvement.
                                                                       120
Unlisted fund continued to strengthen, helped by                       100
firming valuations. Of the 13.1% return in the year to
                                                                           80
December, 4.4 percentage points was income return                           Dec-11              Dec-13             Dec-15            Dec-17          Dec-19                Dec-21
and 8.4 percentage points capital gain. Industrial funds
have significantly outperformed the other sectors over                Source: Bloomberg, Dexus Research
the past year, followed by diversified and office funds.
The transaction market finished the calendar year with                Figure 8. Demand for office assets turns more positive in
a record high deal volume of $46bn, with office                       the back half of 2021
transactions increasing towards the back half of the
                                                                                      Office                         Industrial                   Mixed portfolio
year. Over the quarter, Dexus and its partners                                        Retail                         Foreign %                    Average foreign
capitalised on the growing domestic and foreign                       $bn
demand for exposure to the Sydney CBD. Dexus                          25                                                                                                            45%

received proceeds from the sale of a 50% stake in                                                                                                                                   40%

Grosvenor Place for $925m and exchanged contracts                     20                                                                                                            35%

for the sale of 383 Kent Street and 309-321 Kent                      15
                                                                                                                                                                                    30%

Street.
                                                                                                                                                                                    25%

                                                                                                                                                                                    20%
                                                                      10
Industrial transactions showed little sign of slowing                                                                                                                               15%

down with yearly volumes pushing to a record $18bn.                    5                                                                                                            10%

                                                                                                                                                                                    5%
Airport land continues to be sought-after with LOGOS                   0                                                                                                            0%
purchasing Qantas’s Sydney Industrial Portfolio for                              2016                2017          2018             2019          2020              2021

$800m. Dexus remained active with the purchase of
12 Church Street, Moorebank with plans for a multi-                   Source: JLL Research, Dexus Research
unit last mile estate. Blackstone also secured a stake
in the Dexus Australian Logistics Trust by acquiring
                                                                      Figure 9. Fund index returns cool off after a strong year
GIC’s 49% interest for $2.1bn.
                                                                      recovery and growth
Investors are becoming more interested in shopping
                                                                                        Industrial        Office     Retail       Diversified
centres with retail transaction volumes surging over                       %pa

the quarter and finishing the calendar year at double                       30

the prior year .Investor interest is improving due to                       20
better relative yields and a promised end to COVID
lockdowns. Location and tenancy mix far outweigh the                        10

type of asset regarding performance. Dexus                                  0
Wholesale Property Fund increased its stake in
Warringah Mall for $410m.                                                  -10

Table 2. Index returns to December 2021                                    -20

                                   Qtr.%         1 yr         3 yr         -30
                                                                             Nov-11              Nov-13            Nov-15            Nov-17          Nov-19                Nov-21
                                                %p.a.        %p.a.
A-REITs5                              10.1        26.1        12.8    Source: MSCI, Dexus Research
Australian shares2                     2.1        17.2        13.6
Unlisted property4                     4.7        13.1          5.6
                 3
Australian cash                        0.0         0.0          0.6
Australian fixed interest1            -1.5        -2.9          2.9
Source:1BACM0     Index,
                      2S&P/ASX.200.   Accumulation Index,3BAUBIL

Index, 4MSCI Mercer Australian Core Wholesale Monthly PFI (NAV Pre
Fee) – All Funds, 5S&P/ASX.200.A-REIT Accumulation Index

Australian Real Estate Quarterly Review | Q1 2022                                                                                                    Page 5 of 13
Office
Office outlook appears to be improving Figure 10. CBD office net absorption continues its
positive trend in line with business confidence
Australia’s CBD office markets improved in the latter
half of 2021 after a difficult period. Business ‘000sqm
Net absorption in 4 major CBDs Business Confidence (RHS)
confidence, an important lead indicator for office 150 20
markets, was positive in December. Professional job 100
advertisements, an indicator of corporate hiring 0
50
intentions, continued to rise in November (up 2.6% on
-20
the previous month) and white collar employment 0
growth is positive. Net absorption in Australia’s four -50
-40
major CBDs has been positive for the past three
-100
quarters (Figure 10). -60
-150
Vacancy rates remained largely stable in Q4 2021, with
falls recorded Brisbane CBD, North Sydney, -200
Dec-11 Mar-13 Jun-14 Sep-15 Dec-16 Mar-18 Jun-19 Sep-20 Dec-21
-80
Parramatta and Sydney CBD (mainly due to stock
Source: JLL Research, ABS, Dexus Research.
withdrawals). In the Sydney CBD, while there were
some expansions, demand was driven by smaller
firms, with some larger firms offering up sub-lease Figure 11. Face rents appear to be holding, with
space. In Melbourne, sub-lease vacancy rose further incentives appearing to stabilise in key office markets
to 3.7% of stock. Recent leasing deals show that
Syd CBD Melb CBD Bris CBD Perth CBD
flexibility clauses are more common, providing $/sq m
$900
companies with some ability to increase or decrease
their footprint as their future requirements change. $800
$700
Uncertainty around changing COVID-19 rules is now $600
being cited as the major reason for companies $500
delaying a return to the physical office, with the latest $400
Omicron strain of the virus delaying return-to-office $300
dates until at least February 2022. Longer-term $200
structural questions about office demand in a more $100
flexible working environment are yet to be definitively $-
answered. While flexibility will remain popular, the Dec-11 Dec-13 Dec-15 Dec-17 Dec-19 Dec-21
nature of individual hybrid working models is still being Source: ANZ
evaluated by companies. Interestingly, while there has
been a 95% rise in the number online job
advertisements explicitly offering working from home Figure 12. Vacancy rates fall in Sydney and stabilise in
arrangements, the total number of these jobs is still other CBD markets
less than 6% of the total. Syd CBD Melb CBD Bris CBD Perth CBD
25%
It appears that rent growth may be turning the corner
in CBD markets (except for Brisbane), with incentives 20%
stabilising. Yields remained relatively stable in Q4
2021. 15%
Table 3. Q4 2021 office snapshot 10%
Rent Increase in
Total 5%
growth* stock to
Vacancy
(% p.a.) 2024**
0%
Sydney CBD 12.5% 0.7% 6.9% Dec-11 Dec-13 Dec-15 Dec-17 Dec-19 Dec-21
North Sydney 17.3% -0.9% 9.7%
Source: JLL Research, Dexus Research
Sydney Fringe 10.4% 3.1% 3.1%
Macquarie Park 12.8% 0.6% 5.9%
Parramatta 12.1% -1.3% 17.8%
SOP / Rhodes 20.0% 0.0% 13.6%
Melbourne CBD 15.0% -0.7% 8.7%
Brisbane CBD 15.5% -1.8% 5.4%
Perth CBD 19.1% 0.0% 13.7%
Source: JLL Research, Dexus *Net effective, **estimate as a % of stock
Australian Real Estate Quarterly Review | Q1 2022 Page 6 of 13Office market wrap
Direction of
Market Comments trend for next
12 months
Sydney CBD Sydney CBD appears to be turning the corner as incentives stabilise. Prime incentives remained Vacancy ↓
stable at 34% in Q4 2021, while net face rents grew 1.2%, leading to effective growth of 0.7%. The
total vacancy rate fell to 12.5%, though this was largely due to withdrawal of stock. While expansions Rents →
were evident, led by Amazon (25,346 square metres) and NSW Government (8,000 square metres),
extra sub-lease space was offered by some larger organisations, like Westpac (6,722 square metres) Incentives →
and WeWork (6,498 square metres). Annual net absorption was positive at 29,700 square metres.
Yields were stable in Q4 2021, although a number of transactions in the first quarter of 2022 are Yields ↓
expected to drive them lower.
North Sydney Relocations drove positive tenant take-up, driving vacancy rates lower. The total vacancy rate Vacancy →
fell to 17.3% as a number of occupiers moved into the market from suburban markets in Sydney
including Macquarie Park. The sizeable supply pipeline expected to be delivered over the next 5 years Rents →
(more than 35% of total stock) is expected to slow the market recovery, with secondary and lower A
Grade stock being at risk of losing tenants to better quality buildings. While net face rents grew 3.8% Incentives →
in 2021, competitive leasing deals saw incentives remain elevated at 35%, leading to effective rents
falling by 7.3%. Prime investment yields remained stable in the latter half of 2021. Yields ↓
Parramatta Pre-leasing activity is driving positive net absorption but supply likely to be an ongoing issue. Vacancy ↑
Parramatta’s vacancy rate fell 80 basis points to 12.1%, on the back of pre-leasing activity. Several
leases in existing buildings were also recorded (15,400 square metres), mainly in better quality stock. Rents ↓
The elevated supply pipeline means that rent growth is likely to be challenged going forward. Prime
net effective rents fell further in Q4 2021 (-1.3%), with a fall of 10.4% over calendar 2021. Ongoing Incentives ↑
development activity over the next 5 years is likely to further exacerbate an already distinctly two-
tiered market, with newly built stock likely to attract a sizable rent premium over existing lower quality Yields →
stock. Prime investment yields remained stable over Q4 2021.
Sydney Olympic Market feeling the effects of COVID-19 through slower demand. Net absorption across the two Vacancy →
Park/Rhodes precincts totalled 14,960 square metres over the past year, helped by leases from NSW ambulance
(17,000 square metres) and NSW Health (for the Sydney Olympic Park Vaccination Centre). However, Rents →
moves out of the market by Commonwealth Bank and Link Market Services reduced the net demand.
The vacancy rate fell slightly to 20.0%. While there is some demand for smaller tenancies the Incentives →
uncertain pandemic conditions are constraining larger deals. There is effectively no supply projected
other than the pre-committed Hewlett Packard building in 2024. Face and effective rents remained Yields →
stable over the year.
Melbourne CBD Vacancy rate remains elevated at 15.0% and the market will take time to recover. The sub-lease Vacancy ↑
vacancy in Melbourne CBD remained elevated at 3.7%, leaving the total vacancy rate unchanged from
the previous quarter, as occupier sentiment affected by the underperformance of the Victorian Rents →
economy after ongoing lockdowns in 2020 and 2021. Net absorption in the Melbourne CBD was
positive at 12,708 square metres in Q4 2021. The supply pipeline remains elevated, with recent Incentives →
completions making it the largest market nationally for the first time. Prime incentives remained at
elevated levels (38%), with net effective rents falling by 7.3% over 2021. Prime investment yields Yields →
stayed flat at 4.8% in the December quarter.
Brisbane CBD Risk of planned new supply is likely to keep rental growth expectations muted. The total Vacancy ↑
vacancy rate in Brisbane CBD fell 30 basis points to 15.5%. Net absorption was 11,770 square metres
in Q4 and 8000 square metres in 2021. Although net face rents rose marginally (0.7%), prime Rents ↓
incentives rose further to 43%. Rising incentives tempered effective growth with effective rents
contracting 7.8% in 2020. Like other markets, a lack of transaction activity saw prime investment yields Incentives →
hold over 2021. After a long period of weakness, market recovery still seems some way off and the
risk of planned new supply is likely to keep rental growth expectations muted. Yields →
Perth CBD Market relatively slow and stable but has upside given a lack of immediate supply risk. Vacancy, Vacancy ↓
rents and yields in the Perth CBD remained stable in Q4 2021. Annual net absorption was a subdued
5,915 square metres in 2021 in a generally improving economy. Office occupancy levels are Rents ↑
consistently the highest of any CBD market nationally, with the market relatively insulated from the
impacts of COVID-19 by border restrictions. Face and effective rents held steady in the December Incentives ↓
quarter. A considerable state budget surplus in conjunction with a strong resources sector and a
limited supply pipeline offer green shoots for the long-ailing market. Yields ↓
Australian Real Estate Quarterly Review | Q1 2022 Page 7 of 13Industrial
Momentum likely to carry into 2022 Figure 13. National demand hits record levels, running at
double the past average rate of take-up
The Australian industrial market continues to be the
success story in what has been another roller coaster Million sqm
year. Demand for industrial space almost doubled over 5.0
the 2021 calendar year nationally, with growth 4.5
concentrated in Sydney and Melbourne. The growth 4.0
was attributable to logistics firms and retailers 3.5
investing in extra distribution space to cater for last 3.0
10yr average = 2,438,843sqm p.a.
mile fulfilment as well as the need to house extra 2.5
inventory to protect against shortages. Although 2.0
identified ecommerce related take-up was slightly 1.5
below 2020 levels, much of this demand is being 1.0
picked up in the logistics sector. 0.5
0.0
National vacancy continued to fall, hitting a record low Dec-11 Dec-13 Dec-15 Dec-17 Dec-19 Dec-21
of 1.3% according to CBRE, with Sydney the lowest Source: JLL Research, Dexus Research
market at 0.4%. The supply constrained markets of
Inner West and South Sydney both experienced the
strongest rent growth over the quarter with 2.8% and Figure 14. The Sydney market experienced the largest
3.4% respectively. Effective rents are increasing with quarterly change in rent growth
incentives in the Inner West market falling below 10% Outer West Sydney West Melbourne
$/sqm
compared to 14% last year. 140
South Brisbane East Perth
130
Strong demand and low vacancy combined with a lack
of immediately serviceable land is driving up land 120
values. West Melbourne and Outer West Sydney 110
climbed another $100/sqm (2-5ha) over the quarter 100
while East Perth climbed above $400/sqm (1ha) for 90
the first time in six years. While most development is 80
pre-leased, with over 800,000sqm committed over the 70
2021 calendar year in Outer West Sydney and West 60
Melbourne, speculative development is increasing to 50
take advantage of conditions and seek a premium on Dec-11 Dec-13 Dec-15 Dec-17 Dec-19 Dec-21
rents.
Source: JLL Research, Dexus Research
Portfolio sales continue to lead the market resulting in
positive revaluations for industrial assets. Blackstone
Figure 15. Average prime cap rates in Outer West Sydney
recently purchased a 49% stake representing GIC’s
interest of the Dexus Australian Logistics Trust for and West Melbourne finished the year below 4%
$2.1bn across 77 assets geared towards Sydney and Outer West Sydney West Melbourne
Melbourne. Over the past quarter Outer West Sydney 10.0%
South Brisbane East Perth
average prime cap rates are estimated to have
9.0%
compressed a further 25bps to 3.38%. Yields also fell
in Perth and Brisbane. 8.0%
Table 4. Industrial snapshot 7.0%
6.0%
Ave prime cap Existing prime
rate change net face rental 5.0% 4.75%
4.50%
from Q3 2021 growth % p.a. 4.0%
3.63%
West Melbourne - +13.4% 3.0% 3.38%
East Perth -0.25 +8.5% Dec-11 Dec-13 Dec-15 Dec-17 Dec-19 Dec-21
South Sydney -0.19 +5.6%
Source: JLL Research, Dexus Research
Outer West Sydney -0.25 +4.9%
Southern Brisbane -0.25 +4.7%
Source: JLL Research, Dexus Research (Dec 21), land values 2-5HA exl
Perth (1HA)
Australian Real Estate Quarterly Review | Q1 2022 Page 8 of 13Industrial by region
Outer West Sydney Figure 16. Outer West Sydney gross take-up
Take-up levels in the Outer West Sydney market ‘000 sqm
finished the year just as strong as they started. A 1,200
further 154,000sqm was absorbed over the quarter, 1,000
driving volumes to 1.5 times the rate of the prior
calendar year. With vacancy pushing below 1% there
800
has been an increasing need for development. 600
Logistics continues to drive demand for the Outer 400
10yr average = 361,745sqm p.a.
West Sydney precinct. The majority of the leasing
activity over the quarter came from the emerging 200
Kemps Creek precinct. Goodman signed two pre- 0
leases including Australia Post (46,000sqm) in Dec-11 Dec-13 Dec-15 Dec-17 Dec-19 Dec-21
Oakdale West and Yusen Logistics (15,000sqm) in Source: JLL Research (gross take-up), Dexus Research.
Oakdale South.
West Melbourne Figure 17. West Melbourne gross take-up
West Melbourne finished a massive calendar year for ‘000 sqm
leasing with 1.1 million square metres absorbed 1,200
accounting for 59% of the state’s activity. Over the 1,000
past year the West has enjoyed a lot of attention from
ecommerce related retailers, accounting for nearly a 800
quarter of national demand. The precinct offers 600
modern stock with affordable rents and a positive 10yr average = 405,866sqm p.a.
clustering effect for users. At the same time the area 400
has seen growing interest from manufacturers. Over 200
the quarter around 40,000sqm of manufacturing space
was pre-leased/leased including the likes of furniture 0
Dec-11 Dec-13 Dec-15 Dec-17 Dec-19 Dec-21
manufacturer, Krost Furniture. Source: JLL Research (gross take-up), Dexus Research.
Brisbane
Brisbane finished the calendar year as a tale of two Figure 18. South Brisbane and ATC gross take-up
markets. Take-up volumes in the South accounted for ‘000 sqm Southern Brisbane ATC
three quarters of the state’s demand while the Trade 1,200
Coast finished broadly in line with the prior year. The
final quarter of the year saw an influx of manufacturing
1,000
related take-up including Forest One, taking up 800
10,000sqm within Charter Hall’s Motorway Industrial 600
Park and Pope Packaging within Stockland’s 10yr average = 380,038sqm p.a.
Willawong DC. However, retailers have accounted for 400
most of the demand (c. 40%) in the South over the 200
past year. The Trade Coast continues to be tightly held
however the newly announced BNE Auto Mall within 0
Dec-11 Dec-13 Dec-15 Dec-17 Dec-19 Dec-21
the Airport has begun to attract new tenancies to the
Source: JLL Research (gross take-up), Dexus Research
precinct including motor vehicle parts retailer Eagers
Automotive taking up 14,000sqm.
Figure 19. East and South Perth gross take-up
Perth
‘000 sqm East Perth South Perth
Take-up within the Perth industrial market climbed to a 350
record for the calendar year, following strong levels of
demand within the South. A limited amount of quality,
300
prime grade assets (c. 1.8%) prime vacancy) had 250
previously been an issue for the South, however the 200
10yr average = 172,859sqm p.a.
recent purchase of Jandakot Airport by Dexus/DXI will 150
likely bolster development activity. Over the quarter
100
pureplay online retailer Amazon leased 20,000sqm
within the airport precinct, while Tyremax leased 50
9,800sqm representing a diverse leasing pool. 0
Dec-11 Dec-13 Dec-15 Dec-17 Dec-19 Dec-21
Source: JLL Research (gross take-up), Dexus Research
Australian Real Estate Quarterly Review | Q1 2022 Page 9 of 13Retail
Retail spending Figure 19. Discretionary spending is recovering while non-
discretionary spending remains positive
Retail spending recovered strongly following the Q3
2021 lockdown with national turnover rising 5.8% in % per anum Non-Discretionary Discretionary
the year to November. Strong Black Friday sales and 50%
improved consumer sentiment supported the sector. 40%
Since then, a surge in Omicron case numbers, and a 30%
natural decline in mobility has affected spending, with 20%
cafés, restaurants and leisure CBD locations most
affected. Anecdotally, sales over the Christmas period 10%
were similar to last year. 0%
-10%
While the Omicron surge is likely to affect
discretionary spending in the short term, the long-term -20%
view remains positive. The latest ABS sales data -30%
Nov-18 May-19 Nov-19 May-20 Nov-20 May-21 Nov-21
(Figures 19 & 20) showed robust growth in
discretionary categories like clothing, household Source: ABS, Dexus Research
goods, department stores and cafes following the last
lockdown. Consequently, discretionary spending is
expected to outperform non-discretionary over the Figure 20. Retail trade has been volatile throughout the
course of 2022. pandemic, particularly in discretionary categories
Index (Q419 = 100)
The improving outlook for discretionary spending and Food
Department Stores
Household Goods
Other
Clothing
Cafes
reduced probability of further lockdowns given 140
Total
Australia’s high vaccination rate bodes well for the
130
fortunes of larger shopping centres over the next year
after a period of underperformance. In the recent past, 120
smaller centres anchored by supermarkets have 110
performed best, given their reliance on non- 100
discretionary spending (Figure 21). Sales should also 90
be supported by employment growth and an enlarged 80
pool of household savings. 70
City retail remains challenged given the pandemic’s 60
Mar-20 Jun-20 Sep-20 Dec-20 Mar-21 Jun-21 Sep-21
effects on CBD locations and the number of store
closures. Subdued conditions seem likely to continue Source: ABS, Dexus Research
over the next few months as it will take time for office
workers to return to the 70%-80% of workplace
capacity prior to the latest lockdowns. However, 2022 Figure 21. Market rents have been more resilient on average
should be a year of upside from a low base as office in neighbourhood centres than larger centres
workers, tourists and university students slowly return. % per anum Neighbourhood Regional Sub-regional
Table 5. Retail snapshot 1%
0%
Specialty Cap rate State sales
rent growth chge from growth -1%
% p.a. Q3 (ppts) % p.a.
-2%
Sydney -0.3%
-3%
Regional -4.7% -
Sub-regional -0.8% - -4%
Neighbourhood -0.4% -12 -5%
Melbourne 10.3%
-6%
Regional -4.9% - Dec-18 Jun-19 Dec-19 Jun-20 Dec-20 Jun-21 Dec-21
Sub-regional -0.6% - Source: JLL, Dexus Research.
Neighbourhood -0.8% -26
SE QLD 4.7%
Regional -1.9% -
Sub-regional -0.4% -
Neighbourhood +0.1% -
Source: JLL Research, Dexus Research (December 2021)
Australian Real Estate Quarterly Review | Q1 2022 Page 10 of 13Healthcare
Healthcare sector resilient through pandemic Figure 22. Health output consistently growing faster than the
national average, including during the pandemic
Healthcare operators are experiencing pressures from
the Omicron outbreak via unpredictable activity levels % per annum Health Output National output
and staffing challenges. However, real estate investors 20%
are largely protected from this short-term uncertainty
due to the nature of their lease arrangements with 15%
operators. 10%
While public hospitals are experiencing rising COVID-
5%
19 admissions, private hospitals and specialist
services are also affected, being likely to face 0%
restrictions on elective surgeries in the short term.
Medical practices are experiencing high demand and a -5%
switch back to telehealth. Pathology have experienced -10%
a boom in demand for PCR tests, although this Sep-16 Sep-17 Sep-18 Sep-19 Sep-20 Sep-21
pressure should ease as rapid antigen tests become
Source: DAE
more widely adopted and accepted.
Investors can take a number of positives from the
current situation. These are that large parts of the Figure 23. Healthcare transaction volumes have increased
health sector are running at capacity (rather than over time, reflecting greater investor participation
being oversupplied) and the sector has grown at a $ billion
faster rate than the whole economy during the 1.6
pandemic. 1.4
Investor interest in healthcare real estate continues to 1.2
firm as both listed and unlisted institutional investors 1.0
increase their exposure. Transaction volumes have
0.8
steadily risen in recent years. A degree of uncertainty
about the inflation outlook in recent months has further 0.6
increased the attractiveness of the natural inflation- 0.4
hedging nature of some healthcare leases (which are 0.2
often triple-net leases with CPI+ reviews).
-
2010 2011 2012 2013 2014 2015 2016 2017 2018 2019 2020 2021
Increasing liquidity and the perception of a more
reliable growth outlook than other sectors has led to Source: Real Capital Analytics (excludes corporate transactions)
the adoption of generally lower return expectations.
With risk premiums falling in recent years, discount
Figure 24. Discount rates for healthcare fall, reflecting higher
rates have fallen to similar levels as the traditional real liquidity and lower risk premiums
estate sectors (see figure 24). These trends have led
to significant capital gain and lower income yields. 13%
Office Industrial Retail Hospitals
Returns for healthcare have been attractive relative to
12%
other sectors through the pandemic.
11%
Major healthcare managers like Dexus, Australian
Unity and Northwest are seeking to enhance returns 10%
by focusing on the development of medical precincts, 9%
following similar trends in more established markets 8%
like the US and the UK. Partnerships with the
government and education sectors are also 7%
increasing. Most recently, UNSW received 6%
development approval for the UNSW Health 5%
Translation Hub, which will result in a 35,600 square Sep-97 Sep-01 Sep-05 Sep-09 Sep-13 Sep-17 Sep-21
metre clinical health, education and research building Source: MSCI, Dexus Research
delivered by 2025.
Australian Real Estate Quarterly Review | Q1 2022 Page 11 of 13Dexus Research Peter Studley Shrabastee Mallik James Melville Head of Research Senior Research Manager Research Manager d: +61 2 9017 1345 d: +61 2 9017 1320 d: +61 2 9017 1181 e: peter.studley@dexus.com e: shrabastee.mallik@dexus.com e: James.Melville@dexus.com Matthew Persson Research Analyst d: +61 2 9080 4950 e: matthew.persson@dexus.com Australian Real Estate Quarterly Review | Q1 2022 Page 12 of 13
Disclaimer
This report makes reference to historical property data
sourced from JLL Research (unless otherwise stated),
current as at ‘Q4/2021’. JLL accepts no liability for
damages suffered by any party resulting from their use
of this document. All analysis and views of future
market conditions are solely those of Dexus.
Issued by Dexus Funds Management Limited ABN 24
060 920 783, Australian Financial Services Licence
holder. This is not an offer of securities or financial
product advice. The repayment and performance of an
investment is not guaranteed by Dexus Funds
Management Limited, any of its related bodies
corporate or any other person or organisation. This
document is provided in good faith and is not intended
to create any legal liability on the part of Dexus Funds
Management Limited.
This economic and property analysis is for information
only and Dexus Funds Management Limited
specifically disclaims any responsibility for any use of
the information contained by any third party. Opinions
expressed are our present opinions only, reflecting
prevailing market conditions, and are subject to
change. In preparing this publication, we have
obtained information from sources we believe to be
reliable, but do not offer any guarantees as to its
accuracy or completeness. This publication is only
intended for the information of professional, business
or experienced investors.

                                                                                         dexus.com

                                                                                   Responsible Entity
                                                                   Dexus Funds Management Limited
                                                                                   ABN 24 060 920 783
                                                           Australian Financial Services License Holder
                                                                             (License Number 238163)
                                                                                     Registered Office
                                                                           Level 25, 264 George Street
                                                                                    Sydney NSW 2000
                                                                                              Australia
                                                                                        PO Box R1822
                                                                           Royal Exchange NSW 1225
                                                                                              Australia
You can also read