Modelling the Source and Fate of Nitrate-Nitrogen
    Losses from Waimea Plains Land Uses
            Envirolink Advice Grant:
                 1592-TSDC116
←
→
Page content transcription
If your browser does not render page correctly, please read the page content below
Modelling the Source and Fate of Nitrate-Nitrogen
Losses from Waimea Plains Land Uses
Envirolink Advice Grant:
1592-TSDC116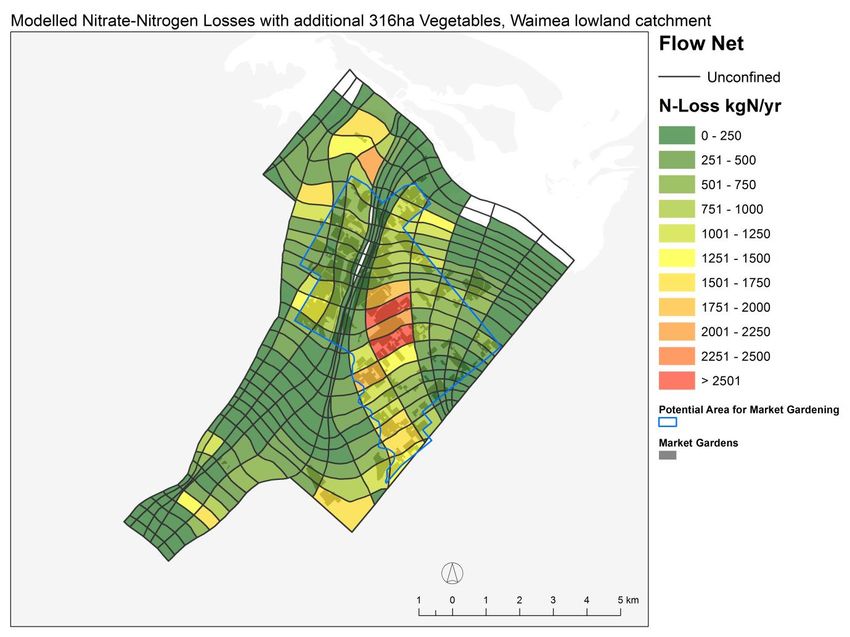
Modelling the Source and Fate of Nitrate-Nitrogen Losses from
Waimea Plains Land Uses

Andrew Fenemor, Robbie Price

Landcare Research

Steve Green

Plant & Food Research

Prepared for:

Tasman District Council

189 Queen Street
Private Bag 4
Richmond
Nelson, 7050
New Zealand

January 2016

Landcare Research, 1st Floor, 24 Nile Street, Private Bag 6, Nelson 7042, New Zealand,
Ph +64 3 545 7700, www.landcareresearch.co.nz

Reviewed by:                                Approved for release by:

Mary-Anne Baker                             Chris Phillips
Glenn Stephens                              Portfolio Leader – Managing Land & Water
Tasman District Council                     Landcare Research

Landcare Research Contract Report:          LC2459

Disclaimer
This report has been prepared by Landcare Research for Tasman District Council. If used by other parties, no
warranty or representation is given as to its accuracy and no liability is accepted for loss or damage arising
directly or indirectly from reliance on the information in it.

© Landcare Research New Zealand Ltd and Tasman District Council 2016
This information may be copied and distributed to others without limitation, provided Landcare Research New
Zealand Ltd and the Tasman District Council are acknowledged. Under no circumstances may a charge be made
for this information without the written permission of Landcare Research and the Tasman District Council.
Contents

Summary ..................................................................................................................................... v

1       Purpose .............................................................................................................................. 1

2       Approach Taken ................................................................................................................. 1

3       Representative Farm Systems selected for modelling ...................................................... 2

        3.1      Pipfruit ................................................................................................................................. 2

        3.2      Dairy .................................................................................................................................... 3

        3.3      Grapes ................................................................................................................................. 3

        3.4      Outdoor vegetables ............................................................................................................. 4

4       SPASMO Crop Production and Nutrient Loss Modelling ................................................... 6

5       Assumptions and uncertainty............................................................................................ 6

6       SPASMO modelled Nitrate-Nitrogen Leaching Responses................................................ 7

7       Nitrate Loss Pattern from current Land Uses .................................................................. 12

8       Modelling Nitrate reaching Receiving Waters ................................................................ 15

9       Summary of Mitigation Methods .................................................................................... 21

10      References ....................................................................................................................... 22

Landcare Research                                                                                                                                Page iii
Summary
This modelling project has assessed nitrate-nitrogen losses to groundwater and downstream
waters generated by current land uses and projected future land use scenarios.

Results are being used by the Waimea Freshwater and Land Advisory Group (FLAG) to
inform their recommendations to Tasman District Council on management of water quality in
the Waimea catchment. Nitrogen is the focus as nitrate concentrations may exceed aquatic
toxicity and/or periphyton limits for spring-fed streams and drinking water standards in some
aquifers.

Modelling of nitrate–nitrogen leaching losses was carried out using the SPASMO model for
40 years to 2013 for apples, grapes, outdoor vegetables, and dairy land uses on the four major
soil series of the Waimea Plains. Averaged nitrate losses were:

                               Dairy           Apples   Grapes     Outdoor      Other     Forest &
                                                                                                 †
                                                                  vegetables   pasture*    scrub
N-NO3 loss kgN/ha/yr          24–69            3–18     4–18        16–51        10.7       2.5
* represents SPASMO modelled losses for extensive sheep and beef farming
†
    an adopted average value from literature

Modelling shows there is little difference between nitrate losses for the same land use with or
without irrigation; however, irrigation allows more intensive land use, which does produce
higher nutrient losses.

Soil water-holding capacity is a much greater determinant of nitrogen losses than irrigation.
Plains soils generating highest nitrate leaching rates are Ranzau, then Waimea and Wakatu
soils.

Total modelled nitrate loss from the 40600 ha of the lowland Waimea catchments is 287
tonnes per year.

Groundwater flow tube analysis for various scenarios of converting pasture to outdoor
vegetable production (market gardening) predicted that nitrate concentrations in the spring-
fed Pearl Creek could increase by 0.44 to 0.48 g/m3 for 200–562 hectares converted. For the
spring-fed Neimann Creek, equivalent increases in nitrate concentration would be 0.54 to
1.06 g/m3, slightly increasing the risk of exceeding acceptable aquatic ecosystem limits,
depending on what values those limits are ultimately based.

Landcare Research                                                                            Page v
1 Purpose The Waimea Freshwater and Land Advisory Group (FLAG) is charged with recommending policy and rules relating to water quality management in the Waimea catchment. Previous monitoring and research indicates that the leaching of nitrate-nitrogen (‘nitrate’) from intensive land uses across the Waimea Plains will require specific attention, because nitrate concentrations and/or loads in some receiving waters either currently or in future may exceed guideline limits. Tasman District Council has commissioned this modelling work to help FLAG members evaluate nitrate losses from various land uses, understand the flow paths and any attenuation of leached nitrate, and assess projected concentrations in both aquifers and downstream surface waters under current and potential future land use patterns. This work builds on current knowledge of the hydrology of the Waimea Plains, and a recent scoping study for the Waimea Water Augmentation Committee on water quality risks and responses with increased irrigation (Fenemor et al. 2013). Primarily it draws on hydrological and land use modelling work completed for MPI that examined crop production, profit, and nutrient losses in relation to irrigation water allocation and reliability (Fenemor et al. 2015). This project was funded under Envirolink grants TSDC112 and TSDC116 (http://www.envirolink.govt.nz/). A draft of this summary report was presented to and discussed with the Waimea FLAG members at their meeting of 19 August 2015. 2 Approach Taken Nitrate leaching losses through the soil profile were modelled for selected Waimea Plains farm-soil combinations and a 40-year time series of climate in two previous studies using the Plant & Food Research SPASMO model (Green et al. 2012). Modelled results have been applied in this project to create catchment maps of nitrate losses to groundwater for current land use and projected future land use scenarios. Steady-state maps of groundwater flow direction (‘flow nets’) have been superimposed to calculate aggregated nitrate losses into receiving waters which comprise the three aquifers, the Waimea River, spring-fed streams, and the Waimea Inlet. Aggregated losses for current land use have been compared with measured nitrate concentrations in receiving waters to check how realistic this modelling approach is, and what reliance might be placed on projected concentrations for assumed future land uses. Initial results of the nitrate loss modelling were presented in a discussion document by Andrew Fenemor and a presentation on SPASMO by Steve Green at the Waimea FLAG meeting of 18 June 2015. FLAG members requested more analysis of the impacts of land uses along groundwater flow paths draining towards receiving waters, which is the basis for the flow net analysis presented below, and was discussed at their meeting of 19 August 2015. Landcare Research Page 1
Modelling the Source and Fate of Nitrate-Nitrogen Losses from Waimea Plains Land Uses
3 Representative Farm Systems selected for modelling
Rather than selecting a particular land use at paddock scale, the modelling of production,
irrigation water use, and nutrient leaching need to take account of the variability of operations
at the whole farm scale. This is because of changes in crop mixes over time, movement of
animals to and from a property, and allowance for areas of a property used for support rather
than production activities.
Based on the criteria of predominance of land use by area, commercial scale farming types,
and likely relative responses to irrigation water availability and nutrient leaching, we have
selected the following farm systems:
Pipfruit – a typical apple orchard
Dairy – a typical dairy farm
Grapes – a typical vineyard
Outdoor vegetable production – a typical large-scale market gardening operation,
excluding glasshouse production
Characteristics of each of these farm systems are summarised below. For the remainder of the
catchment, a nitrogen loss rate from literature figures has been adopted for forest and scrub,
and a proxy land use of unirrigated extensive sheep and beef has been adopted for modelling
losses from the predominantly pasture land use.
3.1 Pipfruit
This is an intensive 40-ha apple orchard planted at 3.4 × 1.2 m spacing, corresponding to the
MPI model orchard. The variety mix is 20% Royal Gala, 20% Braeburn, 20% Jazz, 20% Pink
Lady, and 20% other premium varieties.
Due to a greater volume of intensive orchards and higher level of management on the
Waimea Plains, average yield is 67.9 T/ha, which is slightly higher than the 58 T/ha from the
2013 MPI model orchard. Packout is set at 78% (cf. 75% from MPI model) and average fruit
size at 106 (170 g). Unharvested fruit are assumed at 10% and apple dry matter content as
0.16.
Market returns for apples are averaged from the past 5 years as this includes good years and
poor, which should reflect future volatility. Average price was $23.93 per carton based on
2010–12 data from Pipfruit NZ and 2013–14 data from ENZA. Modelled returns are adjusted
from these actual averages based on modelled fruit size and weight.
The fertilizer regime is assumed to involve application of 40 kg N per year, applied as
20 kg/ha post-harvest foliar spray and 20 kg/ha solid fertilizer applied in spring.
Approximately 10% of the planted area is non-producing at any time.
Page 2 Landcare ResearchModelling the Source and Fate of Nitrate-Nitrogen Losses from Waimea Plains Land Uses 3.2 Dairy There are approximately 1000 dairy cows farmed in the central Waimea Plains on five farms. The dairy farm system has been based on data from Dairy NZ (2012) and information kindly provided by Murray King of Kingsway Farms, Appleby. The model farm is 80 ha with 3.4 cows/ha and a herd of 272 cows, with a targeted annual milk solids production of 1500 kgMS/ha/yr1 and average annual dry matter production of 16 000 kgDM/ha/yr. Market returns for dairy are averaged from the past 5 years at $6.00/kgMS, but obviously higher than current (2014) returns. When drought occurs, the farm first uses its own supplements, none of which are assumed to have been sold off the property. Bought-in dry matter (DM) supplements are modelled as costing $0.25/kg. If own supplements are insufficient, off-farm supplements are purchased up to $0.38/kgDM up to a maximum of 750 kgDM/ha. If feed reserves are low, poorer performing cows would start being dried off after Christmas. In the modelling this is assumed to happen in blocks of 20% of the stock. The modelled farm assumes 25% of paddocks are excluded from grazing between October and December for silage or hay production, unless there is inadequate DM for the herd. Wintering on averages 1 cow/ha, with the remainder wintered outside the plains. Younger stock are preferentially wintered off. There is no longer any winter milking on the Waimea Plains. The fertilizer regime assumes 180 kgN/ha applied as six 30-kg/ha applications. 3.3 Grapes The design vineyard is 9 ha, corresponding to the average size among Nelson winegrowers. It is an owner-operated, self-contained, contract-supply vineyard, and is machine harvested. Grapes are planted at a spacing of 2.4 × 1.8 m. Following analysis of New Zealand Winegrowers statistics and discussion with Phillip Woollaston of Woollaston Estates, the assumed varietal mix for the Waimea Plains is 55% Sauvignon Blanc, 15% Pinot Noir, 15% Pinot Gris, 5% Chardonnay, and 10% other varieties. Average yield is 9.0 T/ha, comprising 11 T/ha for Sauvignon Blanc, 6 T/ha for Pinot Noir, 9 T/ha for Pinot Gris, and 8 T/ha for Chardonnay and other varieties. Modelled returns are calculated from weighted returns for each variety and average $1360/tonne. The fertilizer regime applies an average of 5kg N per year, although in some vineyards this is applied as an ‘organic’ form and would range from 0 to 20 kgN/ha/yr. 1 Mirka Langford (Fonterra and Waimea FLAG member) advised after presentation of this report at the Waimea FLAG meeting on 19 August 2015 that the average milk solids production from Waimea dairy farms is slightly lower, i.e. less intensive, than assumed in this analysis: 1383 instead of 1500 kgMS/ha/yr. This would have the effect of marginally reducing the modelled nitrogen losses reported from dairy land uses later in this report. Average modelled milk production is in the 1450–1460 kgMS/ha/yr range. Landcare Research Page 3
Modelling the Source and Fate of Nitrate-Nitrogen Losses from Waimea Plains Land Uses

3.4      Outdoor vegetables

The wide range of vegetable crops and rotations used on the Waimea Plains has made it
difficult to devise a representative outdoor market gardening operation able to be modelled in
SPASMO.

There are three large grower operations each with some 200 ha cropped, plus smaller
operators. The use of leased land is common. Growers express a preference for market
gardening on a band of land extending from Wairoa Gorge across towards Rabbit Island (Fig.
1) because of the breeze, lower risk of frosts, and more suitable soils (Pierre Gargiulo, Ewers
Ltd, pers. comm.).

Figure 1 Potential market gardening area (dappled green)(Pierre Gargiulo, via Glenn Stevens TDC)

The design market garden for SPASMO modelling is an owner-operated self-contained
outdoor operation with 45 ha available for planting. In a 12-month cycle this 45 ha has 45 ha
of winter lettuces; in Spring/Summer 15 ha are rested (grazed pasture) or – as assumed for
this modelling – a further lettuce crop planted, and there are 15 ha of cabbages and 15 ha of
pumpkins. For modelling purposes this comprises a two-crop annual cycle, either
lettuce/lettuce, lettuces/cabbages, or lettuce/pumpkins.

At six heads per crate, market returns have averaged $8.50/crate for winter lettuces,
$5.85/crate for summer lettuces, $4.00/crate for cabbage, and $0.60/kg for pumpkins.

Page 4                                                                                    Landcare Research
Modelling the Source and Fate of Nitrate-Nitrogen Losses from Waimea Plains Land Uses

The fertilizer regime, as suggested following the Waimea FLAG April 2015 meeting is
shown in Table 1(a) and projected yields in Table 1(b).

Table 1(a) Outdoor vegetables fertilizer regime

              Crop                                                     N           P           K
              Lettuces             Planting                            47          34          90
                                   6 wks later                         61          25          73
                                   2 wks from harvest                 117          8           21
                                   Total                              225          67          184
              Cabbages             Planting                            61          41          132
                                   6 wks later                         57          23          65
                                   2 wks from harvest                  57          23          65
                                   Total                              175          87          262
              Pumpkins             Planting                            32          22          58
                                   4 wks later                         25          13          34
                                   Total                               57          35          92

We note that the N and P applied to lettuces seems high compared with fertilizer company
recommendations.2

Table 1(b) Outdoor vegetables projected yields for model calibration

              Product                      Gross              Harvested            TOTAL
                                           production                              harvested
                                           (t/ha)                                  (t/ha)
              Lettuce                                   15                  70%                 10.5
              Pumpkin                                   25                  90%                 22.5
              Cabbage                                   65                  60%                 39.0
              Fallow/ Green Crop                          0                 0%                     0.0

The difference between gross production and harvested allows for losses, either unharvested
parts of a crop or whole unharvested paddocks, and uses actual data from a Waimea grower
for brassicas and pumpkins, and an estimate for lettuce.

2
 http://www.yara.co.nz/crop-nutrition/crops/other-crops/lettuce-crop-programme/ This recommendation totals
167 kgN/ha

Landcare Research                                                                                           Page 5
Modelling the Source and Fate of Nitrate-Nitrogen Losses from Waimea Plains Land Uses
4 SPASMO Crop Production and Nutrient Loss Modelling
All water and nutrient calculations have been carried out using Plant & Food Research’s
SPASMO model (Green et al. 2008, 2012). This model considers the movement of water,
solute (e.g. N and P), pesticide, dissolved organic matter (i.e. dissolved organic carbon
(DOC) dissolved organic nitrogen (DON)) through a one-dimensional soil profile, as well as
overland flow of sediment and nutrients.
The soil–water balance is calculated by considering the inputs (rainfall and irrigation) and
losses (plant uptake, evaporation, runoff and drainage) of water from the soil profile.
SPASMO includes components to predict the carbon and nitrogen budgets of the soil. These
components allow for a calculation of plant growth and uptake of N, various exchange and
transformation processes that occur in the soil and aerial environment, recycling of nutrients
and organic material to the soil biomass, and the addition of surface-applied fertilizer and/or
effluent to the land, and the returns of dung and urine from grazing animals (Rosen et al.
2004). Model results for the water balance are expressed in terms of mm (= one litre of water
per square metre of ground area). The concentration and leaching losses of nutrients are
expressed in terms of g/m3 and kg/ha, respectively. All calculations are run on a daily basis
and the results are presented on a per hectare basis.
For modelling each farm or crop system, each farm type is specified by a production target
(e.g. dairy is represented by kg of milk solids per ha, horticulture is represented by kg of
product per hectare). For each model run, the input parameters for SPASMO were adjusted to
achieve the expected yields and production volumes identified by growers, Fruition
Horticulture and Plant & Food Research based on local experience and research results.
Further detail on the complexity of the model and the way in which crop phenology is
modelled can be found in Green at al. (2012), where SPASMO modelling is described for the
Ruataniwha Plains. However, it should be noted that the SPASMO model was considerably
further refined for this project to simulate multiple market gardening rotations and to simulate
more realistically the drying off and feed import scenarios for dairy farms on the Waimea
Plains.
5 Assumptions and uncertainty
The modelling and GIS-based apportionment of nitrate losses across the plains provides a
basis for anticipating changes if certain policy options are put in place. More reliance should
be put on the scale of the modelled changes rather than on the absolute modelled nitrate
losses, because the following assumptions have been made:
There is no attenuation (loss) of nitrate between the base of the soil profile and the
arrival of nitrates at the spring-fed streams. If the Waimea Community Dam is
supplying additional river flow in summer, there will be some dilution from additional
river flow losses to the unconfined aquifer, which we expect will affect Pearl Creek
flows and to a lesser extent Neiman Creek flows. Without this dilution accounted for,
the modelled nitrate concentrations in the streams will be worse than they may be in
reality.
The flow tubes adequately represent average groundwater flow directions from
upstream land use to the springs. Groundwater flow directions change subtly in
Page 6 Landcare ResearchModelling the Source and Fate of Nitrate-Nitrogen Losses from Waimea Plains Land Uses
response to pumping patterns, especially between summer and winter. Non-horizontal
groundwater flows between confined and overlying unconfined aquifers also vary.
However, at the scale of the analysis completed here over the whole Waimea Plain, we
think the flow directions are generally correct.
The SPASMO model adequately predicts actual nitrate leaching losses for the range of
crops and soils simulated, and the assumed loss rates for land uses not directly
simulated by SPASMO are valid (e.g. lifestyle blocks where dryland sheep and beef has
been used as the correlate; forestry where a default loss has been adopted). SPASMO
has been verified for pipfruit and grapes in other regions, but ideally lysimeter
monitoring is needed to check its results and those of OVERSEER across a range of
Waimea land uses, especially market gardening.
6 SPASMO modelled Nitrate-Nitrogen Leaching Responses
Besides calculating production, the SPASMO model also calculates nutrient losses below the
root zone via leaching and runoff, including calculating nitrogen transformations within each
soil layer. Losses due to runoff on the flat lands of the Waimea Plains are negligible.
This section of the report summarises nitrate-nitrogen leaching losses averaged over the 40
years 1974–2013 inclusive, for apples, grapes, outdoor vegetables, and dairy, on four soils
(Tables 2 & 3). Results in these tables assume full irrigation water availability with no
rationing (i.e. the ‘with dam’ full reliability scenario in the TRMP water allocation rules).
Figures 2–9 plot the annual variability in modelled nitrate leaching losses for the four land
uses on their predominant soils.
Modelling carried out in the partner study for MPI (Fenemor et al. 2015) for the ‘no dam’
fully rationed irrigation scenario showed little difference in annual nitrogen leached for the
full reliability compared with fully rationed irrigation scenarios, as shown for apples, grapes,
and vegetables in Figures 3–9. This is because nitrogen leaching is most strongly driven by
rainfall events, while land users generally avoid over-irrigation, which would lead to
significant additional leaching. However, irrigated land will usually be farmed more
intensively, and will have larger reservoirs of nutrients able to be flushed through when
heavy rainfalls do occur.
Landcare Research Page 7Modelling the Source and Fate of Nitrate-Nitrogen Losses from Waimea Plains Land Uses
Table 2 Average modelled nitrate-nitrogen losses from SPASMO modelling summarised for six Waimea
catchment land uses and four soil groups, kgN/ha/yr
Land Use/ Farm System Ranzau soil Waimea & Wakatu & Richmond & Proxy soil Proxy soil
Motupiko Dovedale Heslington for S&Beef for Forest
soils soils soils includes all & scrub
other soils
Dairy pasture 68.8 63.4 65.6 24.0
Apples (also applied here to
berries, hops, kiwifruit, 18.3 6.6 9.3 3.1
avocados)
Grapes (also applied to
18.3 9.8 13.6 4.3
olives, small nuts)
Outdoor vegetables (also
applied to nurseries, non- 51.4 33.0 31.9 16.0
sealed glasshouses)
Other pasture/lifestyle
block/non-agricultural
10.7
(assumes extensive sheep &
beef land use)
Forest, scrub 2.5
Between Year Variability in N Leached
120
Irrigated Dairy on 3 soils
100 Ranzau 35mm/wk
Full Allocation
Nitrate-N Leached kgN/ha
80
Waimea/Motupiko
35mm/wk Full
60
Allocation
40 Wakatu/Rosedale/
Dovedale
35mm/wk Full
20 Allocation
0
1974
1976
1978
1980
1982
1984
1986
1988
1990
1992
1994
1996
1998
2000
2002
2004
2006
2008
2010
2012
Year
Figure 2 Year to year variation in N leaching from fully irrigated dairy farming for 3 soil groups. Average
losses are 69 (Ranzau), 63 (Waimea) and 66 kgN/ha/yr (Wakatu). Modelled losses for 1974-78 are subject to
model initialisation errors and have not been included in averages.
Page 8 Landcare ResearchModelling the Source and Fate of Nitrate-Nitrogen Losses from Waimea Plains Land Uses
Between Year Variability in N Leached - Apples
35
30
Nitrate-N Leached kgN/ha
25
Ranzau 35mm/wk
Full Allocation
20
Waimea 35mm/wk
15 Full Allocation
Ranzau No Irrigation
10
5 Waimea No
Irrigation
0
1974
1976
1978
1980
1982
1984
1986
1988
1990
1992
1994
1996
1998
2000
2002
2004
2006
2008
2010
2012
Year
Figure 3 Year to year variation in N leaching from apples for Ranzau and Waimea soils. Fully irrigated
average losses are 18 kgN/ha/yr (Ranzau) and 7 kgN/ha/yr (Waimea).
Between Year Variability in N Leached - Grapes
30
25
Nitrate-N Leached kgN/ha
20 Ranzau 35mm/wk
Full Allocation
15 Waimea 35mm/wk
Full Allocation
10 Ranzau No Irrigation
5 Waimea No Irrigation
0
1974
1976
1978
1980
1982
1984
1986
1988
1990
1992
1994
1996
1998
2000
2002
2004
2006
2008
2010
2012
Year
Figure 4 Year to year variation in N leaching from grapes for Ranzau and Waimea soils. Fully irrigated
average losses are 18 kgN/ha/yr (Ranzau) and 10 kgN/ha/yr (Waimea).
Landcare Research Page 9Modelling the Source and Fate of Nitrate-Nitrogen Losses from Waimea Plains Land Uses
Between Year Variability in N Leached - Ranzau
& Waimea 0 and 35mm/wk - Market Garden
90
80
Nitrate-N Leached kgN/ha
70
60 Ranzau 35mm/wk
Full Allocation
50
Waimea 35mm/wk
40 Full Allocation
30 Ranzau No Irrigation
20
10 Waimea No Irrigation
0
1974
1976
1978
1980
1982
1984
1986
1988
1990
1992
1994
1996
1998
2000
2002
2004
2006
2008
2010
2012
Year
Figure 5 Year to year variation in N leaching from overall market garden for Ranzau and Waimea soils. Fully
irrigated average losses are 51 (Ranzau) and 33 kgN/ha/yr (Waimea).
Between Year Variability in N Leached - Ranzau
& Waimea 0 and 35mm/wk - Cabbage+Lettuce
80
70
Nitrate-N Leached kgN/ha
Ranzau 35mm/wk
60
Full Allocation
50 Waimea 35mm/wk
Full Allocation
40
Ranzau No
30 Irrigation
20 Waimea No
Irrigation
10
0
1974
1976
1978
1980
1982
1984
1986
1988
1990
1992
1994
1996
1998
2000
2002
2004
2006
2008
2010
2012
Year
Figure 6 Year to year variation in N leaching from a cabbage/lettuce sequence for Ranzau and Waimea soils.
Fully irrigated average losses are 44 (Ranzau) and 19 kgN/ha/yr (Waimea).
Page 10 Landcare ResearchModelling the Source and Fate of Nitrate-Nitrogen Losses from Waimea Plains Land Uses
Between Year Variability in N Leached -
Lettuce+Lettuce
140
120
Nitrate-N Leached kgN/ha
100 Ranzau 35mm/wk
Full Allocation
80
Waimea 35mm/wk
60 Full Allocation
40 Ranzau No Irrigation
20 Waimea No
Irrigation
0
1974
1976
1978
1980
1982
1984
1986
1988
1990
1992
1994
1996
1998
2000
2002
2004
2006
2008
2010
2012
Year
Figure 7 Year to year variation in N leaching from a lettuce/lettuce sequence for Ranzau and Waimea soils.
Fully irrigated average losses are 75 (Ranzau) and 64 kgN/ha/yr (Waimea).
Between Year Variability in N Leached -
Pumpkin+Lettuce
60
50
Nitrate-N Leached kgN/ha
Ranzau 35mm/wk
Full Allocation
40
Waimea 35mm/wk
30 Full Allocation
Ranzau No Irrigation
20
10 Waimea No
Irrigation
0
1974
1976
1978
1980
1982
1984
1986
1988
1990
1992
1994
1996
1998
2000
2002
2004
2006
2008
2010
2012
Year
Figure 8 Year to year variation in N leaching from a pumpkin/lettuce sequence for Ranzau and Waimea soils.
Fully irrigated average losses are 35 (Ranzau) and 16 kgN/ha/yr (Waimea).
Landcare Research Page 11Modelling the Source and Fate of Nitrate-Nitrogen Losses from Waimea Plains Land Uses
Finally, Figure 9 compares the leaching rates across the three outdoor vegetable crop
combinations modelled, for Ranzau soil only as that soil has the higher leaching rates. The
plot shows that the Lettuce/Lettuce combination has particularly high nitrate losses compared
with the Cabbage/Lettuce and the Pumpkin/Lettuce combination.
Between Year Variability in N Leached - 3 vege
rotations on Ranzau soils
140.0
35mm/wk Full Allocation
120.0 Cabbage+Lettuce
Nitrate-N Leached kgN/ha
No Irrigation
100.0
Cabbage+Lettuce
80.0 35mm/wk Full Allocation
Lettuce+Lettuce
60.0
No irrigation
40.0 Lettuce+Lettuce
35mm/wk Full Allocation
20.0
Pumpkin+Lettuce
0.0 No irrigation
1974
1977
1980
1983
1986
1989
1992
1995
1998
2001
2004
2007
2010
2013
Pumpkin+Lettuce
Year
Figure 9 Year on year variability of nitrate losses from market gardening on Ranzau soils under various
irrigation scenarios.
7 Nitrate Loss Pattern from current Land Uses
Plotting the nitrate losses by land use and soil type for the combinations shown in Table 3
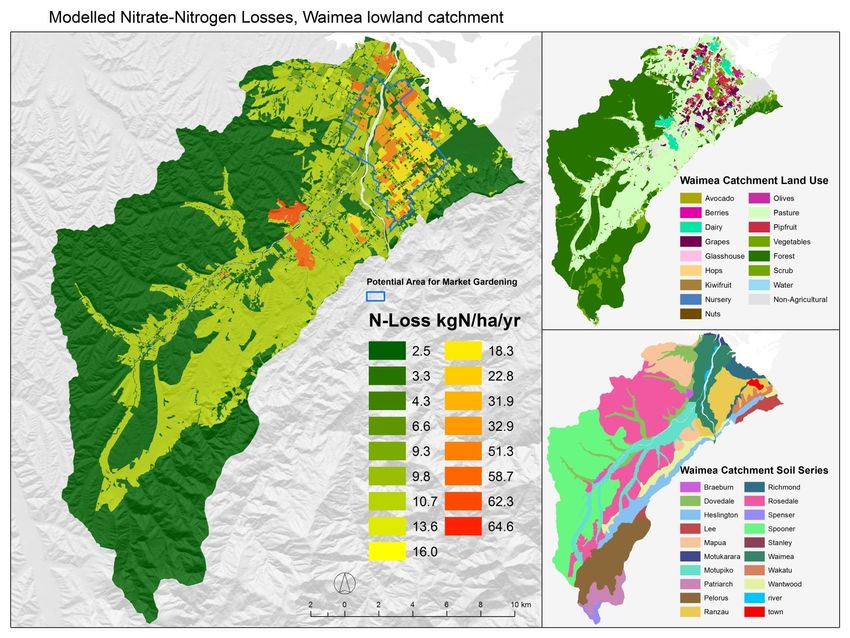
produces the map below (Fig. 10).
Total calculated nitrate loss below the soil root zone for the Waimea lowland catchment is
287 tonnes per year. The top six largest contributors by land use are pasture, forest, dairy,
outdoor vegetables, grapes, and pipfruit. The top three soil series from which the nitrogen
originates are Rosedale, Ranzau, and Waimea.
However, in terms of localised impact, it is the nitrate loss rates and proximity to receiving
waters that are important to understand. Highest loss rates according to the SPASMO
modelling are dairy, outdoor vegetables, grapes, and then apples (Table 3). Table 3 shows
that the most sensitive plains soils for nitrate leaching are Ranzau, followed by Waimea and
Wakatu, which are similar, then Richmond soils, which are less prone to leaching.
Page 12 Landcare ResearchFigure 10 Modelled nitrate losses, land use and soil series for the Waimea lowland catchment. Page 13
Modelling the Source and Fate of Nitrate-Nitrogen Losses from Waimea Plains Land Uses

Table 3 Mean annual nitrate-nitrogen loads by land use and soil series, kgN/yr

Land Use           Braeburn        Dovedale        Heslington       Lee          Mapua          Motukarara Motupiko        Patriarch       Pelorus          Ranzau          Richmond       Rosedale        Spenser         Spooner         Waimea         Wakatu         Wantwood Total For
                                                                                                                                                                                                                                                                                  Land Use
Avocado                                                                                                                                                                23                                                                                                                     23
Berries                       7                                                                                       13                                             112           99                                                               480                                   711
Dairy                                    4393                                            2045          741         6561                                                25        1610            7829                                          11 105                                   34 309
Forest                        8           898             1038            1076           963                        309           2569               7466               1                       13 773               246       21 027                15              6           96     49 492
Glasshouse *                                                                                                          0                                                 0              0                                                              0              0                        0
Grapes                        84         1336                                            395                       1011                                              5915          61                                                           3484               299           13     12597
Hops                          10              1                                                                     199                                                                                                                             107                                   317
Kiwifruit                                                                                                             3                                              218               3                                                            342                                   566
Non-Agricultural              50          421              152               2           329            11          916                0                             2020         636             317                185              59        1050               455          125      6727
Nursery                                   135                                                                       944                                              1331         111                                                           1602                                     4122
Nuts                                          39                2                                                                                                    144                              7                                              89                                   282
Olives                                        75            37                              7                         78                                               48                             0                                              62                          32       339
Pasture                   1082         11 901           14 360            666        15 927            749       22 191                              535             4699        2684           30 811                           5277           9434           1314          10 513    132 141
Pipfruit                      35          798                   1                        285             0          224                                              7203         181                 45                               1        1560                89            2     10 424
Scrub                         4           334              493            359            316            45          495            114           1,614                  5          14             368                154             663            226             65          130      5399
Vegetables                                                      0                           9            8            82                                        18 761            397                                                          10 266               26                  29 550
Total kgN/yr              1280         20 329           16 084            2103       20 277           1553       33 026           2684               9614       40 503           5796           53 150               585       27 027          39 822          2253          10 912    286 999
* assumed self-contained

Page 14                                                                                                Landcare Research
Modelling the Source and Fate of Nitrate-Nitrogen Losses from Waimea Plains Land Uses
8 Modelling Nitrate reaching Receiving Waters
In order to manage the environmental effects of nitrate losses, an understanding is first
needed of the attenuation (reduction in nitrate) between the base of the soil profile along the
flow path to sensitive receiving waters. This is followed by consideration of potential water
quality limits, which should by met for each receiving water body.
Relevant receiving waters for management of water quality are the three aquifers, the Wai-iti,
Wairoa, and Waimea rivers, the spring-fed streams Pearl Creek and Neimann Creek, other
streams, including Borck Creek near Richmond and O’Connor Creek at Appleby, as well as
the Waimea Inlet.
The following table (Table 4) was a first attempt to provide a scientific basis for water quality
limits for receiving water bodies in the Waimea Plains. Further work has since been carried
out adjusting upwards the nitrate toxicity limits initially proposed in Table 4 because of the
higher water hardness in the spring-fed streams (Hickey, 2015). The revised limits are
incorporated into Table 4.
Table 4 Recommended numeric objectives associated with maintaining various values within the Waimea
Catchment and Waimea Inlet (updated from Fenemor et al. 2013)
Objectives
Limit macroalgal
Safe for Safe drinking Limit risk of Control freshwater blooms in the
Waterbodies swimming water nitrate toxicity periphyton growth Waimea Inlet
Annual average
th
95 percentile NO3-N shall be Dissolved reactive
values of E.Modelling the Source and Fate of Nitrate-Nitrogen Losses from Waimea Plains Land Uses
It is evident from comparing Table 4 with measured nitrate concentrations that the more
sensitive receiving waters for nitrate are the confined aquifers, where some wells have
nitrates above drinking water guidelines, and the spring-fed streams where nitrate levels are
close to nitrate toxicity recommendations and may exceed future periphyton-related limits
(although as Figure 11 shows, nitrate levels have been declining).
12
10
8
6
4
2
0
1/01/2010 16/05/2011 27/09/2012 9/02/2014 24/06/2015 5/11/2016
Nitrate-N (g/m3) at RW Neimann Ck @ 600m us Lansdowne Rd
Nitrate-N (g/m3) at RW Pearl Ck @ 200m us tidegate
Nitrate-N (g/m3) at GW 802 - Waiwest
Figure 11 Measured nitrate concentrations (g/m3) since 2010 in Pearl and Neimann creeks and well 802
upstream of Neimann Creek (Glenn Stevens, TDC, pers. comm.).
Potential attenuation of nitrate before it reaches any surface water was evaluated in the earlier
study for WWAC. The results suggested possible attenuation of 60% in the unconfined
aquifer, negligible attenuation in the Hope Aquifers and UCA, and around 40% for the LCA.
The previous work (Fenemor et al. 2013) concluded:
Physically, more attenuation would be expected in the unconfined aquifer than the
confined ones. This is because of the exchange of relatively clean river recharge with
groundwater near the major rivers, and the input of less enriched waters from hillslope
recharge. In the Hope and two fully confined aquifers, most of the recharge is
originating from rainfall and irrigation via the overlying contaminating land uses; the
only dilution is the proportion of river recharge reaching the LCA and a small
contribution of less enriched recharge from the eastern hill slopes.
A conservative assumption would be that attenuation in the confined aquifers is negligible,
and in the unconfined aquifer attenuation is caused only by dilution of river water recharging
the adjoining aquifer. If the Waimea Community Dam is releasing water that recharges the
unconfined aquifer during summer, this may have a diluting effect on flows from Pearl and
Neiman Creeks, but that would need to be investigated using the TDC’s Waimea
groundwater model.
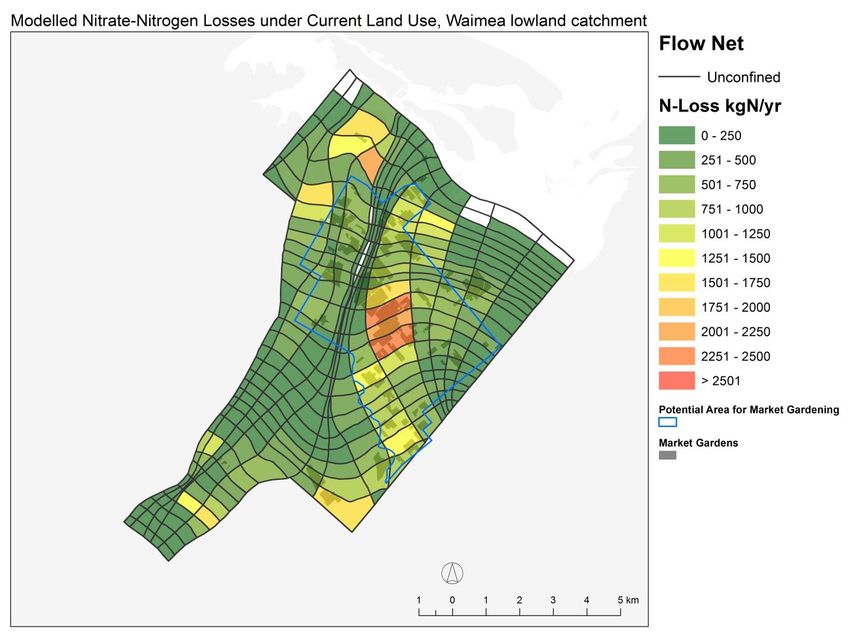
Page 16 Landcare ResearchModelling the Source and Fate of Nitrate-Nitrogen Losses from Waimea Plains Land Uses In the meantime, we have completed a flow tube analysis as a method for assessing the effects of land use change on nitrate concentrations reaching Pearl and Neimann creeks. Figure 12–14 show modelled nitrate losses for scenarios of increasing market gardening within the blue bounded area of Figure 1. As discussed at the June 2015 FLAG meeting, areas assumed converted to market gardening exclude any area currently in permanent crops (orchard, grapes) and have been chosen sequentially from the largest blocks first. The additional 200 ha of Figure 13 correspond to all blocks larger than 3.4 ha being converted, while the additional 318 ha of Figure 14 correspond to all blocks of 1ha or more being converted within that blue boundary. Figure 12 Nitrate losses by flow net cell for current land use. Landcare Research Page 17
Modelling the Source and Fate of Nitrate-Nitrogen Losses from Waimea Plains Land Uses

Figure 13 Nitrate losses by flow net cell for current land use plus 200 ha outdoor vegetable growing (with all
vegetable growing shaded).

Page 18                                                                                       Landcare Research
Modelling the Source and Fate of Nitrate-Nitrogen Losses from Waimea Plains Land Uses

Figure 14 Nitrate losses by flow net cell for current land use plus 318 ha outdoor vegetable growing (with all
vegetable growing shaded).

Assuming no attenuation of nitrate, Table 5 summarises the modelled nitrate concentrations
that would be delivered for these and other scenarios at Pearl Creek and Neimann Creek. The
match between calculated and recent measured concentration at Pearl Creek is excellent but
the predicted concentrations in Neimann Creek exceed recent measured concentrations
(although they are similar to earlier higher nitrate concentrations there).

The main benefit of these numbers is to show the sensitivity of changes in nitrate in these
streams to changes in land use, in this case increases in market gardening. The table should
help assess the effects of land use intensification on nitrate concentrations in spring-fed
streams.

Table 5 shows that nitrate concentrations in the spring-fed Pearl Creek could increase by 0.44
to 0.48 g/m3 for 200–562 additional hectares converted from pastoral land use to outdoor
vegetable production. For the spring-fed Neimann Creek, equivalent increases in nitrate
concentration would be 0.54 to 1.06 g/m3. Resulting nitrate concentrations would slightly
increase the risk of exceeding acceptable aquatic ecosystem limits, depending on which
values the FLAG and community decide those limits should be based.

Landcare Research                                                                                          Page 19
Page 20

Table 5 Modelled nitrate discharges at spring-fed streams for various market garden expansion scenarios

                                               Pearl Creek                                                   Neimann Creek
                                                                                                                                                           GW802
                                          (mean flow ~ 278 l/sec)                                         (mean flow ~ 166 l/sec)
                        Calculated average                          Measured nitrate   Calculated average                           Measured nitrate   Measured nitrate
Market gardening           contributing      Calculated nitrate      concentration        contributing      Calculated nitrate        concentration     concentration
scenario                   nitrate load,      concentration,        (2011–15, n=8),       nitrate load,      concentration,         (2011–15, n=10),   (2011–15, n=14),
                                                       3                     3                                        3                       3                 3
                              kgN/yr               g/m                   g/m                 kgN/yr               g/m                     g/m               g/m
Current Land Use
                                 13.4                 2.05                                      22.1                 5.56

Current plus 47ha
                                 16.0                 2.45                                      23.8                 5.98
(>5ha blocks)
Current +200ha
                                 16.3          2.49 (+0.44)                                     24.3          6.10 (+0.54)
(>3.4ha blocks)
                                                                           2.86                                                            3.86               4.79
Current+264ha
                                 16.3                 2.50                                      25.0                 6.29
(>2ha blocks)
Current+318ha
                                 16.5                 2.52                                      25.6                 6.44
(>1ha blocks)
Current+562ha
                                 16.5                 2.53                                      26.3                 6.62
(all eligible blocks)
Modelling the Source and Fate of Nitrate-Nitrogen Losses from Waimea Plains Land Uses
9 Summary of Mitigation Methods
The Waimea FLAG discussed workable on-farm methods for reducing nitrogen losses, as
well as policy methods that could be applied through a nutrient management plan change to
the Tasman Resource Management Plan.
As a starter for discussion, the following summarises mitigation methods from Fenemor et al.
(2015):
Pastoral options to reduce nitrogen losses
Time fertilizer applications to maximise plant uptake
Reduce or limit N fertilizer applied
Livestock improvement for efficient feed utilization
Riparian buffer plantings, stock exclusion and tracks kept away from any running
water
Feed pads, stand-off pads, barns where effluent can be collected
Lower stocking and production rates
Use of N inhibitors
Wetlands for intercepting runoff
Limit autumn grazing, e.g. through wintering off at less vulnerable locations
Improved irrigation efficiency to reduce drainage losses
Horticultural options to reduce nitrogen losses
Limit each fertilizer application, e.g. to less than 80 kgN per month
Reductions in N applied
Improved irrigation application efficiency
Side dressings of fertilizer post-planting
Winter cover crops when ground is fallow
Soil and leaf testing including deep soil N testing
Irrigation scheduling to maintain soil moisture between wilting point and field
capacity – using soil moisture monitoring
Tailor crop types to leaching vulnerability
Variable rate fertilizer and irrigation application to match crop demand
Accounting for all organic, effluent and glasshouse nutrient disposal to reduce
fertilizer applied
Improved fertilizer technologies, e.g. prills, coatings.
Landcare Research Page 21Modelling the Source and Fate of Nitrate-Nitrogen Losses from Waimea Plains Land Uses
10 References
Fenemor AD 2013. Summary of hydrology and water management bases for decisions on
Waimea water management, with and without water augmentation. Landcare Research
contract Report LC1647 to inform Tasman District Council plan change C47. 25 p.
Fenemor AD 1988. A three-dimensional model for management of the Waimea Plains
Aquifers, Nelson. Hydrology Centre Publication No. 18. Lower Hutt, DSIR. 133 p.
Fenemor A, Green S, Dryden G, Samarasinghe O, Newsome P, Price R, Betts H, Lilburne L
2015. Crop production, profit and nutrient losses in relation to irrigation water
allocation and reliability – Waimea Plains, Tasman District: final report. MPI Technical
Paper No: 2015/36. Landcare Research. 65 p. http://www.mpi.govt.nz/document-
vault/9899
Fenemor AD, Lilburne L, Young RA, Green S, Webb T 2013. Assessing water quality risks
and responses with increased irrigation in the Waimea Basin. Landcare Research
Report LC1246 for the Waimea Water Augmentation Committee, Tasman District. 42
p.
Green SR, Clothier BE, van den Dijssel C, Deurer M, Davidson P 2008. Measurement and
modelling the stress response of grapevines to soil-water deficits in their rootzones. In:
Ahuja L ed. Modeling the response of crops to limited water: Recent advances in
understanding and modeling water stress effects on plant growth processes. Soil
Science Society America Monograph. Pp. 357–386.
Green S, Manderson A, Clothier B, Mackay A 2012. SPASMO modelling of water and
nutrients using a GIS framework to estimate catchment loads. Client report prepared for
Hawke’s Bay Regional Council, Report number PFR SPTS No. 6846, Plant and Food
Research. Included as Appendix 1 in Rutherford K 2012. Modelling the effects of land
use on nutrients entering the Tukituki River, Hawke’s Bay. Report prepared for
Hawke’s Bay Regional Council, NIWA Client Report number HAM2012-077.
Auckland, National Institute of Water & Atmospheric Research.
Hickey, C. 2015. Hardness and Nitrate toxicity – site-specific guidelines for spring-fed
streams in the Waimea and Motupipi river catchments and Waikoropupu Springs.
Memo to J. Thomas, Tasman District Council, 19 May 2015.
Rescan 2012. EKATI Diamond Mine: Site-Specific Water Quality Objective for Nitrate,
2012. Project #648-116-01. Prepared for BHP Billiton Canada Inc. by Rescan
Environmental Services Ltd, Yellowknife, Northwest Territories. pp. 57.
Rosen MR, Reeves RR, Green SR, Clothier BE, Ironside N 2004 Prediction of groundwater
nitrate contamination after closure of an unlined sheep feedlot in New Zealand. Vadose
Zone Journal 3: 990–1006.
Page 22 Landcare ResearchYou can also read