Automatic quantification and grading of hip bone marrow oedema in ankylosing spondylitis based on deep learning
←
→
Page content transcription
If your browser does not render page correctly, please read the page content below
Modern Rheumatology, 00, 2021, 1–6
DOI: https://doi.org/10.1093/mr/roab073
Advance access publication date: 1 October 2021
Original Article

Automatic quantification and grading of hip bone marrow
oedema in ankylosing spondylitis based on deep learning
Qing Hana,b,‡ , Yunfei Luc,‡ , Jie Hand,‡ , AnLin Luoc,‡ , LuGuang Huangc,e,‡ , Jin Dinga,b , Kui Zhanga,b ,

                                                                                                                                                         Downloaded from https://academic.oup.com/mr/advance-article/doi/10.1093/mr/roab073/6378620 by guest on 26 December 2021
Zhaohui Zhenga,b , JunFeng Jiaa,b , Qiang Lianga,b , Shuiping Gouc,* and Ping Zhua,b,*
a
  Department of Clinical Immunology, PLA Specialized Research Institute of Rheumatology & Immunology, Xijing Hospital, Fourth Military
Medical University, Xi’an 710032, China
b
  National Translational Science Center for Molecular Medicine, Xi’an 710032, China
c
  Key Lab of Intelligent Perception and Image Understanding of Ministry of Education, Xidian University, Xi’an, Shaanxi 710071, China
d
  Department of Cardiovascular Surgery, Xijing Hospital, Fourth Military Medical University, Xi’an, Shaanxi 710032, China
e
  Department of Information Section, Xijing Hospital, Fourth Military Medical University, Xi’an 710032, China
‡ These authors contributed equally to this work.
*Correspondence: Ping Zhu; zhuping@fmmu.edu.cn; Department of Clinical Immunology, PLA Specialized Research Institute of Rheumatology & Immunology,
Xijing Hospital, Fourth Military Medical University, No.127 West Changle Road, Xi’an, Shaanxi 710032, China. National Translational Science Center for
Molecular Medicine, Xi’an 710032, China.

ABSTRACT
Objective: This study has developed a new automatic algorithm for the quantificationy and grading of ankylosing spondylitis (AS)-hip arthritis
with magnetic resonance imaging (MRI).
Methods: (1) This study designs a new segmentation network based on deep learning, and a classification network based on deep learning. (2)
We train the segmentation model and classification model with the training data and validate the performance of the model. (3) The segmentation
results of inflammation in MRI images were obtained and the hip joint was quantified using the segmentation results.
Results: A retrospective analysis was performed on 141 cases; 101 patients were included in the derived cohort and 40 in the validation cohort.
In the derivation group, median percentage of bone marrow oedema (BME) for each grade was as follows: 36% for grade 1 (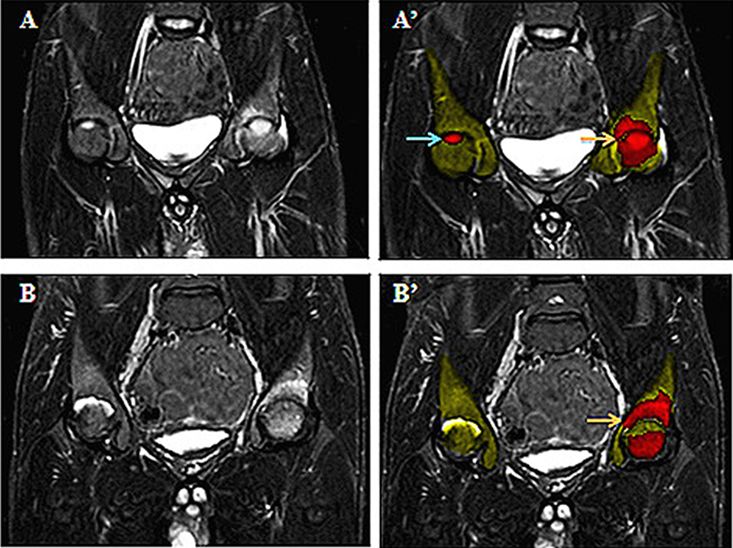
2 Han et al.
on site, and increases the time required for the examination,
which may not be feasible due to budget constraints. Thus,
further evaluation of existing magnetic resonance imaging
(MRI) may lead to the early diagnosis of unknown conditions.
As a result, the mean diagnostic delay of AS is
about 10 years, and many patients remain undiagnosed.
Patients with hip pain undergo physical examination to iden-
tify the source of their pain. When there is suspicion of AS hip
arthritis, an X-ray of the hip joint is acquired and evaluated by
both an expert musculoskeletal radiologist and a rheumatolo-
Downloaded from https://academic.oup.com/mr/advance-article/doi/10.1093/mr/roab073/6378620 by guest on 26 December 2021
gist. However, it is known diagnosis based on X-ray has low
sensitivity for detecting the early stages of the disease. X-ray
is generally not recommended for the detection of AS due to
its relatively high radiation exposure.
MRI is described as a better tool for understanding the
disease process and early diagnosis in the ASAS classification
criteria, and has been used as an objective outcome measure
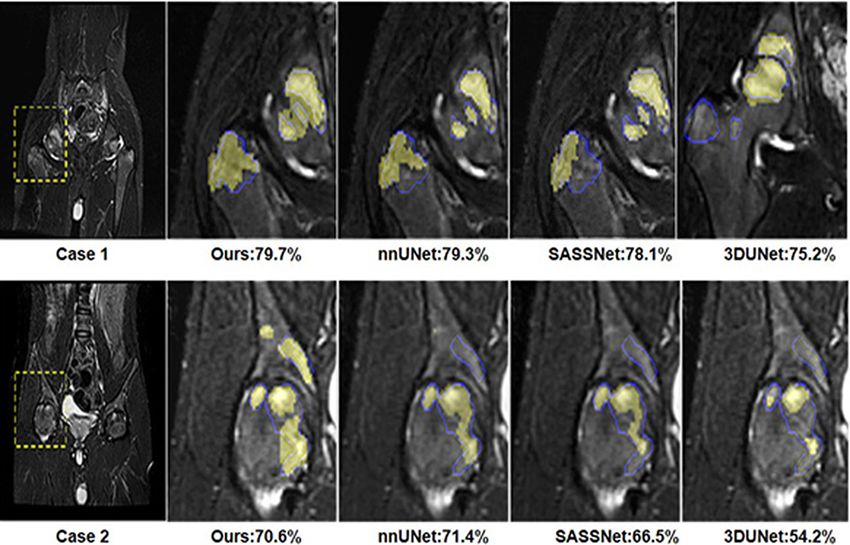
in clinical trials [8]. MRI is used by physicians for the diag- Figure 1. Examples of hip MRI slices showing AS at different stages
nosis and identification of AS when it is undiagnosed in its according to the BME grades on STIR sequence: (A–A’) grade 1—mild,
early stages. MRI is the preferred diagnostic imaging modal- BME < 15% (A’, blue arrow shows red area); grade 2—moderate,
ity for the detection of AS due to its high contrast and tissue 15% < BME < 30% (A’, orange arrow shows red area); (B–B’) grade
resolution. 3—severe, BME > 30% (B’, orange arrow shows red area).
This study’s primary aim was to develop and validate a
deep learning–based system for the quantitation and grading
of bone marrow oedema (BME) in hip arthritis of AS.
Methods overview
Study population
We retrospectively evaluated all patients with diagnosed AS
who were followed up at the Xijing hospital outpatient clinic
from January 2011 to December 2019. Therefore, the study
population (n = 141) was divided into two subgroups: 101
AS-hip arthritis cases for training and 40 AS-hip arthritis cases
for test. The study was approved by the local ethics committee
(20110303-7), and informed consent was obtained from each
participant before enrolment into this study.
Image analysis for inflammation
The proposed methodology for quantitation of these fea-
tures engaged deep learning techniques with conventional
image processing methods. The results of the quantitation
are expressed as percentage of inflammation (%).BME is
an indicator of active AS on short TI inversion recovery
(STIR) sequence. Grading criteria for bone marrow edema
of AS on MRI including: grade 0-normal, BME = 0%, grade
1-mild, BME 30% (Figure 1).
AS segmentation based on multi-scale learning
We consider a three-dimensional (3D) MRI data as X, which to the two-dimensional (2D) classification network is a slice
indicates the voxel value of each point in the volume, and of MRI images.
yseg ∈ {0, 1}, 1 for inflammation while 0 for background. We will present the segmentation framework in this part.
Meanwhile, we have ycla ∈ {0, 1, 2, 3} for each slice of the Figure 2 shows some MRI slices of patients with different AS
MRI scans, representing the patients’ severity (Figure 2). Our severity. From the images we can observe that the inflamma-
method consists of segmentation and classification. Firstly, tion varies greatly in scale and position, which makes the
our model receives a 3D MRI image patch x as input, then inflammation segmentation a hard task. At the same time,
outputs the prediction mask yp of inflammation, by calculat- due to the different quality of these MRI images, the quality
ing the volume of the segmentation result the inflammation of these MRI images also has significant difference. There-
can be quantified. Finally, the segmentation result yp will be fore, existing segmentation models are difficult to segment
transferred into the second phase for classification. The input inflammation.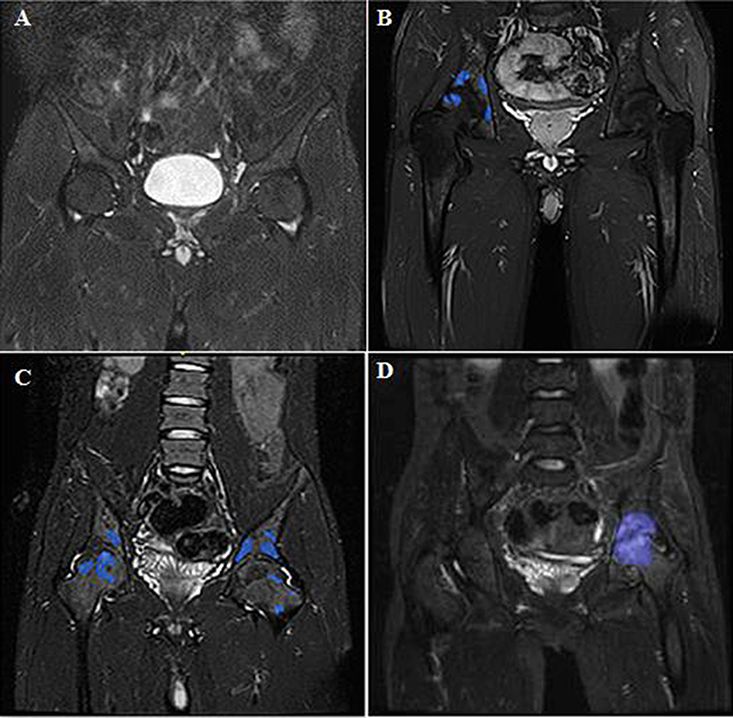
Automatic quantification and grading in hip inflammation                                                                                            3

Multi-scale-based segmentation                                               distribution of inflammation of different scales, for example,
A variant of THREE-DIMENSIONAL U-NET, widely used                            smaller inflammation is likely to take a smaller proportion in
in medical image segmentation. In order to improve the net-                  data set, which decreases the segmentation performance of
work depth without performance degradation, 3D residual                      small inflammation.
convolution module was used to replace the original con-
volution module. At the same time, in order to prevent the                   Modify the loss function, data augmentation, and sample
network from being transmitted to the shallow layer when                     learning
the gradient is backpropagated due to depth reasons, that                    We propose a method that combines data augmentation and
is, the gradient may disappear, our network introduces the                   network learning. By introducing the multi-scale convolution
deep supervision mechanism, which strengthens training by                    module, our network model can have good detection capabil-

                                                                                                                                                         Downloaded from https://academic.oup.com/mr/advance-article/doi/10.1093/mr/roab073/6378620 by guest on 26 December 2021
introducing additional decoding structures. During the gra-                  ities for lesion areas of different scales, but for a small number
dient flow of the network, the mechanism is applied to the                   of samples, the segmentation result of the network model is
decoding part of the U-net structure to help the shallow layer               still not good. By analysing the performance of such samples,
of the network to be fully trained to avoid network under-                   we found that the lesion area in such samples is fuzzy and dif-
fitting due to the disappearance of the gradient. In order                   fuse, so the network segmentation results for these samples
to solve the problem of poor segmentation effect caused                      are not good. We define the fuzzy and diffuse samples of this
by the multi-scale and fuzzy characteristics of inflamma-                    type of lesion area as hard samples. Based on the original data,
tion, a multi-scale convolution module is proposed in this                   such difficult samples are augmented, using rotation, scaling,
study.                                                                       adding noise, and gamma transformation for all data. The
                                                                             method of changing the contrast and brightness to expand
Multi-scale convolution module                                               the data increases the diversity of the data. Through data aug-
Due to the multi-scale nature of inflammation, traditional                   mentation processing, our network model’s ability to segment
methods fail to capture sufficient scale information and obtain              samples from fuzzy and diffuse lesion areas has been improved
an approving segmentation result, and we attempt to pro-                     to a certain extent. The specific method is to introduce data
pose a multiscale convolution module in order to deal with                   augmentation in U-net. Loss function has been modified to
this problem (Figure 3). We first utilize a multi-scale con-                 dice loss to improve the performance of the network.
volution module to help our network capture efficient scale
information about the inflammation. Our multi-scale convo-                   2D MRI image classification
lution module consists of a multi-scale convolution kernel,                  According to the grading criteria of AS bone marrow edema
and then uses point convolution to select the imported scale                 on MRI, it is necessary to accurately measure the location and
feature graph. By using multi-scale convolution kernel, our                  proportion of inflammation. We considered using classifica-
network could capture sufficient scale information, which                    tion models and labeled data under criteria to grade images
would help the segmentation of inflammation with extremely                   to help clinicians grade MRI images.
different scales. Specifically, we replace the bottom two lay-                  With the inflammation prediction mask above, classifica-
ers of the U-net structure, that is, the last two convolution                tion is implemented easily with plain Resnet-50. We concate-
layers of the network coding layer with a multi-scale convolu-               nate the 2D prediction mask and image as the input of Resnet
tion layer. The reason is that we think that the shallow layer               to grade the patient, and then, we can classify the patient into
of the network is mainly used to extract low-level features                  four classes for the doctor to determine the how serious the
of the data, the introduction of the multi-scale convolution                 patients are.
module in the shallow layer is not helpful for the extraction                   After segmenting the MRI data for the inflammation area,
of multi-scale information, and the results of control exper-                the inflammation needs to be graded. At present, the classifica-
iments also prove our conjecture. Secondly, due to uneven                    tion of inflammation based on imaging data is mainly divided

Figure 3. The framework of our model: first the 3D MRI image will be passed into the segmentation network, the quantification result could be obtained
with the segmentation mask, then the segmentation result is transferred into the classification network, and the network outputs the grading result.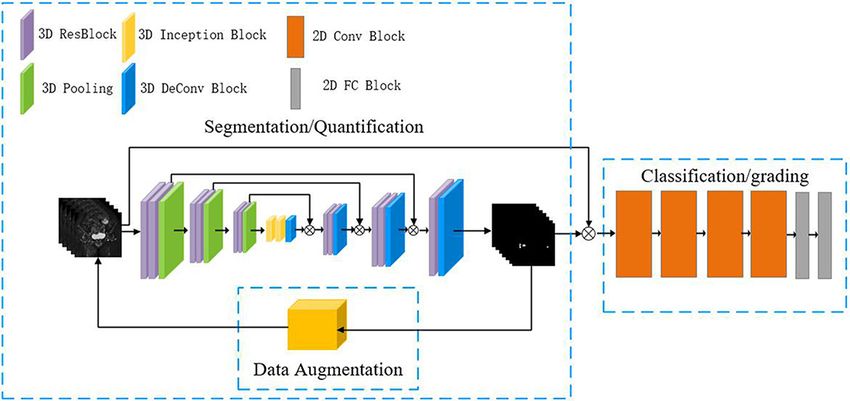
4                                                                                                                                          Han et al.

into four levels: normal, mild, moderate, and severe. Due to                  segmentation. The combination of grand multi-scale mod-
the small number of classification categories, we considered                  ule and data augmentation could reduce the misdetection and
using 2D ResNet50 to rank the inflammation data. In the                       false detection of inflammation and improve the accuracy of
classification network we designed, the input is the original                 quantification.
2D MRI picture and the 2D segmentation result, and the out-                      Here, we choose two slices of two cases and below the slice
put is the category to which the MRI picture belongs. In our                  are the segmentation results of different models. From the two
task, it is mainly divided into four categories. In the test phase,           cases, we could conclude that our model could detect smaller
we input the original 2D MRI slice and segmentation results                   inflammation, while other models fail. Meanwhile, our model
into the classification network based on the MRI inflam-                      could identify the inflammation comprehensively, while other
mation segmentation results obtained above to obtain the                      models may miss some regions. But there still are some regions

                                                                                                                                                         Downloaded from https://academic.oup.com/mr/advance-article/doi/10.1093/mr/roab073/6378620 by guest on 26 December 2021
results.                                                                      that all the models fail to detect. The percentage of inflamma-
                                                                              tion derived from the automated quantitation was compared
Statistical analysis                                                          with the ratio obtained by the manual annotations of the
                                                                              rheumatologists. There was excellent concordance between
Ordinal variables were expressed as relative frequencies.
                                                                              manual annotations and automatic measurements, with a
Numerical variables were summarized as medians and ranges.
                                                                              background kappa = 0.99 and foreground kappa = 0.69.
Frequencies were compared using the χ2 test. For quantitative
variables (manual annotations and image analysis results),
concordance was measured using kappa. A kappa value of                        Inflammation assessment agreement
0.2–0.39 was 100 considered as ‘fair’, 0.4–0.59 as ‘moderate’,                We design the model to quantify the inflammation, and the
0.6–0.79 as ‘substantial’, and ≥0.8 as ‘perfect’ agreement. All               quantification result will be used to develop the treatment
tests were two-sided, and P < 0.05 was considered significant.                plan and determine whether the patient’s condition is improv-
All statistical analyses were performed using SPSS (version                   ing, so we need to improve the segmentation performance.
19.0; SPSS Inc., Chicago, IL).                                                In order to compare the performance of our model, we list
                                                                              the segmentation results of different models in Table 2. From
                                                                              the table, we can conclude that our model achieves higher
Results                                                                       inflammation DSC (68.7 ± 15.7%) than the most powerful
Study population                                                              UNet model nnUNet, which is (67.6 ± 15.6%), meanwhile
A retrospective analysis was performed on 141 cases (male                     nnUNet takes a longer training time period (2 days) than our
89%, age 26.3 ± 5.3 years). First, 101 patients were included                 model (22 hours). The introduction of multi-scale leads to a
in the derived cohort and 40 in the validation cohort. In the                 higher instability that increases the uncertainty of our model.
derivation group, median percentage of BME for each grade                     Our model achieves, that the highest DSC of our model is
was as follows: 36% for grade 1 (
Automatic quantification and grading in hip inflammation 5
Downloaded from https://academic.oup.com/mr/advance-article/doi/10.1093/mr/roab073/6378620 by guest on 26 December 2021
Figure 4. Results of different models, the yellow frames represent the zoomed-in part, the blue contours mean the ground truth, and the masked yellow
regions represent the segmentation results.
Table 2. The average results of multiple experiments on different models.
Method DSC (%) Kappa (BG) Kappa (FG) Max (%) Min (%) HD95 (mm) ASD (mm) Precision (%)
nnUNet 67.6 ± 15.6 99.9 ± 0.01 67.5 ± 0.16 82.4 15.4 2.9 ± 2.4 0.3 ± 0.2 79.1
SASSNet 64.0 ± 18.4 99.9 ± 0.01 58.2 ± 0.20 86.9 0 4.4 ± 6.7 0.3 ± 0.3 82.5
VNet 62.7 ± 15.1 99.9 ± 0.01 62.7 ± 0.15 82.8 16.8 5.0 ± 5.4 1.0 ± 1.4 82.3
UNet 63.2 ± 16.3 99.9 ± 0.01 63.2 ± 0.17 82.4 0 4.2 ± 4.7 0.9 ± 1.2 82.7
Ours 68.7 ± 15.7 99.9 ± 0.01 68.7 ± 0.16 84.9 0 4.3 ± 6.1 0.5 ± 0.9 85.1
Max represents the max dice and Min is the min dice, HD95 represents Hausdorff distance at 95th percentile, ASD represents average symmetric surface
distance; NA: non-available. BG represents background, FG represents foreground.
develop a diagnosis and treatment plan, thus reducing the of MRI images of the hip joint for spinal arthritis. How-
rate of disability. Imaging has become the primary method ever, various deep learning methods have been proposed
for early diagnosis and evaluation of spinal arthritis. MRI is for automatic detection and segmentation of structures and
widely used in the early diagnosis of spinal arthritis due to pathology. They are widely used because of their universality
the early identification of soft tissue lesion, real-time imaging, and their practical application effects.
and non-radiation. It can help doctors locate lesions during MRI inflammation was first used to set thresholds for
diagnosis and provide guidance for early diagnosis. inflammatory segmentation. This method requires a high con-
At present, the assessment of inflammation on MRI images sistency of voxel values in inflammatory regions. Since the
of AS mainly relies on the subjective clinical experience of the distribution of voxel in inflammatory regions in MRI data is
clinician. The clinical interpretation results of MRI images not uniform, using this method will result in poor segmenta-
by clinicians of different levels were inconsistent in sever- tion effect of inflammatory regions and affect the quantitative
ity. These factors affect the difficulty and objectivity of tablet accuracy. The method of lesion analysis based on the deep
reading analysis by clinicians. In addition, doctors need to learning model UNet has been widely used in recent years.
carry out manual annotation and image processing in the However, MRI of hip joint inflammation has the character-
quantitative analysis of MRI, which will result in longer istics of scale, shape, intensity value, and random location
working time and seriously affect working efficiency and distribution. As a result, the original UNet method could not
accuracy. Therefore, sophisticated and precise computer algo- fully obtain the accurate location information of MRI hip
rithms were used to accurately quantify and grade MRI hip joint inflammation area, which is prone to problems such as
joint inflammatory regions. The accuracy of early identifica- missed and wrong detection. This results in poor quantita-
tion of MRI quantitative grading of hip joint inflammation tive results. Due to the small size of hip joint inflammation
is the key technique in this study. Up to now, there has on MRI images, the commonly used image classification
been no publication of quantitative and automatic processing model has poor MRI grading effect on hip joint inflammation6 Han et al.
areas. Therefore, accurate segmentation and classification of the Natural Science Foundation of Shaanxi Province (No.
inflammatory regions of hip joint in MRI with large size differ- 2019ZDLGY03-02-02) and the Research Industrialization
ences and smaller proportions have not yet reached a practical Plan of Xi’an (No. XA2020-RGZNTJ-0075).
level.
The sensitive and quantitative analysis of inflammation
changes of hip lesions is urgently required for an objective Data availability
evaluation of disease progression. We present the segmenta- Data available on request.
tion framework in this part. Figure 3 shows some patients’
MRI slices of patients with different severity of AS. From the
images, we can conclude that the inflammations varies greatly Abbreviations
Downloaded from https://academic.oup.com/mr/advance-article/doi/10.1093/mr/roab073/6378620 by guest on 26 December 2021
in scale and position, which makes the inflammation segmen- Ankylosing spondylitis (AS); SpondyloArthritis International
tation a hard task. The quality of MRI images may affect the Society (ASAS); magnetic resonance imaging (MRI); bone
consistency of data due to differences in radiographers’ skills marrow oedema (BME); short TI inversion recovery (STIR)
and equipment. sequence; Dice similarity coefficient (DSC).
This study also has some limitations. The initial inclusion
of patients in this study still needs to be expanded for more
accurate calculation. Further validation needs to include a References
larger number of patients to be closer to clinical requirements. [1] Tang WM, Chiu KY. Primary total hip arthroplasty in patients with
We have summarized a multi-scale full-volume neural net- ankylosing spondylitis. J Arthroplasty 2000;15:52–8.
work based on deep learning, which is mainly used in the [2] Vander CB, Munoz-Gomariz E, Font P et al. Hip involvement in
inflammatory segmentation of mri images. Our method is to ankylosing spondylitis: epidemiology and risk factors associated
realize the accuracy of the automatic segmentation of inflam- with hip replacement surgery. Rheumatology 2010;49:73–81.
matory areas and the quantitative analysis of the area of high [3] Burki V, Gossec L, Payet J et al. Prevalence and characteristics of
inflammation. The technical solution is to first construct a full hip involvement in spondyloarthritis: a single-centre observational
convolutional neural network segmentation model based on study of 275 patients. Clin Exp Rheumatol 2012;30:481–6.
[4] Chen H-A, Chen C-H, Liao H-T et al. Factors associated with
grand multi-scale convolution for segmentation of multi-scale
radiographic spinal involvement and hip involvement in ankylosing
inflammation regions, and at the same time, a data augmen- spondylitis. Semin Arthritis Rheum 2011;40:552–8.
tation module is used for mining and learning of difficult [5] Yilmaz Ö, Tutoglu A, Garip Y et al. Health-related quality of life in
samples. The two network models are jointly trained to reduce Turkish patients with ankylosing spondylitis: impact of peripheral
missed and misdetected inflammatory regions. At the same involvement on quality of life in terms of disease activity, func-
time, good verification results are obtained. tional status, severity of pain, and social and emotional functioning.
Rheumatol Int 2013;33:1159–63.
[6] Putnis SE, Wartemberg GK, Khan WS et al. Review of total hip
Acknowledgements arthroplasty in patients with ankylosing spondylitis: perioperative
Thanks to all authors for their contributions and considerations and outcome. Open Orthop J 2015;9:483–8.
participation. [7] Saglam Y, Ozturk I, Cakmak MF et al. Total hip arthro-
plasty in patients with ankylosing spondylitis: midterm radiologic
and functional results. Acta Orthop Traumatol Turc 2016;50:
Conflict of interest 443–7.
None declared. [8] Sieper J, Rudwaleit M, Baraliakos X et al. The Assessment of
SpondyloArthritis international Society (ASAS) handbook: a guide
to assess spondyloarthritis. Ann Rheum Dis 2009;68:i1–44.
Funding
[9] He C, He X, Tong W et al. The effect of total hip replace-
This study was supported by the National Key Research and ment on employment in patients with ankylosing spondylitis. Clin
Development Program of China (No. 2017YFC0909000) and Rheumatol 2016;35:2975–81.You can also read