Automotive Industry Outlook and Workforce Issues as the Coronavirus Impact Escalates - National Association of Surface Finishers, MINASF, Butzel ...
←
→
Page content transcription
If your browser does not render page correctly, please read the page content below

Automotive Industry Outlook and Workforce
 Issues as the Coronavirus Impact Escalates
     National Association of Surface Finishers, MINASF, Butzel Long, and IHS Markit
Presenter Information
• Beth Gotthelf, Butzel Long / 248.258.1303 / Gotthelf@butzel.com
• Mike Wall, IHS Markit / 248.728.8400 / mike.wall@ihsmarkit.com
• Rebecca Davies, Butzel Long / 313.225.7028 / davies@butzel.com

                               © Butzel Long 2020
COVID-19 Impacts All Parts of Your Business

                               Human
                              Resources

                 ?                             Operations

                              COVID-19

              Reception                        Maintenance

                            Environmental
                             Compliance

                          © Butzel Long 2020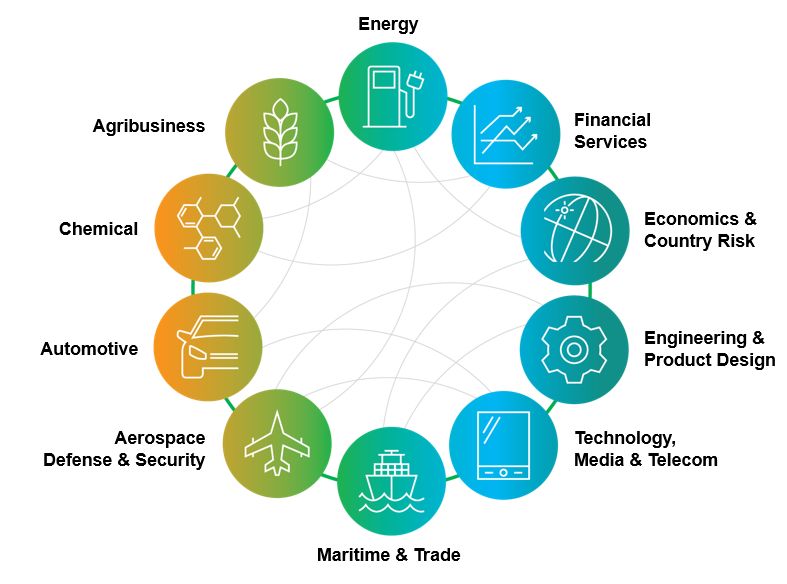
Automotive Industry
                       Outlook:
                       Adjusting to the Realities of a
                       Recession Environment
                       March 2020

                       Mike Wall
                       Executive Director, Automotive Analysis
                       +1 248 728 8400 Direct
                       +1 616 446 6885 Mobile
                       Mike.Wall@ihsmarkit.com

© 2020 IHS Markit. All Rights Reserved.
5
A World Leader in Critical Information, Analytics and Solutions
Addressing Strategic Challenges with Interconnected Capabilities
50,000+ 85%
customers in of the Fortune
140+ countries 500 companies
94/100 $4B
largest US annual revenue
corporations | NYSE: INFO
© 2020 IHS Markit. All Rights Reserved.6
Economic Update: Impact of COVID-19
• Global GDP: Global GDP
> U-shaped recovery – not V-shaped as all major areas are impacted – consumer 3.0
confidence and private investment rebound will take a couple of quarters 2.5
GDP Growth %
> Global GDP: 2019 2.6%, 2020 0.9% (down 1.6 pts), and 2021 forecast of 2.5% 2.0
growth (based upon a slow 2020) 1.5
> Global fiscal and monetary coordination is poor and lacks impact – improvement 1.0
required. Rebound – domestic focus shifts to export impact. 0.5
• US GDP: 0.0
2019 2020 2021
> Entering recession in March. In recession through late 2020 – private investment,
retail activity, fixed investment, reduced wealth effect and construction are all
severely constrained. 2020 GDP is forecast at -1.7% followed by a 3.8% growth in US GDP
2021. 5.0
> Fiscal stimulus of over $2T is forthcoming. Unemployment may approach 9% by 4.0
late-2020. Wealth effects and reduced oil price have impacts. 3.0
GDP Growth %
2019
> Exchange rates will be under pressure due to slower exports and low interest rates. 2.0
2020
• China: 1.0
2021
0.0
> Q12020 GDP -5.4%, 2020CY 3.9% / 90-95% of businesses have resumed –
domestic rebound shifts to export slowdown. -1.0
-2.0
• Europe
> GDP in EU and UK both are forecast for -1.3% in 2020 Few upside risks – mainly downside risks
© 2020 IHS Markit. All Rights Reserved.7
COVID-19 Autos Assessment: It’s not Doomsday, It Just Feels Like It
Key Forecast Assumptions
• Global spread of the coronavirus pandemic has emerged as the single biggest risk factor facing the
autos industry for many years
• 2020 world real GDP growth reset below +0.9% (recession) (was +1.7%)
• We project a U-shaped cycle with sharp reduction in near-term growth followed by a slow recovery
• Real GDP growth for China revised down to +3.9% for 2020 (was +4.3%)
• Eurozone GDP growth forecast to slump -1.3% in 2020 (was 0.0%)
• US expectations are reset at -1.7% GDP growth for 2020 (was +1.8%)
Key Uncertainties
• Forecasting in this environment is hard
• We are in the midst of a major generational event & we anticipate rolling disruption to the autos
industry, especially across the next 6-9 months
• Forecast risks are overwhelmingly on the downside & depend crucially how governments respond
(health/economic crises)
Note: March GDP growth forecasts compared to Interim early March forecast
Note: China refers to Mainland China
© 2020 IHS Markit. All Rights Reserved.8
IHS Markit manufacturing PMIs® point to a serious downturn
Purchasing Managers’ Indexes
65
Index, over 50 signals expansion
60
55
50
45
40
35
30
2007 2008 2009 2010 2011 2012 2013 2014 2015 2016 2017 2018 2019 2020
United States Eurozone China Japan
Source: IHS Markit © 2020 IHS Markit
© 2020 IHS Markit. All Rights Reserved.9
JPMorgan Global PMIs® Show Service Sectors are also Contracting
Global Economic Output Contracts at Fastest Pace Since 2009
Purchasing Managers’ Indexes
62
Index, over 50 signals expansion
56
50
44
38
32
2006 2007 2008 2009 2010 2011 2012 2013 2014 2015 2016 2017 2018 2019 2020
Composite Manufacturing Service
Source: IHS Markit © 2020 IHS Markit
© 2020 IHS Markit. All Rights Reserved.10
Economic Bottom Line:
The Outlook will Probably get Worse Before it Gets Better
• The onset of the global recession was sudden and dramatic.
• While there are parallels with 2008/09, there are also differences.
• Unlike the global financial crisis, COVID-19 is both a supply-side and a demand-shock.
• While swift monetary action is welcome and will help to stabilize financial markets, it will
do little to slow the virus or limit the economic damage (e.g. un-freeze supply chains and
encourage people to travel more).
• What is needed is swift and targeted fiscal action to boost healthcare spending (to slow
the spread of the disease) and relief for household who can’t go to work and businesses
(especially small ones) whose sales have plummeted.
• So far, the fiscal actions have been not nearly enough.
© 2020 IHS Markit. All Rights Reserved.11
2020 Light Vehicle Forecast Outlook
1. Coronavirus uncertainty adds to already-pressured autos industry—2020 expected to witness unprecedented
instant stalling of demand—impacts will be rolling as coronavirus spreads
2. Expected global 2020 slump similar to 2-year decline global recession 2008/2009—with risks skewed to downside
& ultra-dependent on govt. action & support/stimulus packages
3. “Patient zero” China market should bottom out in 2020—hopes for beginnings of recovery from 2021—some
demand likely to have been destroyed
4. Europe gripped by full-scale coronavirus crisis with demand conditions worsening by the day—region faces
months of disruption (Brexit talks & EU30 CO2 plans might require delays)
5. Expected US recession leads to sharp consumer contraction & immediate LV demand slump
6. ROW mixed prospects – early crisis markets seem to be coping but risk “flare-ups” & early days for Brazil, Russia,
India. Iran shows how virus can hit hard in less developed economies
7. Remote/flexible crisis working arrangements could influence future mobility patterns…
© 2020 IHS Markit. All Rights Reserved.12
Near-Term Auto Forecast: Impact of COVID-19
NA LV Sales
• 2020 Sales Outlook: US LV Sales forecast has been revised to 14.5M
17.1
17.1
16.6
16.3
(from 16.5 in February – down 6.7%) and 15.6M in 2021 (from 16.3M in
15.7
18
Sales Millions
14.5
16
February – down 12.1%). A similar decline is expected for Canada down to 2019 2020 2021
14
1.66M in 2020 though Mexico is expected to slow to 1.10M vs. a stronger 12
2019 pace. 10
8
• Slower sales driven by declining consumer confidence, reprioritized spending, 6
~1.80
severely reduced economic activity.
1.92
1.92
1.90
1.85
~1.13
4
1.66
1.32
1.32
1.29
1.25
1.10
2
• Inventory expected to decline from ~3.6 mil units to below 3.1 mil as OEMs sell 0
US Feb US March Can Feb Can March Mex Feb Mex March
off inventory in a slower US vehicle sales market. Forecast Estimate Forecast Estimate Forecast Estimate
• 2020 Production Outlook: NA production setting is estimated to decline to
NA LV Production
~14.1M units from 16.5M in the February forecast. 2021 volumes are
estimated to fall to 16.0M from a previous setting of 16.4M.
16.5
16.4
16.3
16.3
17.0
• OEMs may possibly furlough the entire production system in NA for a 4-5 week
16.0
NA Prod Millions
16.5
period. Production per week in NA is ~350,000 units. It would take ~1 month of 16.0
overtime to make up for this production (if required). 15.5
15.0
14.1
• Rental fleets and entry level will be harder hit due to travel declines and entry-level 14.5
wages. 14.0
13.5
• Despite significant liquidity in the system, credit for more difficult buyers may 13.0
12.5
tighten considerably. February Forecast Revised March Estimate
2019 2020 2021
© 2020 IHS Markit. All Rights Reserved.13
Stalling Global Demand as COVID-19 Contagion Spreads Around the World
Expected 2020 Slump Worse Than 2-year Decline During Global Recession of 2008/2009
Global Light Vehicle Sales Outlook
Millions Mar-20 (V2)
(% chg)
Growth
100.0
Mar V2
Market
Jan-20
2020
TIV
vs.
90.0
80.0
China 22.4m -9.9% -2.3m
70.0
USA 14.5m -15.3% -2.4m
60.0
WE/CE 15.6m -13.6% -1.9m
50.0
40.0 Global 78.8m -12.2% -10m
Source: IHS Markit – March 2020 LVS Forecast © 2020 IHS Markit
Note: China refers to Mainland China
© 2020 IHS Markit. All Rights Reserved.14
China: Deeper & Longer Gouge to Normal Consumption Pattern Due to
COVID-19 Creates a More Severe Downgrade to Vehicle Demand
• Economic slowdown disproportionally felt by private
Mainland China: COVID-19 Impacted LV Sales Forecast (Mar-20 V2) companies (non-SOE) & SMEs
Millions
• Demand Shock: dealer sales level in 1st week of
29.0 March only reached 38% of that same period in 2019
(CADA) although numbers of confirmed cases have
27.0 fallen sharply across provinces for the past month
25.0 • Slow ramp up in new model launches as OEMs
struggling for seamless cooperation among supply
23.0 chain, production, sales & logistics.
OEM production resumption rate hit +85% (MIIT) &
21.0 suppliers capacity utilization rate climbed to 75% in
the 1st week of March (IHSM)
19.0
• We expect vehicle demand to drop by 41% in Q1
17.0 followed by modest rebound in Q2 assuming the
spread of virus is at least under control in Q2
15.0
2015 2016 2017 2018 2019 2020 2021 2022 2023 2024 • Aversion to public transport post-outbreak could help
vehicle sales but we only expect modest demand
Mar '20 (V2) Jan '20 rebound due to much higher vehicle density & slower
economic growth
Note: China refers to Mainland China 2020 2021 2022 2023
• More significant incentives required to substantially
% Growth YoY -9.9% 6.9% 7.4% 5.2% change this picture. Easing licence place restrictions
in key cities only limited impact
Vol Delta vs. Pre-Crisis Jan Forecast -2,265,000 -1,590,000 -990,000 -760,000
© 2020 IHS Markit. All Rights Reserved.15
US: Sharp Consumer Contraction Expected to Impact Auto Sales Immediately
& Weak Economic Recovery Outlook in 2021 Sustains Pressure
• Consumer-led recession assumption beginning from
US: COVID-19 Impacted Light Vehicle Sales Forecast (March 2020 V2) Q2 & lasting through the end of the year now the
Millions
baseline U.S. economic forecast setting
18.0
• Federal Reserve announced aggressive policy
17.0
responses to the crisis: an immediate cut in the
federal funds rate to near zero (a target range of 0%
16.0 to 0.25%) & announcement of a program that will
result in the expansion of the Fed’s holdings of
15.0 Treasury securities & Agency mortgage-backed
securities over coming months (total ~$700bn)
14.0
• Could rise to $850-$1tn with other fiscal policy
13.0
measures but probably not enough to stave off
12.0 recession (e.g. $1k direct payments $250bn TBC)
11.0 • State & city-level policies limiting large gatherings &
“shelter-in-place” restrictions which could impact
10.0 monthly autos sales levels in the immediate term (at
2015 2016 2017 2018 2019 2020 2021 2022 2023 2024
least -20% y/y). Americans typically buy-from-stock so
demand fluctuations can be instant (esp. mass
Mar '20 (V2) Jan '20 market) (CV-19 impacted cities trending negative on
daily sales analysis). Renewals for rental fleets
2020 2021 2022 2023 impacted (seasonal purchase timing) –
delay/destruction
% Growth YoY -15.3% +8.7% +1.7% +1.2%
• Auto lenders & OEMs already rolling out special
Vol Delta vs. Pre-Crisis Jan Forecast -2,360,000 -870,000 -440,000 -260,000
© 2020 IHS Markit. All Rights Reserved. programs (delayed payments, 0% financing)16
Europe: Gripped by Full-Scale COVID-19 Crisis with Demand Conditions
Worsening by the Day – Region Faces Months of Disruption
• Epicenter of the coronavirus outbreak has shifted from
EU (WE/CE): COVID-19 Impacted LV Sales Forecast (March 2020 V2) China to Europe. Lockdowns in place esp. Italy, Spain,
France & UK. Partial lockdown in force in Germany. EU
Millions to close its borders to all non-essential travel to fight
18.5 coronavirus
18.0
• EZ now in recession, with real GDP expected to decline
17.5 again in the first quarter due coronavirus
17.0 • March registrations likely to provide mixed picture (-
16.5 30% / -500k) with future monthly regs expected to
plummet further on geographical spread of virus & CV-
16.0 19 restrictions. We foresee at least 4-6 months of
disruption. Car dealers temporary closed in Germany,
15.5
Italy & Spain. Rental fleet renewal impact (esp. tourist
15.0 regions)
14.5 • Rolling shut downs of European automotive plants (at
14.0 least 2 weeks as a start)
2015 2016 2017 2018 2019 2020 2021 2022 2023 2024
• Despite not cutting rates, ECB announced measures to
Mar '20 Jan '20 support bank lending & expanded its asset purchase
program (BoE cut & has loans)
2020 2021 2022 2023 • Most European governments announcing economic
% Growth YoY -13.6% 4.2% 4.3% 1.4% support/stimulus measures (€/£); Brexit talks & EU30
CO2 plans might require delays (no news yet)
Vol Delta vs. Pre-Crisis Jan Forecast -1,904,000 -1,120,000 -526,000 -420,000
© 2020 IHS Markit. All Rights Reserved.17
Global Light Vehicle Production
COVID-19 Impact Extends Well Beyond China; Further Downside Risk Exists
100 February 2020
forecast – initial
COVID-19 assessment
95
plus interim March
China forecast
Production (millions)
90
94.2
85
million 88.9
million
80
-237,000 -727,000 -776,000 -1,309,000 -2,219,000 -2,793,000 -2,956,000
75
77.9
million
-12.4%
70
65
2018 2019 ME/ Africa South South Asia Japan/ Korea North Greater Europe 2020
America America China
Source: IHS Markit Light Vehicle Production Forecast
© 2020 IHS Markit. All Rights Reserved.18
US Light Vehicle Sales in Alternative Scenarios
Mind the Gap(s)!: Multi-Scenario Planning in a Time of Uncertainty
Light Vehicle Sales (Quarterly SAAR)
Watchlist 20 Old Baseline (50%)
• Economic outlook Old Pessimistic (45%)
18
• Consumer confidence
Mill. of units, annual rate
Old Optimistic (5%)
• Regional quarantines
16
• Supply chain disruptions
• Used vehicle pricing 14
• Uncertainty
• Credit, credit, credit 12
10
8
2006 2008 2010 2012 2014 2016 2018 2020 2022
Source: IHS Markit
© 2020 IHS Markit. All Rights Reserved.19
North American Light Vehicle Production
COVID-19 Poses Greatest Threat to Near-Term Outlook
North American Light Vehicle Production
Short term
18.0
COVID-19 related plant shutdowns
Millions
17.8
17.5 Quarantine areas impact demand (and
17.0 production)
17.1 17.0 17.1
16.4 16.5
16.7 Inventory in the system can help offset
16.0 16.3 16.3
16.2 some of the plant disruption impact
16.0
Component shortages remain a risk
15.0 OEMs to prioritize profitable programs
14.0 Long term
14.1
Positioning for the demand recovery,
13.0 whether it is U- or V-shaped
USMCA implications
12.0 Continued shift to trucks and utilities
BEV implications
Policy and regulatory uncertainty
Production volume
Source: IHS Markit © 2020 IHS Markit Life-cycle pressure
© 2020 IHS Markit. All Rights Reserved.20
North American Light Vehicle Production
Customer Mix is Changing; Opportunity Targeting is More Critical than Ever!
North America Light Vehicle Production Divergent trajectories – 2019 to 2027
20.0
Domestics
Millions
-52K units or -0.7%
18.0
8.5 Offshoring to China
16.0 8.4 8.1 8.5 8.6
8.0 7.8 8.1 8.2 8.4 8.5 Increasing shift to trucks
14.0 More closely tied to US sales
7.1
12.0 Build where you sell
10.0 Transplants
8.0 9.2 +691K units or +8.7%
8.6 8.6
8.0 7.7 7.6 7.6 7.6 7.7 7.9 Localization
7.5
6.0 6.6
Capacity expansion
4.0
Global sourcing and export risk
2.0
New Mobility
0.0 +105K units or +28.7%
2016 2018 2020 2022 2024 2026
Tesla largest component
Detroit 3 New Mobility Transplants
Monitoring other start-ups
Source: IHS Markit © 2020 IHS Markit
© 2020 IHS Markit. All Rights Reserved.21
North America Light Vehicle Production
Life-Cycle Risk
Anatomy of Current Life-Cycle Environment
Shifting Slowing Life-cycle Program Program
resources demand pressure review extension
• Regulations • Motivations • Cost structure • Planning volumes • Recoup investment
• Technology • Affordability • Competition • Investment • Implications
• Costs • Recession catalyst • Launch activity • Collateral impact • Actions
Source: IHS Markit © 2020 IHS Markit
© 2020 IHS Markit. All Rights Reserved.22
North America Light Vehicle Production Launches by Vehicle Type
Capital Needs Intensify with New Launch Activity; Launch Timing has Become More Volatile
North America Light Vehicle Production Launches Strong launch activity
45
Launches amid industry slowdown
Will new product be king?
40 39
Quality volume versus quantity
35 34
35
31
33 Utility vehicle expansion continues
30 28 29 Competitiveness weighs on leaders
26 20
25 15 Pricing and margin pressure
22 22 23
23 BEV activity
20 15 23 19
14
30+ all-new nameplates
11 7 3
15
18 9.3% or 1.6 million units of North
4 3 American production by 2027
10 5 5 5
2
12
15 5 Tesla from 81% to 22% of total
5 9 10
7 2 Product redundancy
6 6 6 5 3
0 Varied strategies
2018 2019 2020 2021 2022 2023 2024 2025 2026 2027
Car Pickup Utility
Legacy programs as a hedge
Source: IHS Markit © 2020 IHS Markit Extended lifecycles amid future costs
© 2020 IHS Markit. All Rights Reserved.23
Powertrain Technology Outlook
Regional Preferences and Incentives Result in a Varied Propulsion Mix; Watch the Model Count!
Global Propulsion Design Islands in 2032
20%
16%
13% 39%
45% Japan/
5% Europe South Korea
20%
8% 23%
North
America 8%
10% 13%
6%
12% 21%
62%
ICE Only & 40%
29%
Stop-start Greater
40%
MHEV China
FHEV Global
PHEV
7% 26%
Electric
4%
Source: IHS Markit Powertrain Production Forecast 7% 9%
17%
© 2020 IHS Markit. All Rights Reserved.24
Supplier Dynamics
Structural Implications of the Growth in Electrification and Automation In North America
Electrification and Vehicle Automation – North America
50%
% Share of NA Production
45%
40%
35%
30%
25%
20%
15%
10%
5%
0%
Vehicle Electrification L2/L3 Driving Automation
2020 2030
Source: IHS Markit © 2020 IHS Markit
Electrification = Hybrid, Electric, Fuel Cell
© 2020 IHS Markit. All Rights Reserved.25
Thank You!
Mike Wall
Executive Director, Automotive Analysis
mike.wall@ihsmarkit.com
+1 248 728 8400 Direct
+1 616 446 6885 Mobile
IHS Markit Customer Care
CustomerCare@ihsmarkit.com
Americas: +1 800 IHS CARE (+1 800 447 2273)
Europe, Middle East, and Africa: +44 (0) 1344 328 300
Asia and the Pacific Rim: +604 291 3600
Disclaimer
The information contained in this presentation is confidential. Any unauthorized use, disclosure, reproduction, or dissemination, in full or in part, in any media or by any means, without the prior written
permission of IHS Markit Ltd. or any of its affiliates ("IHS Markit") is strictly prohibited. IHS Markit owns all IHS Markit logos and trade names contained in this presentation that are subject to license.
Opinions, statements, estimates, and projections in this presentation (including other media) are solely those of the individual author(s) at the time of writing and do not necessarily reflect the opinions of IHS
Markit. Neither IHS Markit nor the author(s) has any obligation to update this presentation in the event that any content, opinion, statement, estimate, or projection (collectively, "information") changes or
subsequently becomes inaccurate. IHS Markit makes no warranty, expressed or implied, as to the accuracy, completeness, or timeliness of any information in this presentation, and shall not in any way be
liable to any recipient for any inaccuracies or omissions. Without limiting the foregoing, IHS Markit shall have no liability whatsoever to any recipient, whether in contract, in tort (including negligence), under
warranty, under statute or otherwise, in respect of any loss or damage suffered by any recipient as a result of or in connection with any information provided, or any course of action determined, by it or any
third party, whether or not based on any information provided. The inclusion of a link to an external website by IHS Markit should not be understood to be an endorsement of that website or the site's owners
(or their products/services). IHS Markit is not responsible for either the content or output of external websites. Copyright © 2018, IHS MarkitTM. All rights reserved and all intellectual property rights are
retained by IHS Markit.
© 2020 IHS Markit. All Rights Reserved.Coronavirus Webinar: The Employment Perspective Rebecca Davies / 313.225.7028 / davies@butzel.com
Introduction
•   Address questions that employers are currently facing regarding COVID-19.
•   Understand that the laws are changing almost daily and may impact future advice.
•   Some of the answers are dependent on state law - - it is important to check the state in
    which you have operations to review applicable state law
•   Remember we are lawyers and not medical professionals.
•   Finally, we are only one piece of the puzzle – please refer to the Butzel Long Coronavirus
    (COVID-19) Resource Center on Butzel.com for the impact of COVID-19 on other areas of
    your business:

                                           © Butzel Long 2020
Can you send an employee home that is
presenting symptoms of COVID-19?
– Sending employees home is permissible if done in a non-discriminatory manner.
– Various factors to review to determine if you have to pay any of your employers:
• whether there is a collective bargaining agreement in place;
• the employee’s classification of exempt or non-exempt;
• the Company’s Paid Leave Policies (Sick Leave, PTO or Vacation Time);
• the required 40 hours of paid leave under Michigan’s Paid Medical Leave Act (if not already included in the
above paid leave policies);
• the employee’s previous use of any paid time off;
• the possible application for Short-Term Disability (depending on the reason and length of the illness); and
• possible application of The Families First Coronavirus Response Act (discussed in detail later)
– Employers need to consider adding increased flexibility and possibly increased time off.
– Return-to-Work Requirements
© Butzel Long 2020Can you take an employee’s temperature?
• ADA restricts employers from conducting medical examinations and the EEOC
generally considers taking temperature to be a medical exam.
• However, the EEOC’s position during a pandemic has been revised its opinion:
2. When may an ADA-covered employer take the body temperature of employees during
the COVID-19 pandemic?
Generally, measuring an employee's body temperature is a medical examination. Because
the CDC and state/local health authorities have acknowledged community spread of
COVID-19 and issued attendant precautions, employers may measure employees' body
temperature. However, employers should be aware that some people with COVID-19 do not
have a fever.
© Butzel Long 2020What steps do you take if employee now informs HR
that s/he has been diagnosed with COVID-19?
– Inform necessary workplace of COVID diagnosis but do NOT identify by name the
infected employee.
– Perform risk assessment of employees who had contact with the individual.
– Tell employees who worked closely with the employee to stay home for 14 days
and monitor themselves for symptoms.
– Disinfect affected workspaces and common area through a deep cleaning.
– Work with CDC or local health officials in their investigation and comply with any
directives.
Is there any difference if it is not employee who is sick but the employee reports
that their spouse or child was diagnosed with COVID-19?
© Butzel Long 2020Do you have notice obligations under the WARN Act if
forced to suspend operations because of COVID-19?
– WARN Act general applies to an employer with 100 or more employees
– Covered Employer must provide written notice at least 60 days in advance of:
(1) a plant closing; or
(2) mass layoff affecting 50 or more employees at a single employment site.
– Length of Layoff: 6 months or more
– Exceptions to provide advance notice (such as unforeseeable circumstances).
– Advance notice does not excuse failure to provide notice.
– Very Fact Specific – seek input from your legal counsel.
– ALSO NEED TO CONSIDER STATE MINI-WARN ACT REQUIREMENTS
© Butzel Long 2020Can we prohibit employee from traveling on
her/his personal time?
– Educate about the health risk of travel (referring them to CDC
recommendations).
– Advise employee of the risk of quarantine when employee returns.
– Advise employee of risk that employee may not be able to return
because of cancelled flights or restricted travel abroad.
– Be sure to set expectations.
– Review local or municipality for travel restrictions.
– Be consistent!
© Butzel Long 2020What is an employee refuses to work or
travel for business?
Factors to consider:
• Employees generally cannot refuse to come to work—
OSHA requires imminent danger
• Section 7 of the National Labor Relations Act
• Flexibility
** Please note: First public policy lawsuit filed in Michigan for
termination where employee believed that working was in
violation of Governor’s restriction order
© Butzel Long 2020CONTINUATION - Employee refuses to work
or travel from home
Does the analysis change if the employee has a disability?
– Engage in interactive process if accommodations are requested.
– Understand ADA obligations of providing a “reasonable”
accommodation.
– Leave of Absence may be considered an accommodation but not
necessarily always - - dependent on the circumstances of the job.
Can you give preferential treatment?
– Avoid imposing ADA-restrictions not requested.
– Avoid treating employees as “regarded as” disabled.
© Butzel Long 2020Shelter-in-Place / Stay-At-Home Laws
• More than 10 orders issued by States and
Municipalities
• Scope of Orders Vary
• If business is exempted and employee is deemed
essential, need to provide travel papers
• This is not business-as-usual, need to follow state,
local and CDC precautions
© Butzel Long 2020Families First Coronavirus Response Act
(FFCRA)
• March 19, 2020 President Trump signed
into law is Effective April 1, 2020, and
continues through December 31, 2020
• Two Important Acts within
•FMLA Expansion Act
•Emergency Paid Sick Leave Act
© Butzel Long 2020Which employers are covered?
• FMLA Expansion • Emergency Paid Sick Leave
– Fewer than 500 employees and – Fewer than 500 employees and
public agencies covered under FMLA public agencies that employ 1 or
– Small Businesses (under 50 more employees
employees) may be exempt under – Small Businesses (under 50
future DOL regulations if complying employees) may be exempt under
with the Act would “jeopardize the future DOL regulations if complying
viability of the business as a going with the Act would “jeopardize the
concern” viability of the business as a going
– 50 employee / 75 mile radius rule concern”
intact – The DOL may issue regulations
– Special Rule for Health Care allowing employers of health care
Providers—health care providers or providers and emergency responders
emergency responder may elect to to opt-out of the benefits.
exclude employees from these
benefits
© Butzel Long 2020Which employees are covered?
• FMLA Expansion • Emergency Paid Sick Leave
– Employees working for at least 30 days – All employees—it doesn’t matter how long
– Must be unable to work (or telework) AND they have been working
– Must caring for a minor son or daughter – Must be unable to work (or telework) AND
because the child’s school or place of care is – Must fall into one of six categories
closed or unavailable due to a declared
health emergency for COVID-19 by a Federal, – (1) Employee subject to quarantine from
State, or local authority government
– (2) Employee subject to quarantine from
health care provider
– (3) Employee has COVID-19 symptoms and
seeking diagnosis
– (4) Employee is caring for individual subject
to quarantine
– (5) Employee is caring for child because
school or childcare is closed for COVID-19
– (6) Employee has another similar condition
© Butzel Long 2020 specified by DHHSFMLA Expansion—Benefits
• Partially paid and partially unpaid
• Unpaid leave
– First 10 days of leave
– Employee may use any accrued vacation leave, personal leave, or
medical or sick leave BUT employers cannot require employee to use
accrued PTO
– Possible use of 80 hours of Paid Sick Leave (discussed in further detail later)
• Paid leave
– 10 weeks are paid at least two-thirds of the employee’s regular rate of
pay
– Capped at $200 per day and $10,000 in the aggregate for entire duration
© Butzel Long 2020Expanded FMLA hour calculation for
employee with varying schedule
• The average number of hours the employee was
scheduled per day (including hours the employee took
for any leave) over the previous 6 months before leave
• If the employee did not work in past 6 months, use the
reasonable expectation of the employee at the time of
hiring of the average number of hours per day that the
employee would normally be scheduled to work
© Butzel Long 2020Employer’s other obligations under
Expanded FMLA
• Must restore the employee’s job when the employee returns
– Employers with fewer than 25 employees—if the employee’s
position no longer exists due to economic conditions or other
changes in operating conditions caused by a public health
emergency during leave THEN the employer does NOT have to
restore the employee’s employment, but must make reasonable
efforts to restore the employee to an equivalent position.
– Employer must make reasonable efforts to restore the employee to
position and if those fail, must contact the person within 1 year
beginning the earlier of the date of the qualifying need concludes
or 12 weeks after the date on which the employee’s leave
commences, if an equivalent position becomes available.
• Must continue health care benefits
© Butzel Long 2020Obligations under
Emergency Paid Sick Leave Act
• Must pay employees immediately—no waiting period!
• EE must be unable to work (or telework) AND
1. The employee is subject to a Federal, State or local quarantine or isolation order
related to COVID-19.
– This covers the recent shelter-in-place order (unless employer is exempt)
2. The employee has been advised by a health care provider to self-quarantine due
to concerns related to COVID-19.
– Doctor tells employee to self quarantine because she may have the virus or was in
contact with someone who had it
– Employer could require a note from doctor providing for such a recommendation if it feels
that employees may abuse the system
3. The employee is experiencing symptoms of COVID-19 and seeking a medical
diagnosis.
- Legally permissible to ask for doctor’s note but be flexible
© Butzel Long 2020Obligations under
Emergency Paid Sick Leave Act
4. The employee is caring for an individual subject to a
local quarantine or isolation order or who has been
advised by a health care provider to self-quarantine.
5. The employee is caring for the employee’s child if the
child’s school or childcare provider has been closed or
is unavailable due to COVID-19 precautions.
6. The employee is experiencing any other substantially
similar condition specified by the Secretary of Health
and Human Services.
© Butzel Long 2020Amount of pay under Paid Sick Leave Act
• Full-time: 80 hours paid sick time.
• Part-time: paid leave for number of hours that the employee works, on
average, over a 2-week period.
• Contingent or “variable” – average hours over 6 months or expected
average schedule.
• For leave having to do with the employee themselves (self care)—100%
regular rate of pay
– Cap: $511 per day or $5,100 (total)
• For leave relating to care for another, or for self care for reason “specified by
HHS” a condition like COVID-19—2/3rds regular rate of pay
– Cap: $200 per day or $2,000 (total)
© Butzel Long 2020Other considerations for
Emergency Paid Sick Leave Act
• Employers are prohibited from requiring—as a condition of giving sick pay—that the employee
look for or find a replacement employee
• Employers are prohibiting from requiring an employee to use other paid leave before the
employee uses the paid sick time under the Act
• Employer cannot discriminate against employee who takes leave under the act or files a
complaint/institutes any proceeding related to the Act
• Penalty for not providing sick leave under the Act: the same penalties under FLSA
– Minimum wage penalty,
– Owed amount of leave plus the same amount in liquidated damages,
– Attorney fees,
– Injunctive relief
• Employer must post a notice approved by DOL (model to be provided)
• Employer may require employees to follow reasonable notice procedures to continue to
receive paid sick time
© Butzel Long 2020FMLA Expansion and Emergency Paid Sick
Leave working together
• Employee cannot work because child’s school is
closed
• Emergency Paid Sick Leave could cover 2/3rds of
the employee’s wages for first 10 days / 80 hours
• FMLA Expansion would cover 2/3rds of the
employee’s wages for up to 10 weeks
© Butzel Long 2020Front the costs – Tax credits on back end
• Payroll tax credit to help employers cover the cost of wages under the
FFCRA
• If the amount of credit exceeds payroll taxes for the quarter, the excess
amount is refundable
• 3 components to the credit
– Wages – 100% of the wages paid under the Emergency Paid Sick Leave Act and
the Expanded FMLA are eligible for the credit.
– Hospital Insurance Tax – The credit is increased by the amount of the Hospital
Insurance Tax paid on eligible wages.
– Health Plan Expenses – The credit is increased by the health plan expenses
allocable to the employee during the period of leave. Health plan expenses are
amounts incurred to provide and maintain a group health plan, but only to the
extent they are excludible from the employee wages.
© Butzel Long 2020Rebecca Davies
313.225.7028
davies@butzel.com
THANK YOU!
© Butzel Long 2020Questions?
• Beth Gotthelf, Butzel Long / 248.258.1303 / Gotthelf@butzel.com
• Mike Wall, IHS Markit / 248.728.8400 / mike.wall@ihsmarkit.com
• Rebecca Davies, Butzel Long / 313.225.7028 / davies@butzel.com
© Butzel Long 2020• Disclaimer: These materials and presentations are
intended and designed for informational purposes
only – they do not provide legal advice and no
attorney-client relationship is created. No liability is
assumed in connection with the use of these
materials. Legal counsel should be consulted
regarding how applicable law impacts specific
situations.
© Butzel Long 2020You can also read