AVA: an Automatic eValuation Approach for Question Answering Systems
←
→
Page content transcription
If your browser does not render page correctly, please read the page content below
AVA: an Automatic eValuation Approach for Question Answering Systems

                      Thuy Vu                                     Alessandro Moschitti
                 Amazon Alexa AI                                    Amazon Alexa AI
              Manhattan Beach, CA, USA                          Manhattan Beach, CA, USA
               thuyvu@amazon.com                                 amosch@amazon.com

                    Abstract                            annotating all possible system pieces of output is
                                                        infeasible, the standard approach is to re-evaluate
    We introduce AVA, an automatic evaluation ap-
    proach for Question Answering, which given          the new output of the system manually. This dra-
    a set of questions associated with Gold Stan-       matically limits the experimentation velocity while
    dard answers (references), can estimate system      significantly increases the development costs.
    Accuracy. AVA uses Transformer-based lan-              A viable solution for specific NLP tasks such
    guage models to encode question, answer, and        as Machine Translation (MT), automatically esti-
    reference texts. This allows for effectively as-
                                                        mates an evaluation score between the system and
    sessing answer correctness using similarity be-
    tween the reference and an automatic answer,        the reference answers, which correlates with hu-
    biased towards the question semantics. To de-       man judgment, e.g., the BLEU score is one popular
    sign, train, and test AVA, we built multiple        measure (Papineni et al., 2002). Such methods
    large training, development, and test sets on       cannot be applied to a standard QA setting, since
    public and industrial benchmarks. Our innova-       QA systems, e.g., those developed for TREC-QA
    tive solutions achieve up to 74.7% F1 score in      track (Voorhees and Tice, 1999), have the purpose
    predicting human judgment for single answers.
                                                        to provide correct answers and are evaluated with
    Additionally, AVA can be used to evaluate the
    overall system Accuracy with an error lower         Accuracy, i.e., the percentage of correct answers.
    than 7% at 95% of confidence when measured          Segment overlapping metrics such as BLEU, ME-
    on several QA systems.                              TEOR, or ROUGE do not provide a binary out-
                                                        come, i.e., correct or incorrect (as this is not the
1 Introduction                                          aim of MT evaluation).
Accuracy evaluation is essential both to guide sys-        Hypothetically speaking, we could apply a
tem development as well as to estimate its quality, threshold to their score to obtain a binary outcome.
which is important for researchers, developers, and     However, it would not be sufficient as the correct-
users. This is often conducted using benchmark          ness of an answer loosely depends on the match
datasets containing a data sample, possibly repre- between the reference and candidate answers. Two
sentative of the target data distribution, provided     answers can be correct or incorrect independently
with Gold Standard (GS) labels (typically produced      of their overlap with the reference. For example,
with a human annotation process). The evaluation        for the question, What percentage of water in the
is done by comparing the system output with the         body?, associated with a reference, The percentage
expected labels using some metrics.                     of water in the body is 60%, a correct answer is
   This approach falls short when the system out- Most of the human body is water, with an average
put spans a large, possibly infinite set of correct     of roughly 60%. In contrast, an incorrect answer,
items. For example, in retrieval-based Question         still very similar to the reference, could be: The
Answering (QA) systems, a correct answer can be         percentage of water in the body is variable. The
any string in the referent text database. For exam- MT metrics above would find the similarity of the
ple, for the question, When did Marlins start?, an      reference with the incorrect answer higher than the
answer could be: The Miami Marlins began play           one of the references with the correct answer. Even
in the 1993 season as the Florida Marlins; They         a powerful model such as BERTScore (Zhang et al.,
started in 1993; They firstly played in 1993; In        2020) would not provide a higher score to the cor-
1993; or any possible natural language text convey- rect answer since it is an unsupervised approach,
ing the information that they started in 1993. As       not trained for this task.
                                                     5223
                       Proceedings of the 2021 Conference of the North American Chapter of the
             Association for Computational Linguistics: Human Language Technologies, pages 5223–5233
                          June 6–11, 2021. ©2021 Association for Computational Linguistics
It should also be noted that simply training mod- domain QA systems (Leidner and Callison-Burch,
els for matching the answer candidate with the 2003; Lin and Demner-Fushman, 2006; Shah and
reference will again not work. The question seman- Pomerantz, 2010; Gunawardena et al., 2015). How-
tics would radically influence the correctness of the ever, little progress has been made in the past two
answer. That is, match(t, r|q1 ) can be true while decades towards obtaining a standard method. Au-
match(t, r|q2 ) can be false, where t and r are a pair tomating QA evaluation is still an open problem,
of answer candidate and reference, and q1 and q2 and there is no recent work supporting it. As men-
are two different questions. tioned in the introduction MT unsupervised met-
In this paper, we study the design of models rics, e.g., BLEU score or BERTScore, are not either
for measuring the Accuracy of QA systems, i.e., a solution or a reasonable baseline for automatic
percentage of correct answers over a test set (to our QA evaluation. They could be used as features for
knowledge this is the first successful and thorough our models, but we designed several supervised ap-
study). In particular, we (i) build several baselines proaches based on pre-trained Transformer models,
based on pre-trained Transformer models (Devlin which subsume these MT features.
et al., 2019; Liu et al., 2019) to encode the triple, A remotely related research effort for automa-
question q, candidate t, and reference r, in different tizing answer evaluation concerns student essays.
ways; and (ii) propose a new attention mechanism, Short answer grading (SAG), or short answer scor-
peer attention, to model the interaction between t ing, involves the automatic grading of students’
and r, given the semantic bias of q. answers, typically written in free text, for a given
To develop and test our models, we created (i) a prompt or question (Mohler et al., 2011). This task
dataset, Web-based Question Answering1 (WQA) has been studied in (Mitchell et al., 2002; Pulman
for training and testing AVA, the point-wise estima- and Sukkarieh, 2005) for educational applications.
tion of QA system output, i.e., the evaluation if an Neural-based systems have also been recently pro-
answer is correct or not, given a GS answer; and posed to improve the models (Riordan et al., 2017;
(ii) a System Dataset (SD) constituted by a set of Wang et al., 2019). Despite the conceptual similar-
outputs from several QA systems, for which AVA ity, i.e., evaluating an answer, the problem setting
estimates their Accuracy. for the task is fundamentally different.
The results show a high F1 for point-wise mod- Specifically, SAG is prompt-centric; thus, the
els, up to 74.7%. AVA can almost always rank learning objective is to score accurately other dif-
systems in terms of Accuracy as manual annota- ferent answer variants for a particular question by
tion does. Finally, the Root Mean Square Error building models trained on previously known vari-
(RMSE) with respect to human evaluation depends ants (Wang et al., 2019). Besides, the answers,
on the datasets, ranging from 2% to 9.5%, with a while written in free text, are not typically com-
Std. Dev. lower than 5%. plete sentences. Therefore, the SAG design aims to
capture sufficient content covered in the reference
2 Related Work responses for a question. On the contrary, AVA is
Automatic evaluation has been an interesting re- designed to operate in an open-domain QA setting,
search area for decades (Papineni et al., 2002; where both the question and answer are arbitrary
Magnini et al., 2002). There are two typical strate- input and complete sentences.
gies to design an automatic evaluator: supervised
and unsupervised. In MT research, for example, 3 Problem definition and preliminaries
BLEU (Papineni et al., 2002) has been a very pop-
We consider retrieval-based QA systems, which are
ular unsupervised evaluation method for the task.
mainly constituted by (i) a search engine, retriev-
Other supervised methods have been recently pro-
ing top-k documents related to the questions, and
posed, most notably (Ma et al., 2019). Neural-
(ii) an Answer Sentence Selection (AS2) model,
based automatic evaluators for dialog systems were
which reranks passages/sentences extracted from
studied in (Ghazarian et al., 2019; Lowe et al.,
the documents. We can automatically evaluate the
2017; Tao et al., 2017; Kannan and Vinyals, 2017).
(i) Accuracy of the QA system, which is the per-
Automatic evaluation for QA was addressed
centage of correct top sentences, and (ii) complex
by Magnini et al. (2002) and also for multiple sub-
measures, such as MAP and MRR, which quantify
1
Available at github.com/alexa/wqa_ava the quality of the rank produced by the AS2 model.
5224q: What is the population of California? pora if they contain questions with multiple correct
r: With slightly more than 39 million people (ac-
cording to 2016 estimates), California is the na- answers. For this purpose, we created our dataset
tion’s most populous state—its population is al- WQA for AS2 and transformed it into AVA-WQA.
most one and a half times that of second-place We describe our approach to transforming AS2 to
Texas (28 million).
s: 39 million AVA datasets in this section. Finally, we build an-
t: The resident population of California has been other benchmarking dataset for AVA constituted by
steadily increasing over the past few decades and
has increased to 39.56 million people in 2018.
a set of QA systems and their output on target test
sets. This is used to measure the end-to-end system
Table 1: An example of input data performance (system-wise evaluation).
3.1 Answer Sentence Selection (AS2) 4.1 AS2 datasets
The task of reranking answer sentence candidates These datasets consist of a set of questions Q, and
provided by a retrieval engine can be modeled with for each q ∈ Q, there are Tq = {t1 , . . . , tn } candi-
a classifier scoring the candidates. Let q be a ques- dates, comprised of both correct answers Cq and
tion, Tq = {t1 , . . . , tn } be a set of answer sentence incorrect answers Cq , Tq = Cq ∪ Cq .
candidates for q, we define R as a ranking function, WQA: The Web-based Question Answering is
which orders the candidates in Tq according to a a dataset built by Alexa AI as part of the effort to
score, p (q, ti ), indicating the probability of ti to improve understanding and benchmarking in QA
be a correct answer for q. Popular methods mod- systems. The creation process includes the follow-
eling R include Compare-Aggregate (Yoon et al., ing steps: (i) given a set of questions we collected
2019), inter-weighted alignment networks (Shen from the web, a search engine is used to retrieve up
et al., 2017), and Transformers (Garg et al., 2020). to 1,000 web pages from an index containing hun-
dreds of millions of pages. (ii) From the retrieved
3.2 Automatic evaluation of QA documents, all candidate sentences are extracted
The AVA performance can be measured in two and ranked using AS2 models from (Garg et al.,
ways: (i) evaluation of the single answers provided 2020). Finally, (iii) top candidates for each ques-
by the target system (point-wise evaluation); and tion are manually assessed as correct or incorrect by
(ii) the aggregated evaluation of a set of questions human judges. This allowed us to obtain a richer
(system-wise evaluation). We define the former variety of answers from multiple sources with a
as a function: A (q, r, ti ) → {0, 1}, where r is higher average number of answers, as shown in
a reference answer (from GS) and the output is Table 2.
simply a correct/incorrect label. Table 1 shows an
example question associated with a reference, a 4.2 Point-wise datasets for AVA
system answer, and a short answer s2 . We use AS2 datasets as follows: firstly, we only
A can be applied to compute the final Accu- keep questions with at least two correct answers,
racy of a system using an aggregator function: we which is critical to build positive and negative
simply assume the point-wise AVA predictions as examples. Secondly, given hq, ti , tj i, where ti , tj
they were the GS. For example, in case of Ac- are two candidates, we build:
curacy, P we simply average the AVA predictions, AVA-Pos = hq, (ti , tj ) ∈ Cq × Cq and ti 6= tj i
1
i.e., |Q| q∈Q A(q, r, t[, s]), where s is a short GS AVA-Neg = q; (ti , tj ) ∈ Cq × Cq
answer (e.g., used in machine reading). It is an We create AVA-WQA from WQA. The statistics
optional input, which we only use for building a are shown in Table 2.
linear model baseline, described in Section 5.
4.3 AVA System Dataset (SD)
4 Dataset creation
To measure AVA with respect to the overall sys-
To learn and test our models, we needed to build tem Accuracy, we need to have a sample of sys-
AVA datasets. The interesting aspect is that we can tems and their output on different test sets. We
automatically derive them from standard AS2 cor- created a dataset with candidate answers collected
2
from eight systems answering a set of 1,340 ques-
The latter can be very effective but it adds an additional
annotation cost, thus we limit its use just for the baseline tions. The questions were again sampled from the
model. That is, we aim to have a lower cost AVA model. Web. We only considered information questions.
5225WQA WQA Qs with multiple As AVA-WQA
data split #Qs #As #wrong-As #Qs #As #wrong-As positives negatives total
Train 262 5,399 20,801 245 5,382 20,748 183,894 349,765 533,659
Dev. 283 8,682 19,618 276 8,674 19,502 430,230 426,246 856,476
Test 294 9,412 19,988 281 9,399 19,790 479,028 449,625 928,653
Table 2: WQA and AVA-WQA Statistics
The systems differ from each other in multiple 5.2 Transformer-based models
ways including: (i) modeling: Compare-Aggregate
(CNN-based) and different Transformers-based ar- Transformer-based architectures have delivered
chitectures with different hyper-parameter settings; powerful language models, which can capture com-
(ii) training: the systems are trained on different plex similarity patterns. Thus, they are suitable
resources; (iii) candidates: the pool of candidates methods to improve our basic approach described
is collected and filtered differently and in different in the previous section. Following the linear clas-
numbers; and (iv) retrieval: different search en- sifier modeling, we propose three different ways
gines, diverse indexed data sources, and different to exploit the relations among the members of the
retrieval settings. This system variability provides tuple (q, r, s, t).
high generality of our AVA results. Let B be a pre-trained language model, e.g.,
the recently proposed BERT (Devlin et al., 2019),
5 Models for AVA RoBERTa (Liu et al., 2019), XLNet (Yang et al.,
2019), AlBERT (Lan et al., 2020). We use B to
The central intuition for the design of an automatic compute the embedding representation of a tuple:
QA evaluator is (i) capturing the same information B (a, a0 ) → x ∈ Rd , where (a, a0 ) is a short text
a standard QA system uses, while (ii) exploiting pair, x is the output representation of the pair,
the semantic similarity between t and r, biased and d is the dimension of the output representa-
by q. We build three types of models: (i) a linear tion. We use a standard feedforward network, i.e.,
classifier, which is more interpretable and can help A (x) = W| x + b, to implement the classification
the model design, (ii) Transformer-based methods, layer, deciding if an answer is correct, where W
based on powerful language models, and (iii) our and b are parameters we learn by fine-tuning the
Peer Attention approach to better model the inter- model on AVA datasets. We describe the following
action among q, t, and r. different designs for A.
5.1 A linear classifier A0 : Text-pair embedding
We build a language model representation for
Given an input example, (q, r, s, t), our classi- pairs of members of the tuple, x = (q, r, t) by sim-
fier uses the following similarity features: x1 =is- ply inputting them to Transformer models B in the
included(s, t), x2 =sim-text(r, t), x3 =sim-text(r, q); standard sentence pair fashion. We consider four
and x4 =sim-text(q, t), where is-included applied to different configurations of A0 , one for each of the
s and t is a binary feature testing if t includes s, following pairs: (q, r), (q, t), (r, t), and one for the
sim-text is a sort of Jaccard similarity defined as: triplet, (q, r, t), modeled as the concatenation of the
|tok(s )∩tok(s )|
sim-text (si , sj ) = 2 |tok(sii)|+|tok(sjj )| , and tok (s) is previous three representations. The representation
a function that splits s into tokens. for each pair is produced by a different and inde-
Let x = f (q, r, s, t) = (x1 , x2 , x3 , x4 ) be a pendent Transformer instance, i.e., Bp . More for-
similarity feature vector describing our evaluation mally, we have the following three models A0 (Bp ),
tuple, and let l be a binary label indicating whether ∀p ∈ P0 , where P0 = {(q, r), (q, t), (r, t)}. Ad-
t answers q or not. We train w on a dataset D = ditionally, we design a model over (q, r, t) with
{(xi , li )}, i = 1, .., |D|, using SVM. We compute A0 (∪p∈P0 Bp ), where ∪ means concatenation of
the point-wise evaluation of t as the test xi ·w > α, the representations. We do not use the short an-
where α is a threshold trading off Precision for swer, s, as its contribution is minimal when using
Recall in standard classification approaches. powerful Transformer-based models.
5226A1 : Improved text-triple embedding
The methods above are limited to pair represen-
tations. We improve them by designing B models
that can capture pattern dependencies across q, r
and t. To achieve this, we concatenate pairs of the
three pieces of text. We indicate this string con-
catenation with the ◦ operator. Specifically, we
consider P1 = {(q, r ◦ t), (r, q ◦ t), (t, q ◦ r)} and
propose the following A1 . As before, we have the
individual models, A1 (Bp ), ∀p ∈ P1 as well as the
combined model, A1 (∪p∈P1 Bp ), where again, Bp
uses different instances that are fine-tuned together.
Figure 1: Peer attention on a and b pairs.
A2 : Peer Attention for Transformer models
Our previous designs instantiate different B for 6 Experiments
each pair; thus, they learn the feature representa-
tions of the target pair and the relations between its We study the performance of AVA in predicting:
members during the fine-tuning process. This indi- (i) the correctness of the individual answers output
vidual optimization limits the modeling of patterns by a system (point-wise estimation); and (ii) the
across the representations of different pairs as there overall system performance derived on a test set.
is no attention mechanism between the B instances: We consider QA Accuracy and passage reranking
the combination of features only happens in the last measures in comparison to human labeling. The
classification layer. first aspect evaluates the quality of our approaches,
whereas the second provides evidence on the prac-
We propose Peer Attention to improve feature tical use of AVA to develop QA systems.
connections between different B instances. The
idea, similar to the encoder-decoder setting in 6.1 Datasets and models
Transformer-based models (Vaswani et al., 2017), We train and test models using our new AVA-WQA
is to introduce an additional decoding step for each dataset. We also evaluate the point-wise perfor-
pair. That is, we use another Transformer instance mance on the WikiQA and TREC-QA datasets.
to decode the output from the previous instance. Table 3 summarizes the configurations we con-
sider for training and testing. As the linear classi-
Figure 1 depicts our proposed setting for learn-
fier baseline, we used SVM by scikit-learn, setting
ing the representation of two different pairs: a (e.g.,
the probability parameter to enable Platt scaling
equal to (q, t)) and b (e.g., equal to (q, r)). The ap-
calibration on the classifier score.
proaches from the previous section would learn
We developed our Transformer-based AVA
two Transformer instances, Ba and Bb , with one
on top of the HuggingFace’s Transformer li-
pass. Our Peer Attention, instead, operates two
brary (Wolf et al., 2020), which also offers
steps, using four instances, Ba0 , Ba1 , Bb0 , and Bb1
a native encoder-decoder setting through the
as follows: First, in the encoding step, we learn the
encoder_hidden_states feature. We use
representations, Ba0 and Bb0 , as before. Second, in
RoBERTa-Base as the initial pre-trained model for
the decoding step, we use the H[CLS]a0 from Ba0
each B instance (Liu et al., 2019), with the de-
and H[CLS]b0 from Bb0 , and concatenate them to a
fault hyper-parameter setting of GLUE trainings:
and b, respectively, providing input to Ba1 and Bb1
(i) AdamW variant (Loshchilov and Hutter, 2017)
for the second pass of fine-tuning.
as optimizer, (ii) a learning rate of 1e-06 set for
Thus, the representation in one pair can attend all fine-tuning exercises, and (iii) a maximum se-
over the representation in the other pair during the quence length set to 128. Our number of iterations
decoding stage. This allows the feature represen- is two. We also use a development set to enable
tations from each instance B to be shared during early stopping based on F1 measure after the first
training and prediction stages. The final representa- iteration. We fix the same batch size setting in the
tion input to the classification layers is constituted experiments to avoid possible performance discrep-
by H[CLS]a0 , H[CLS]a1 , H[CLS]b0 , and H[CLS]b1 . ancies caused by different batch sizes.
5227Model Setting Configurations Modeling configuration F1
Linear Classifier using 4 features xi Linear Classifier 0.3999
A0 one for each and one for all from P0 A0 ({(q, r)}) 0.0695
A1 all possible combinations from P1 A0 ({(r, t)}) 0.6247
A2 the best setting from A1
A0 ({(q, t)}) 0.6713
Table 3: The AVA configurations used in training A0 (P0 ) 0.6807
A1 ({(q, r ◦ t)}) 0.7014
A1 ({(r, q ◦ t)}) 0.7383
6.2 Metrics A1 ({(t, q ◦ r)}) 0.7236
We study the performance of AVA in evaluating A1 ({(q, r ◦ t) , (t, q ◦ r)}) 0.7421
passage reranker systems, which differ not only in A1 ({(r, q ◦ t) , (t, q ◦ r)}) 0.7447
methods but also in domains and application set- A1 ({(r, q ◦ t) , (q, r ◦ t)}) 0.7435
tings. We employ the following evaluation strate- A1 (P1 ) 0.7303
gies to benchmark AVA. A2 ((r, q ◦ t) , (t, q ◦ r)) 0.7472
Point-wise evaluation We use Precision, Recall, Table 4: AVA F1 on AVA-WQA test set, using train and
and F1, to measure the performance of AVA in dev. sets from AVA-WQA.
predicting if an answer candidate is correct or not.
System-wise evaluation We use AVA in a sim-
• A0 ({(q, r)}) as expected cannot predict if an
ple aggregator to estimate the overall system per-
answer is correct (its F1 is lower than 7%)
formance over a test set. The metrics we consider
since it does not use the answer representa-
in our estimation are: Precision-at-1 (P@1), Mean
tion.
Average Precision (MAP), and Mean Reciprocal
Rank (MRR), as TREC-QA and WikiQA contain • A0 ({(q, t)}) is already a good model as it is
answer ranks. In contrast, we only use P@1 on SD as much powerful as a QA system.
dataset, as this only includes the selected answers
for each system. • A0 ({(r, t)}) is already a reasonable model,
To measure the quality of AVA with respect to intuitively based on paraphrasing between r
GS annotation we and t, but its F1 is 9% (62.47 vs 68.07) lower
quse (i) Root Mean Square Error: than A0 (P0 ), which uses all information, in-
RMSE (a, h) = n1 Σni=1 (ai − hi )2 , where a and
dicating that the semantic bias of q is essential
h are the measures given by AVA and the human to learn the right similarity between r and t.
annotation, respectively; and (ii) Kendall’s Tau-
b3 to measure the correlation between the system • The results of the A1 models using a single
c−d
ranks produced by AVA and GS one, i.e., τ = c+d , triplet of q, r and t (i.e., 70.14, 73.87, 72.36)
where c and d are the numbers of concordant and indicate that a text concatenation as input to
discordant pairs between the two rankings. Transformer models captures more informa-
tion than concatenating the three separate em-
6.3 Results on Point-wise Evaluation bedding pairs, e.g., A0 ({(r, t)}) only obtains
We evaluate the performance of AVA in predicting 68.07. Interestingly, q text must be concate-
if an answer t is correct for a question q, given a nated with t or r, to generate more effective
reference r. Table 4 shows the result. The first features (2 or 4 points more).
column reports the names of the systems described
• The triplet combination, e.g., A1 {r, q ◦ t),
in Section 5. The second column shows the F1
(t, q ◦ r)} , provides an even more accurate
measured on AVA-WQA. We note that:
model, while the redundant information from
• The SVM classifier performs much lower than A1 (P1 ) does not produce benefits.
any Transformer-based model (fed with a com-
• Finally, the Peer Attention model applied to
plete input): clearly, Transformer models can
the best representations, e.g., A1 {r, q ◦ t),
exploit powerful language models, suggesting
(t, q ◦ r)} , boost them even more, reaching
that generalization is important.
∼75%. This is an important result, consid-
3
We use scipy.stats.kendalltau ering that the annotator agreement (the refer-
5228Metrics RMSE ± σ
Kendall et al., 2020). These models differ in the architec-
τ p tures, BERT vs RoBERTa vs TANDA, and their
P@1 0.000 ± 0.000 1.000 0.003 training data; thus, their output is rather different.
TREC-QA-Dev MAP 0.040 ± 0.019 1.000 0.003 We removed questions that have no correct or no
MRR 0.015 ± 0.011 0.866 0.017
P@1 0.034 ± 0.018 1.000 0.003
incorrect answers.
TREC-QA-Test MAP 0.041 ± 0.029 0.867 0.017 Table 5 reports the overall results averaged over
MRR 0.020 ± 0.012 1.000 0.003 the six models. We note that (i) if we set the thresh-
P@1 0.000 ± 0.000 1.000 0.009 old on the dev. set, the error on P@1 on the dev. set
WikiQA-Dev MAP 0.050 ± 0.039 0.733 0.056
MRR 0.063 ± 0.052 0.690 0.056
is 0, which should not surprise the reader as we fit
P@1 0.079 ± 0.030 0.889 0.017 such set. (ii) This is not the case for MAP, which is
WikiQA-Test MAP 0.081 ± 0.040 0.733 0.056 a much harder value to predict as it requires to esti-
MRR 0.095 ± 0.035 0.867 0.017 mate an entire ranking. (iii) On the TREC-QA test
set, AVA has an error ranging from 2 to 4.1 points
Table 5: System-wise evaluation on TREC-QA and
on any measure. (iv) On the WikiQA test set, the
WikiQA using AVA model, A2 ((r, q ◦ t) , (t, q ◦ r)).
error is higher, reaching 9.5%, probably due to
the fact that WikiQA data is rather different (more
ence is not available to them) is lower than than TREC-QA data) from the data used for train-
25%. ing AVA. (v) the Std. Dev. is low, suggesting that
AVA can be used to estimate system performance,
6.4 Results on system-wise evaluation with an error ranging from 4% to 16.5% at 95%
We evaluate the ability of AVA in predicting the Ac- confidence, depending on measure and dataset.
curacy of QA systems as well as the performance Additionally, we compute the Kendall’s Tau-b
of AS2 tasks. We conduct two evaluation studies correlation between the ranking of the six systems
with two public datasets, TREC-QA and WikiQA, sorted in order of performance (P@1) according
and our SD dataset. to GS and AVA. We observe a perfect correlation
Results on public datasets For TREC-QA and on TREC-QA and a high correlation on WikiQA.
WikiQA, we evaluated a bag of different models This means that AVA can be used to determine if
on the development and test sets and compared the a model is better than another, which is desirable
results to the performance measured by AVA using when developing and/or deploying new systems;
one of the best models according to the point-wise the low p-values indicate reliable results.
evaluation, i.e., A2 ((r, q ◦ t) , (t, q ◦ r)). Finally, Table 7 compares the performance eval-
More specifically, we apply each model m to se- uated with GS and AVA for all six models. It is
lect the best answer t from the list of candidates for interesting to note the high variability of the perfor-
q in the dataset. We first compute the performance mance of our tested QA systems, e.g., P@1 ranges
of model m based on the provided annotations. The from 59.6 to 96.2 (with several intermediate re-
metrics include Accuracy or Precision-at-1 (P@1), sults) on TREC-QA. Nevertheless, as shown in
MAP, and MRR. Table 5, the predictions of AVA are close to those
We then run AVA for (q, t) using the GS answers from humans.
of q as references, r. When multiple references are
Results on SD We use the SD dataset in this eval-
available, the final score of (q, t) is the average of
uation to have a further system-wise evaluation.
AVA scores applied to different r. Before comput-
This differs from the one before as the systems’
ing the Accuracy on the test set, we tune the AVA
configurations and the data reflect an industrial sce-
threshold to minimize the RMSE between the Ac-
nario. The task is more challenging as the output
curacy (P@1) measured by AVA and GS, on the
is not just from one neural model, it comes from a
dev. set of each dataset. We use these thresholds to
combination of modules, ranging from query under-
evaluate the results also on the test sets.
standing, retrieval engine setting, indexed data, doc-
We considered six different systems built with
ument and sentence filters, and finally, the adopted
one Compare-Aggregate (CNN) trained model and
AS2 model. Additionally, the questions set is rather
five other Transformers-based models. Four of the
different from the one used for training. Table 6
latter are collected from public resources4 (Garg
reports the Accuracy of eight QA systems (S1, ...,
4
github.com/alexa/wqa_tanda S8) on the dev. and test sets, evaluated according to
5229Kendall
ADS Split Evaluator S1 S2 S3 S4 S5 S6 S7 S8 RMSE ± σ
τ p
AVA 0.215 0.278 0.22 0.369 0.285 0.294 0.283 0.355
Dev (20%) 0.0198 ± 0.012 0.929 0.0004
GS 0.218 0.282 0.234 0.379 0.309 0.315 0.261 0.319
AVA 0.235 0.289 0.235 0.355 0.319 0.321 0.301 0.357
Test (80%) 0.0350 ± 0.019 0.643 0.031
GS 0.235 0.324 0.26 0.393 0.356 0.365 0.249 0.336
Table 6: Systems’ P@1 evaluated with AVA and the GS annotations of SD
Metrics M1 M2 M3 M4 M5 M6 e.g., 0.596. In the first question, this is possible
P@1 0.717 0.870 0.891 0.935 0.739 0.826 since AVA can match the winner of the literature
Gold
MAP 0.691 0.858 0.913 0.912 0.769 0.796
TREC-Dev
MRR 0.819 0.923 0.937 0.967 0.835 0.890 prize, Sully Prudhomme, as well as the year of the
P@1 0.717 0.870 0.891 0.935 0.739 0.826 event with the answer candidate. This match can
AVA
MAP 0.688 0.831 0.864 0.857 0.717 0.772
MRR 0.809 0.920 0.940 0.967 0.803 0.876 not happen with the question.
P@1 0.596 0.885 0.904 0.962 0.712 0.788 In the second question, Eileen Marie can be
Gold
MAP 0.661 0.873 0.894 0.904 0.771 0.801
TREC-Test
MRR 0.763 0.933 0.945 0.976 0.820 0.869
matched with the question but there is basically
P@1 0.635 0.904 0.962 0.981 0.712 0.827 no direct match between branch of the service and
AVA
MAP 0.639 0.845 0.896 0.886 0.680 0.789
MRR 0.764 0.936 0.981 0.990 0.793 0.880
to command a space shuttle mission as air force col.
In contrast, the reference provides easy matching,
P@1 0.545 0.727 0.455 0.545 0.636 0.727
such as air force colonel and command a space
Gold
WikiQA-Dev
MAP 0.636 0.744 0.656 0.621 0.755 0.781
MRR 0.720 0.831 0.695 0.703 0.803 0.864 mission. A similar rationale applies to the third
P@1 0.545 0.727 0.455 0.545 0.636 0.727
question.
AVA
MAP 0.523 0.751 0.643 0.617 0.713 0.774
MRR 0.568 0.841 0.682 0.698 0.788 0.841 Conversely, a wrong answer could be classified
P@1 0.563 0.844 0.781 0.688 0.813 0.781
as such by AVA, even if TANDA assigned it a very
Gold
WikiQA-Test
MAP 0.634 0.778 0.753 0.746 0.834 0.820
MRR 0.746 0.917 0.876 0.833 0.906 0.883 large score. For example, 1988 can be a reason-
P@1 0.625 0.781 0.719 0.656 0.719 0.656
able date in an answer to the fourth question. This
AVA
MAP 0.660 0.750 0.687 0.683 0.705 0.704
MRR 0.732 0.820 0.783 0.741 0.791 0.762 match prevents the selector to discard the answer.
In contrast, the date above does not match with
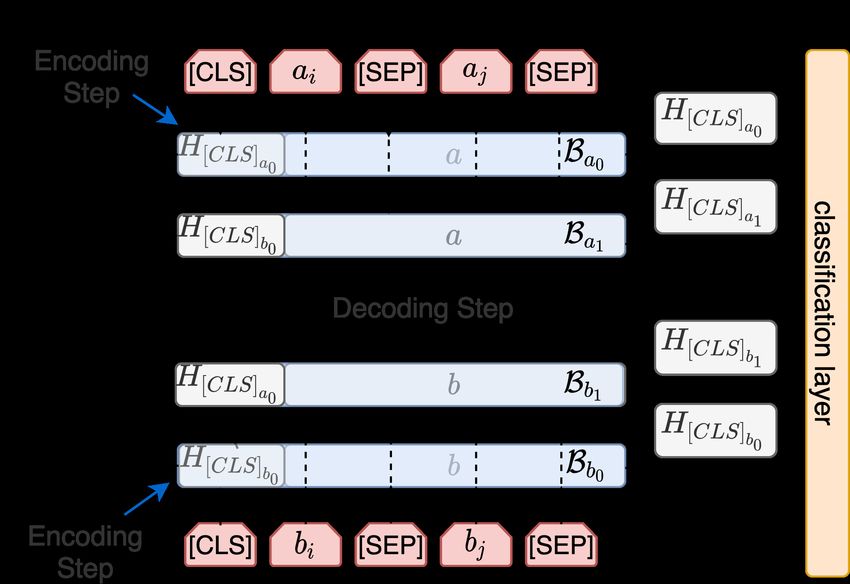
Table 7: Details of system-wise evaluation on 1986 in the reference, and the importance of this
TREC-QA and WikiQA using AVA model and GS,
mismatch is amplified by the presence of when in
A2 ((r, q ◦ t) , (t, q ◦ r))
the question, which suggests AVA to pay attention
to dates (in line with peer-attention modeling).
GS and AVA, along with RMSE and Kendall statis-
AVA vs. Overfitted reranker We investigated
tics of the two different evaluations. The RMSE
the performance of AVA in an open-domain set-
is rather low 3.5% with a standard deviation of
ting, where the candidate answers are all sentences
1.9%, which indicates a max prediction error less
contained in the retrieved web documents.
than ±7% with a confidence of 95%. The rank
Given a question, we analyzed the top-1 candi-
correlation is lower than what was observed on
dates reranked by two models: (i) a Transformer-
the academic benchmarks as the 8 evaluated sys-
based reranker fine-tuned on the same test ques-
tems have very close Accuracy. In any case, AVA
tions (overfitting them); and (ii) the general AVA
can still be effectively used to select the top 3-4
model using the answer the reranker was trained
systems.
on, as reference. We used ASNQ (Garg et al.,
2020) questions, which are typically associated
6.5 Qualitative Analysis
with only one correct answer. For each ques-
Table 8 reports some example questions from tion, we retrieved the top 200 relevant documents,
TREC-QA test set, the top candidate selected by ∼10,000 sentences, from a large index built with
the TANDA system (Garg et al., 2020), the classifi- the 100MM documents from Common Crawl
cation score of the latter, and the AVA score, which (commoncrawl.org), and used them as input
will determine a correct answer when it is larger of our models.
than 0.5. For the first three questions, we note that, We manually evaluated the top-1 answer candi-
even thought the score of TANDA system is low, date produced by the reranker and AVA for 100
e.g., 0.0001, AVA can assign a rather high score, randomly selected questions. The results show that
5230Question q Candidate t Reference r
TANDA A
when were the no- among them is the winner of the 0.0001
leo tolstoy lost the first literature 0.596
bel prize awards first first prize in 1901 , sully prud- (correct)
prize in 1901 to the forgettable rene
given ? homme . f . a . sully prudhomme .
what branch of the ser-the first woman to command a 0.046 shuttle commander eileen collins 0.895
vice did eileen marie space shuttle mission , air force col
(correct) , a working mother and air force
collins serve in ? . eileen collins , sees her flight next colonel , was set to make history
month as `` a great challenge ” in as the first woman to command a
more ways than one . space mission .
what was johnny ap- appleseed , whose real name was 0.026 whitmore said he was most fasci- 0.948
pleseed ’s real name ? john chapman , planted many trees (correct) nated with the story of john chap-
in the early 1800s . man , who is better known as
johnny appleseed .
when was the chal- sept . 29 , 1988 _ americans return 0.995 challenger was lost on its 10th mis- 0.080
lenger space shuttle to space aboard the shuttle discov- (incorrect) sion during a 1986 launch accident
disaster ? ery , after a 32-month absence in that killed seven crew members .
the wake of the challenger accident
.
Table 8: Examples show AVA can detect the failures of the state-of-the-art model by Garg et al. (2020).
Ques. q Reference r Overfitted Reranker A
when did apple com- On January 9 , 2007 , Apple In 2007, Apple Computer, Inc.
puter change to apple Computer , Inc. shortened its On January 9th, 2007 “Apple Com- changed their name to Apple, Inc.
inc name to simply Apple Inc . puters” was renamed “Apple Inc.” to
reflect the shift in focus towards cos-
tumers electronics.
how much gold is As of November 2017, Fort At over 15 million ounces of gold, the According to official records, Fort
there in fort knox Knox holdings are 4,582 met- deposit is one of the world’s largest, lo- Knox holds 4,578 metric tons of gold
ric tons (147.3 million oz. cated in an area designated for mining.5 bullion, or roughly 2.5% of the entire
troy). world’s known gold supply.
what muscle in the up- The pectoralis major is a thick The upper portion of your back is re-
per body covers the , fan - shaped muscle , situ- ferred to as the thoracic spine, and it Chest presses focus on exactly that–the
upper chest ated at the chest ( anterior ) of includes the trapezius, rhomboids, teres chest muscle, called the pectoralis ma-
the human body . muscles, infraspinatus, and lats. jor.
Table 9: Examples show AVA can identify correct answers sharing the semantics of the questions.
AVA is much more accurate than the overfitted models and a new peer attention approach to cap-
reranker, 66% versus 25%. ture answer and reference similarity induced by the
Table 9 shows some questions q, with their ref- question semantics. Our extensive experimentation
erences r, and the answers selected by the two has shown the AVA effectiveness for different types
models. We note that the overfitted reranker selects of evaluation: point-wise and system-wise over Ac-
answers that either (i) highly overlap with the ref- curacy, MAP and MRR. The results suggest that
erence (first example), or (ii) are typically wrong AVA can estimate the measures above, with a max
when such continuous word overlapping is missing error of 7% at 95% of confidence.
(second and third examples). AVA can also be applied to generate distant su-
In contrast, AVA selects answers that are rather pervision data. An example of this future applica-
different from the reference, even though they share tion is given by (Krishnamurthy et al., 2021).
the same semantics in answering the question.
7 Conclusion References
Jacob Devlin, Ming-Wei Chang, Kenton Lee, and
We have presented AVA, the first automatic evalua- Kristina Toutanova. 2019. BERT: Pre-training of
tor method for QA systems. We created seven dif- deep bidirectional transformers for language under-
ferent datasets, classified into three different types, standing. In NAACL 2019, pages 4171–4186, Min-
neapolis, Minnesota. Association for Computational
which we used to develop AVA. We released those
Linguistics.
based on public data and plan to release the others.
Then, we proposed different Transformer-based Siddhant Garg, Thuy Vu, and Alessandro Moschitti.
52312020. TANDA: transfer and adapt pre-trained trans- Bernardo Magnini, Matteo Negri, Roberto Prevete, and
former models for answer sentence selection. In Hristo Tanev. 2002. Towards automatic evaluation
AAAI 2020, pages 7780–7788. AAAI Press. of question/answering systems. In LREC 2002.
Sarik Ghazarian, Johnny Wei, Aram Galstyan, and Tom Mitchell, Terry Russell, Peter Broomhead, and
Nanyun Peng. 2019. Better automatic evaluation of Nicola Aldridge. 2002. Towards robust comput-
open-domain dialogue systems with contextualized erised marking of free-text responses.
embeddings. In Proceedings of the Workshop on
Methods for Optimizing and Evaluating Neural Lan- Michael Mohler, Razvan Bunescu, and Rada Mihalcea.
guage Generation, pages 82–89, Minneapolis, Min- 2011. Learning to grade short answer questions us-
nesota. Association for Computational Linguistics. ing semantic similarity measures and dependency
graph alignments. In ACL 2011, pages 752–762,
Tilani Gunawardena, Nishara Pathirana, Medhavi Portland, Oregon, USA. Association for Computa-
Lokuhetti, Roshan G. Ragel, and Sampath Deegalla. tional Linguistics.
2015. Performance evaluation techniques for an au- Kishore Papineni, Salim Roukos, Todd Ward, and Wei-
tomatic question answering system. International Jing Zhu. 2002. Bleu: a method for automatic eval-
Journal of Machine Learning and Computing, Vol. 5, uation of machine translation. In ACL 2002, pages
No. 4, August 2015. 311–318, Philadelphia, Pennsylvania, USA. Associ-
ation for Computational Linguistics.
Anjuli Kannan and Oriol Vinyals. 2017. Adver-
sarial evaluation of dialogue models. CoRR, Stephen G. Pulman and Jana Z. Sukkarieh. 2005. Auto-
abs/1701.08198. matic short answer marking. In Proceedings of the
Second Workshop on Building Educational Applica-
Vivek Krishnamurthy, Thuy Vu, and Alessandro Mos- tions Using NLP, pages 9–16, Ann Arbor, Michigan.
chitti. 2021. Reference-based weak supervision for Association for Computational Linguistics.
answer sentence selection using web data.
Brian Riordan, Andrea Horbach, Aoife Cahill, Torsten
Zhenzhong Lan, Mingda Chen, Sebastian Goodman, Zesch, and Chong Min Lee. 2017. Investigating neu-
Kevin Gimpel, Piyush Sharma, and Radu Soricut. ral architectures for short answer scoring. In Pro-
2020. Albert: A lite bert for self-supervised learn- ceedings of the 12th Workshop on Innovative Use of
ing of language representations. In ICLR 2020. NLP for Building Educational Applications, pages
159–168, Copenhagen, Denmark. Association for
Jochen L. Leidner and Chris Callison-Burch. 2003. Computational Linguistics.
Evaluating question answering systems using faq an-
swer injection. In Proceedings of the 6th Annual Chirag Shah and Jefferey Pomerantz. 2010. Evaluating
CLUK Research Colloquium. and predicting answer quality in community qa. In
SIGIR 2010, pages 411–418, New York, NY, USA.
Jimmy J. Lin and Dina Demner-Fushman. 2006. Meth- ACM.
ods for automatically evaluating answers to complex
questions. Information Retrieval, 9:565–587. Gehui Shen, Yunlun Yang, and Zhi-Hong Deng. 2017.
Inter-weighted alignment network for sentence pair
Yinhan Liu, Myle Ott, Naman Goyal, Jingfei Du, Man- modeling. In EMNLP 2017, pages 1179–1189,
dar Joshi, Danqi Chen, Omer Levy, Mike Lewis, Copenhagen, Denmark. Association for Computa-
Luke Zettlemoyer, and Veselin Stoyanov. 2019. tional Linguistics.
Roberta: A robustly optimized BERT pretraining ap-
proach. CoRR, abs/1907.11692. Chongyang Tao, Lili Mou, Dongyan Zhao, and Rui
Yan. 2017. RUBER: an unsupervised method for au-
Ilya Loshchilov and Frank Hutter. 2017. Fixing tomatic evaluation of open-domain dialog systems.
weight decay regularization in adam. CoRR, CoRR, abs/1701.03079.
abs/1711.05101. Ashish Vaswani, Noam Shazeer, Niki Parmar, Jakob
Uszkoreit, Llion Jones, Aidan N Gomez, Łukasz
Ryan Lowe, Michael Noseworthy, Iulian Vlad Ser- Kaiser, and Illia Polosukhin. 2017. Attention is all
ban, Nicolas Angelard-Gontier, Yoshua Bengio, and you need. In Advances in Neural Information Pro-
Joelle Pineau. 2017. Towards an automatic Turing cessing Systems, volume 30. Curran Associates, Inc.
test: Learning to evaluate dialogue responses. In
ACL 2017, pages 1116–1126, Vancouver, Canada. E. Voorhees and D. Tice. 1999. The TREC-8 Question
Association for Computational Linguistics. Answering Track Evaluation, pages 77–82. Depart-
ment of Commerce, National Institute of Standards
Qingsong Ma, Johnny Wei, Ondřej Bojar, and Yvette and Technology.
Graham. 2019. Results of the WMT19 metrics
shared task: Segment-level and strong MT systems Tianqi Wang, Naoya Inoue, Hiroki Ouchi, Tomoya
pose big challenges. In WMT 2019, pages 62–90, Mizumoto, and Kentaro Inui. 2019. Inject rubrics
Florence, Italy. Association for Computational Lin- into short answer grading system. In Proceedings of
guistics. the 2nd Workshop on Deep Learning Approaches for
5232Low-Resource NLP (DeepLo 2019), pages 175–182,
Hong Kong, China. Association for Computational
Linguistics.
Thomas Wolf, Lysandre Debut, Victor Sanh, Julien
Chaumond, Clement Delangue, Anthony Moi, Pier-
ric Cistac, Tim Rault, Remi Louf, Morgan Funtow-
icz, Joe Davison, Sam Shleifer, Patrick von Platen,
Clara Ma, Yacine Jernite, Julien Plu, Canwen Xu,
Teven Le Scao, Sylvain Gugger, Mariama Drame,
Quentin Lhoest, and Alexander Rush. 2020. Trans-
formers: State-of-the-art natural language process-
ing. In EMNLP 2020: System Demonstrations,
pages 38–45, Online. Association for Computational
Linguistics.
Zhilin Yang, Zihang Dai, Yiming Yang, Jaime Car-
bonell, Russ R Salakhutdinov, and Quoc V Le. 2019.
Xlnet: Generalized autoregressive pretraining for
language understanding. In Advances in Neural In-
formation Processing Systems, volume 32. Curran
Associates, Inc.
Seunghyun Yoon, Franck Dernoncourt, Doo Soon Kim,
Trung Bui, and Kyomin Jung. 2019. A compare-
aggregate model with latent clustering for answer se-
lection. In CIKM 2019, pages 2093–2096. ACM.
Tianyi Zhang, Varsha Kishore, Felix Wu, Kilian Q.
Weinberger, and Yoav Artzi. 2020. Bertscore: Eval-
uating text generation with bert. In ICLR 2020.
5233You can also read