Available online www.jsaer.com Journal of Scientific and Engineering Research, 2021, 8(1):196-202
←
→
Page content transcription
If your browser does not render page correctly, please read the page content below
Available online www.jsaer.com

 Journal of Scientific and Engineering Research, 2021, 8(1):196-202

 ISSN: 2394-2630
 Review Article CODEN(USA): JSERBR

Determination of Grain Losses on Combine Harvester

Mustafa Ahmed Jalal Al-Sammarraie*, Saba Abdulaziz Alhadithi

Department of Agricultural Machinery and Equipment, College of Agricultural Engineering Sciences,
University of Baghdad, Baghdad, Iraq
* Corresponding Author Email: mustafa.ahm@coagri.uobaghdad.edu.iq
Abstract In this study, an explanation of how to determine the values of the harvesting losses was given, for the
harvested crops resulting from using the combine harvester according to the old traditional methods and modern
methods. The way of how the maps of the grain losses are obtained and evaluated was discussed. The traditional
method of measuring grain loss is time-consuming, labor-expensive, tedious and is costly in terms of economic
aspects. When determining grain loss by modern methods, efficiency increases and grain loss reduces through
immediate intervention to fix the problem. The Global Positioning System (GPS) is used to determine the
location of the loss in the field, hence by using a group of sensors to measure the grain loss and correlate these
values with the location, a grain loss variance map can be drawn by the GIS program. By using and developing
this technology, it will be possible to carry out harvesting operations more easily and at a lower cost.

Keywords combine harvester, grain losses, Global Positioning System, GIS program
1. Introduction
Grains, especially wheat, are one of the main materials in the people's diet, thus it constitutes a strategic crop.
As a result of the sharp increase in the population, its consumption is constantly increasing. Therefore, it is a
priority to take it into account to increase the effort of yield production by reducing losses which result in self-
sufficiency. An enormous range of crops is harvested from oilseeds, grasses, and alfalfa seeds using mechanical
harvesters [1]. Agricultural mechanization, which is widely used at different stages of agricultural production,
including production, harvesting and threshing processes is becoming increasingly important [2]. In addition to
the scientific studies conducted to increase productivity, the crop must be harvested with fewer losses and
nevertheless shorter time. During harvesting, a part of the crop is lost by using the harvester installed in the field
as a loss of grain, thus the effort to increase the yield is wasted to some extent. Yield losses cannot be reduced to
zero, but the loss rate can be reduced to an acceptable level through appropriate adjustments to units of cutting,
threshing, separation and cleaning depending on the characteristics of the crop [3-4]. Since there is a significant
proportion of losses of wheat produced during harvest, the losses incurred by using the combine harvester are
one of the main concerns in reducing the percentage of waste [5]. The accepted amount of yield loss is 4-5%
worldwide [6]. Grain loss occurs in four main units of the combine harvester that operate simultaneously during
harvesting. These units are cutting, threshing, separator and cleaning units [7]. The event of waste in cereal
crops during automatic harvesting is one of the important economic problems, and the importance of
researching it and reducing its risk increases if we know that the rate of growth in production for the global
agricultural sector did not reach 2% at the time when the percentage of losses during automatic harvesting
reached 35% [8]. The greatest loss is concentrated in the automatic harvesting with the wrong performance in
terms of adjusting and calibration of the units that are operating in the harvester. Thus the farmer does not take
into account the importance of these variables. furthermore, there is a group of interaction factors that lead to the

 Journal of Scientific and Engineering Research

 196
Al-Sammarraie MAJ & Huong SAA Journal of Scientific and Engineering Research, 2021, 8(1):196-202

reduction of the efficiency of the harvester performance includes, including the nature of the field, the type of
crop, the variety, the degree of maturity and angle of inclination, etc. [9].
This study aims to Acquaint with the methods of measuring the loss of grains in the combined harvester, starting
from the traditional method up to the modern technologies that depend on the precision farming system.

2. Type of losses
There are different types of grain losses in the field before and during the combining of crops. Moisture contents
at the time of harvesting affect the grain losses. At low moisture content, grain losses are pre-harvest shattering
loss, cutter bar loss and more breakage of grain. At low moisture, the straw is broken finely by the cylinder and
more material flows to the sieve resulting in a separation problem. There is a risk of natural hazards like rain and
hailstorm, which also leads to the lodging of the crop. Due to delay in harvesting, more weed growth takes place
that causes choking of the combine. At high moisture content, grains are badly damaged by the cylinder action.
The threshing is poor and good cleaning is also a problem. This leads to higher cylinder loss and lower cleaning
efficiency. The grains get stuck to moist straw and are carried away with straw and chaff. There might be a
choking problem at different stages in the combination due to high moisture content. The combined losses
should be a maximum of 2.5% for wheat, paddy and gram and 4.0% for soybean [10].
Losses, with the best combine adjustments, will vary greatly depending upon the type’s variety and the
condition of the crop. Total losses in a clean crop of wheat oats and barley will vary from 1% to 4% of total
yield. Under good harvesting conditions, the total loss should not be more than 1.5% [10].
 1. Cutter bar loss - 0.5 to 2%.
 2. Cylinder loss - 0.5 to 1%.
 3. Straw walkway loss - 0.2 to 0.4%.
 4. Upper sieve loss - 0.2 to 0.4%.

3. Measuring grain losses
The difference between the quantity of grain in the field (field productivity) and the amount of the harvested
grain (machine productivity) constitutes the loss of grain in the harvest. When determining grain losses in the
field, total losses are generally taken into account. There are electrical measuring devices and systems that
determine productivity instantly, in addition to the measurement methods followed with simple methods such as
frames, framed fabric, and covers [11].

4. Methods used to measure grain losses
Method of three-quarters of a square meter
When measuring grain losses, it is necessary to know the field yield per Dakar (kg / Dakar) (Hectares = 10
Dakar( , or the weight of 1,000 grains per unit ofarea. The main purpose of the method used in measurement is
to find the quantity of the lost grain per unit of area in percentage. The three-quarters of a square meter method
is used because it is easy to apply and calculate in a short time.
In this method, the measurement is taken with frames of 50 x 50 cm of a quarter square meter (0.25 m2). These
frames are placed in the harvested places behind the combine harvester (the positions through which the two
crop determining dividers plate, on both sides and in the center of the collected straw path). When placing the
frames, the crop divider trace is found first. Then the frames are placed in the locations of the trace to determine
the harvest on both sides at a distance of 5 cm to the outside, as shown in Figure 1. To find the rate of loss, all
the ears are collected from the inside of the frame, rubbed and their grains are collected with the grains scattered
inside the frame. The grains collected from inside the frame are multiplied by the weight of a thousand grains
and are measured in units of kilograms. The weight of the grain is multiplied by a constant of 133 (the number
which equates to three-quarters of a square meter to one square meter) afterward dividing it by the field
productivity. Grain loss is given as a percentage, and grain loss is calculated using the following concept [11]:

 Journal of Scientific and Engineering Research

 197
Al-Sammarraie MAJ & Huong SAA Journal of Scientific and Engineering Research, 2021, 8(1):196-202

 Figure 1: Sampling locations (frames)
 + + ∗
 = ............. 1

 ∗
 % = ............. 2

A: Total grain loss (grams).
a: Loss of grain in the left frame (grams).
b: Loss of grain in the right frame (grams).
c: Loss of grains in the middle frame (grams).
Q t : Average field productivity (kg / Dakar).
133: The number that equals three-quarters of a square meter to one square meter.

Field productivity
Field productivity is measured before harvesting using a frame of 1m2. Samples are taken from several different
places in the field productivity is calculated based on the following equation [12-13]:

 = ......... 3

 : Field Productivity (kg / Dakar).
 : Total grain yield of the samples taken (g / m2).
n: the number of samples taken in the field.
The loss percentage using the previous equation for a field yield of 250 kg / Dakar, the weight of a thousand
grains is 45 g and the weight of the grains taken from the frames is 120 g is estimated at 2.9%.
Also, charts have been developed to provide practical use of this method. With this method, the same rates can
be found easily without any calculation in field conditions. Figure 2 shows the diagram developed for this
purpose [14].

 Journal of Scientific and Engineering Research

 198
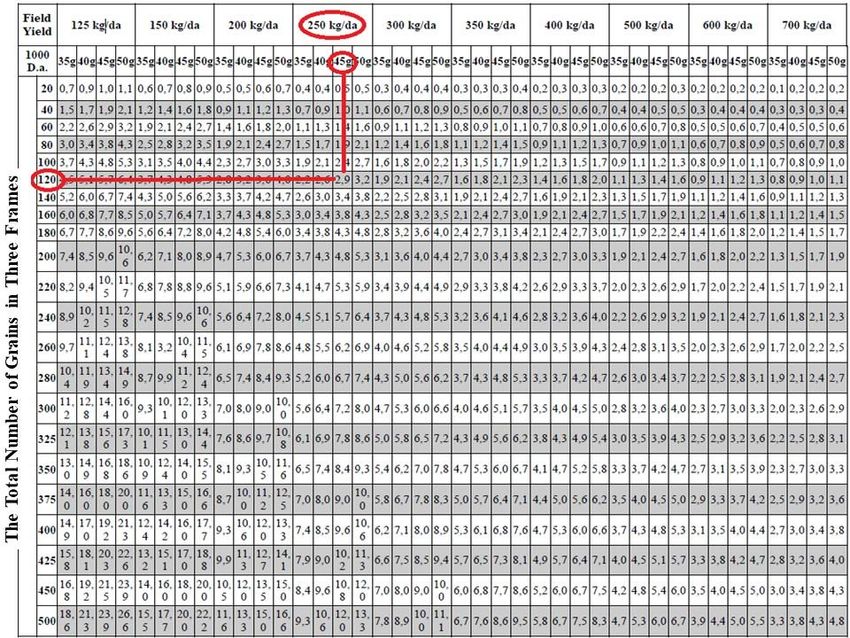
Al-Sammarraie MAJ & Huong SAA Journal of Scientific and Engineering Research, 2021, 8(1):196-202

 Figure 2: Graph of measuring grain loss
The following method can be applied in determining the productivity and the quantity of loss at each point of
the field.
In recent years, applied precision agricultural technology or precision farming has become more popular among
researchers. Precision agriculture is done using satellites, sensors and maps. The aim is to control all inputs in
the field productivity to reduce environmental waste and increase revenues [15]. A productivity map can be
prepared during harvest. Yield is measured and recorded continuously during harvest. These systems usually
record each data point separately. It is also possible to determine the harvested area. If the yield value
determined by this method is combined with site data, productivity maps can be generated for the specific unit
area. In determining the time being yield value, the yield quantity sensor, the crop moisture content sensor, the
feed rate sensor, the differential global positioning system (DGPS) with error correction, the control of the start
and end of the harvest, the internal temperature, the grain loss sensor, the working width sensor, the density
sensor. Product, Computer, Monitor, PCMCIA, Personal computer memory cards and mapping software are
used [16].
One of the components of a productivity monitoring system that is included in data collection techniques, which
is one of the first aforementioned parts of precision farming is the product loss sensors. Figure 3 shows the
sensor positions used to measure harvest losses. Accordingly, there are two sensors in the grain loss measuring
system, one is below the straw walkway and the other is below the upper sieve.

 Journal of Scientific and Engineering Research

 199
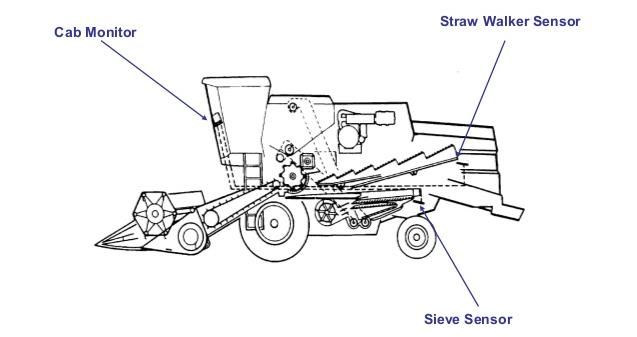
Al-Sammarraie MAJ & Huong SAA Journal of Scientific and Engineering Research, 2021, 8(1):196-202

 Figure 3: Positions of the grain loss measurement sensors
These sensors convert the sound effect of impacting with the grains into frequency signals [7]. Signal height is
considered to represent agrain returning to the field as a harvesting loss. This frequency signal is converted into
a grain loss value with a suitable electronic circuit along with the necessary calculations [17].
A grain loss monitoring kit is provided to be installed on the combined harvesters for sensitive detection of grain
loss. Figure 4 shows the parts that constitute the electronic grain loss measurement model [18]:
 1. Monitor.
 2. The straw walkway sensor.
 3. The upper sieve sensor.
 4. Speed sensor.
 5. Connections.

 Figure 4: The parts that constitute the grain loss monitoring kit [18]
If the functions of the buttons and indicators of the grain loss monitoring are shown in Figure are explained; an
indicator with green and red bars on the monitor is present. The green bar in this indicator denotes an acceptable
grain loss, while the red bar denotes an excessive grain loss.
The data needed to create the implementation plans are collected. This stage includes techniques such as yield
monitoring and mapping. Data processing and decision making is the second stage and it is implemented using
Geographic Information Systems (GIS). Data on the field and crop characteristics obtained using GIS are

 Journal of Scientific and Engineering Research

 200
Al-Sammarraie MAJ & Huong SAA Journal of Scientific and Engineering Research, 2021, 8(1):196-202

collected; the data is subject to processing, storage and analysis processes for decision-making purposes. By the
virtue of this technology, variable quantities of agricultural inputs are applied to each point of the field
according to needs and decisions made using geographic information systems. The two pictures show (figure 5)
a map of variation in grain loss for specific areas in the field using modern technology based on loss sensors for
two consecutive years.

 Figure 5: A map of variation in grain losses for two different years [7]

5. Conclusions
The traditional grain loss measurement method used in practice is time-consuming, labor costing and at the
same time tedious and costly in terms of economic aspects for operators and controllers. By sensitively
determining grain loss, increases efficiency and prevents loss of labor, time and economy through immediate
operator intervention in the cause of the loss. A yield control system is a component of precision farming that
measures yield coefficients at the right point and at the right time. In combination with geographic information
systems, useful images of field and yield conditions can be created. When the information resulting from yield
monitoring is adequately interpreted, it provides proper decisions in real-time harvesting of the crop or carrying
out operations such as fertilization at a variable rate. It is important to investigate the causes of variation and
provide important data for agricultural practices in the coming years.

References
 [1]. Kutz, M., 2007, Handbook of farm, dairy, and food machinery, William Andrew.
 [2]. Tandon, S. K., Sirohi, B. S., & PB, S. S. (1988). Threshing efficiency of pulses using step-wise
 regression technique. Agricultural Mechanization in Asia, Africa, and Latin America, 19(3), 55-57.
 [3]. Sessiz, A., Pekitkan, F. G., & Turgut, M. M. (2006). Hasat Kayıpları, Nedenleri, Ölçme Yöntemleri ve
 Azaltma Yolları. Tarımsal Mekanizasyon, 23, 6-8.
 [4]. Jung, R. (1981). Measuring Soybean Harvesting Losses. Factsheet. Ministry Of Agriculture. Food and
 Rural Affairs.
 [5]. Tavasoli, A., 2002, Investigation on the effect of speed and reel type indexes of combine on losses
 while reaping wheat through design and developing reel speed control mechanism, M. Sc. Thesis,
 Tarbiat Modares University, Iran.
 [6]. Karaj, I. (2011). Investigation on grain losses of the JD 1165 combine harvester equipped with variable
 pulley and belt for forward travel. American Journal of Food Technology, 6(4), 314-321.
 [7]. Eroğlu, M. C., 2010, Konya bölgesinde kullanılan biçerdöverlerde hassas tarım teknolojileri yardımıyla
 dane kayıplarının denetlenmesi imkânlarının araştırılması, Selçuk Üniversitesi Fen Bilimleri Enstitüsü.
 [8]. Hadithi, Suda sabit (1998). The economic importance of lost wheat and barley crops during the
 marketing process in Iraq, Iraqi Journal of Agricultural Sciences, Volume 29, Issue 1

 Journal of Scientific and Engineering Research

 201
Al-Sammarraie MAJ & Huong SAA Journal of Scientific and Engineering Research, 2021, 8(1):196-202

 [9]. Al-Jubouri, Abdul Amir Nasser Hussein (2000). The technical-economic study of wheat loss during
 mechanical harvest in irrigated areas - Al-Musayyib Al-Kabeer Project, Applied Model, Master Thesis,
 College of Agriculture, University of Baghdad, Iraq.
 [10]. Dixit, A., Singh, S., (1981). Farm Machinery and Equipment II.
 [11]. BARAN, M. F., ÜLGER, P., Kayişoğlu, B., & Kayişoğlu, B. (2012). Kanola Hasadında Kullanılan
 Tablanın Hasat Kayıpları Üzerine Etkisi. Tekirdağ Ziraat Fakültesi Dergisi, 9(3), 35-44.
 [12]. Ülger, P. (1982). Buğday Hasat Harmanında Uygulanan Değişik Mekanizasyon Sistemlerinin Tane
 Ürün Kayıplarına Etkileri. Hasat Öncesi ve Hasat Sonrası Ürün Kayıpları Seminer Bildirileri, 13-17.
 [13]. Avcı, G. G. (1997). Biçerdöverle Ayçiçeği Hasadında Kayıpların Saptanması Üzerine Bir Araştırma.
 Yüks ek Li s ans Tezi, TÜ Fen Bi li ml eri Ens ti tüs ü, Teki rda ğ.
 [14]. Anonymous, 2011, Biçerdöverle Hasat 525MT0253, Millî Eğitim Bakanliği.
 [15]. Larscheid, G., & Blackmore, B. S. (1996, January). Interactions between farm managers and
 information systems with respect to yield mapping. In Proceedings of the Third International
 Conference on Precision Agriculture (pp. 1153-1163). Madison, WI, USA: American Society of
 Agronomy, Crop Science Society of America, Soil Science Society of America.
 [16]. Akdemir, B., & Blackmore, S. (2004). Verim Haritası Hazırlama Üzerine Bir Araştırma. Journal of
 Agricultural Sciences, 10(01), 38-44.
 [17]. Reed, W. B., Grovum, M. A., & Krause, A. E. (1969). Combine harvester grain loss monitor. Agr Eng.
 [18]. Anonymous, 2014, Entry 6510 Capacity Monitor Operators Manual & Fitting Instructions.

 Journal of Scientific and Engineering Research

 202
You can also read